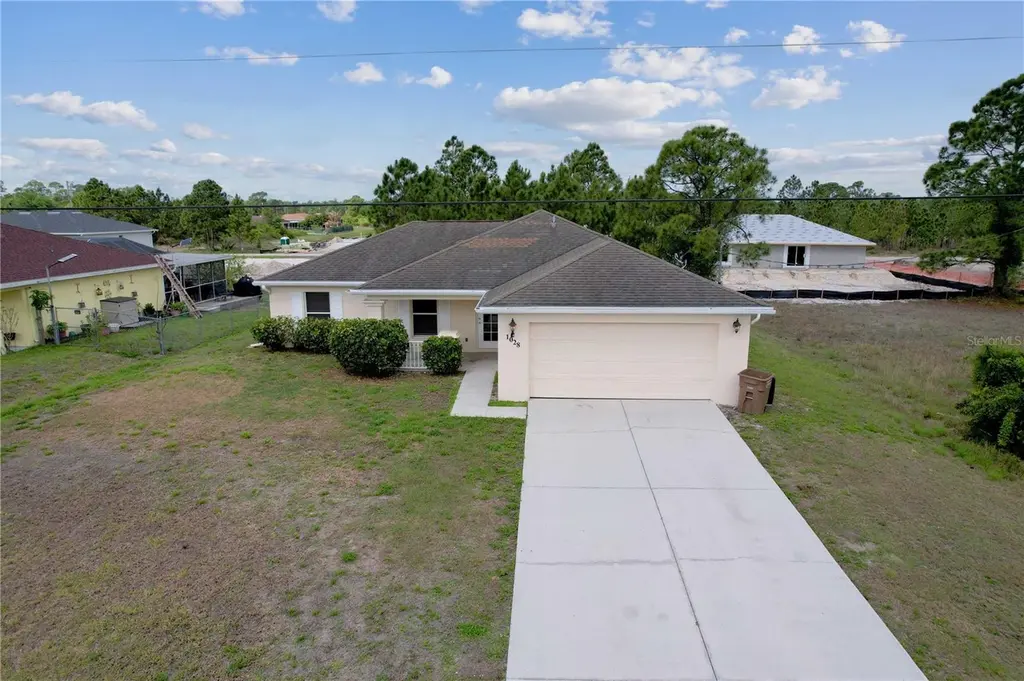
1028 Columbus Blvd S · Lehigh Acres, FL
Flood risk 1/10 · Minimal
- FEMA flood zone
- X (unshaded)
- Chance of flooding over 30 yrs
- 0.0%
- Est. flood insurance / yr
- $507 – $1,088
Fire risk 2/10 · Minimal
- Est. fire insurance / yr
- $947 – $1,759
Heat risk 9/10 · Severe
- Hot days now (above 109°F)
- 7 days/yr
- Hot days in 30 yrs
- 27 days/yr
Wind risk 10/10 · Severe
- Chance of severe wind over 30 yrs
- 99.0%
Air-quality risk 2/10 · Minimal
- Unhealthy air days now
- 1 days/yr
- Unhealthy air days in 30 yrs
- 2 days/yr
Risk factors via First Street. Map © Google.
Why this score? — see what drove the C grade
The composite is a weighted blend of 9 inputs, each scored 0–100. Each bar is that input's sub-score; the figure is the points it added to the 100-point composite (weight × sub-score).
- ARV discount +15.0/15.0
- Cash flow +14.6/30.0
- Appreciation +10.0/10.0
- DSCR +4.4/10.0
- Schools +4.1/10.0
- 1% rule +3.5/10.0
- Livability +3.0/5.0
- Condition / age +2.5/5.0
- Rent growth +1.3/5.0
$235,000
🖨 Deal sheet 📄 Offer letter ✓ Due diligence
Listing remarks MLS
This home is a 3 bedroom, 2 bath, 2 car garage on a . 25 acre lot. Offers a great room, eat in kitchen, pantry, a small area with a computer desk and a lanai. Home is being sold As Is With Right To Inspect. A prequalification from a branch office of Bank of America Home Loans required for all financed offers. Finance with Bank of America and receive a free credit report and appraisal.
Key facts
- 0.23 acre lot
- 2 garage spots
- Built 2004
Property features AI
Finance
- Other: Residential property (RS-1 zoning)
- HOA & community: No HOA/association indicated; Pets allowed
Exterior
- Parking: Attached 2-car garage (20x20)
- Utilities: Well water; Septic tank sewer; Electricity connected
- Home design: Single family residence; One story; Faces east
- Construction: Stucco construction; Shingle roof; Slab foundation; Built on a 0.23-acre lot
- Exterior features: Other exterior features; Asphalt road access
Interior
- Kitchen: Cooktop; Dishwasher; Microwave; Refrigerator; Electric water heater
- Bedrooms: 3 bedrooms
- Flooring: Tile
- Bathrooms: 2 full bathrooms
- Heating & cooling: Central heating; Central air conditioning
- Interior features: Other interior features
- Laundry & utility: Inside laundry; Dryer
Neighborhood map
What this means for you Summary
Snapshot
- This is a 3-bed/2.0-bath single-family listed at $235k.
Deal economics
- At list price, monthly cash flow is $55 ($665/yr) — positive.
- The deal already cash-flows at list — no discount required.
- To meet the 1% rule (rent ≥ 1% of price), the offer needs to be $201k (14.5% below list).
- Recommended offer: $201k (14.5% below list) — sets the bar for 1% rule.
- Cap rate 6.6% vs local median 4.7% in Lehigh Acres — top-decile yield for the area; either an underpriced asset or a hidden risk that comps aren't pricing in. Stress-test before assuming the spread holds.
Location & tenants
- Location reads 59/100 on livability (#826 in FL) — a working-class tenant base; expect higher turnover. Strengths: cost of living A+, housing A+; Watch: crime C-, employment D+, schools D-.
- Lee (suburban): math 47% / reading 50% proficiency, ranked #42 of 73 in FL (top 58%) — families likely to look elsewhere, expect single-tenant / working-renter base with shorter leases.
- Market conditions: Rents falling (-4.7%/yr); 2460 active listings in the ZIP; 27 comparable units currently listed for rent nearby; rentals at typical pace (median 16d on market — plan ~3-4 weeks tenant-placement turnaround); 15,411 units permitted in Lee County in 2024 (4,686 in 5+ unit buildings).
- This rent runs 33% of the median local income ($72k/yr) — at the standard rent-burdened threshold; future hikes will face affordability resistance.
Forward outlook
- In year one you build about $25k of equity ($2k loan paydown + $24k appreciation (10.0% local appreciation)).
- Lee County population projected at +44% by 2050 — long-run rental-demand tailwind backs the buy-and-hold thesis.
- At projected returns (10.0% appreciation + 0.0% rent growth), your $66k cash investment doubles in ~3 years — after that, you're playing with house money.
- By year 2, paydown + projected appreciation supports a ~$40k cash-out refi (75% LTV) — recoverable capital for the next deal without selling this one.
Negotiation context
- It's been on market 50 days — a 3% lower offer ($228k) is reasonable based on typical stale-listing flexibility.
- Current owner paid $40k; list at $235k implies a 480% gain — meaningful room to come down on a strong offer.
Risks & watch-outs
- Climate carrying-cost: severe wind risk, 99% chance of damaging wind over 30y; extreme-heat days projected 7→27/yr by 2055 (HVAC capex compounding) — expect insurance premiums to compound above CPI over the hold.
Questions for the listing agent
- It's been on market 50 days. Have you received any prior offers? Is the seller open to a 15% concession, seller financing, or rate buy-down credit?
- Is there a deadline driving the sale (1031 exchange, divorce, estate, relocation)? That informs how much negotiation room exists.
- Schools are D-rated, which usually means shorter tenancies and higher turnover. Who's the typical renter profile here, and what's been the actual vacancy rate?
- What's the average days-on-market for RENTAL listings here right now (not sales)? A rising rental-DOM trend means longer vacancies and softer asking-rent achievability than the comps imply.
- What's the recent tenant-quality profile in this submarket — average credit score on applications, eviction rate, late-payment / NSF rate, and stable-employment percentage? A property-management company in the area should have these aggregated.
- How much new for-sale + rental construction is in the pipeline within 1–3 miles? Heavy new supply typically softens prices + rents 12–24 months out; constrained supply supports both.
Investment metrics
- 1% rule
- 0.85% ✗
- Cap rate
- 6.58%
- Cash-on-cash
- 1.01%
- DSCR
- 1.04
- GRM
- 9.7
CMA / ARV
- ARV (on-the-fly)
- $320,544
- Comps found
- 4
Show comp detail 4 sales within ~0.75 mi
| Address | Dist | Beds/Ba | Sqft | Sold | Price | $/sf | Match |
|---|---|---|---|---|---|---|---|
| 1125 Dutchess St E | 0.51mi | 3/2.0 | 1,270 (-0%) | 5mo | $289,999 | $228 | 72 |
| 1129 Deauville St E | 0.56mi | 3/2.0 | 1,292 (+2%) | 8mo | $335,000 | $259 | 64 |
| 1123 Deauville St E | 0.58mi | 3/2.0 | 1,292 (+2%) | 10mo | $325,000 | $252 | 62 |
| 911 Medford Ave S | 0.69mi | 3/2.0 | 1,130 (-11%) | 12mo | $255,000 | $226 | 39 |
Match score weights: distance 35% · size 25% · config 20% · recency 20%. Top-matched comps best support the ARV.
Projected returns pro-forma
10.0% appreciation · 0.0% rent growth · sell at horizon
- IRR
- 24.0%
- Equity multiple
- 2.91×
- Total profit
- $125,602
- Equity at exit
- $211,707
- IRR
- 20.7%
- Equity multiple
- 6.42×
- Total profit
- $356,509
- Equity at exit
- $456,553
Cash invested: $65,800 (down + closing). Projections, not guarantees.
Landlord ↔ Tenant lean methodology
- Overall (STATE)
- 87 Strongly Landlord-Friendly
- State Florida
- 87 Strongly Landlord-Friendly · R+3
- County
- — inherits STATE
- City
- — inherits STATE
ZIP-level market 33974
- Home prices YoY
- 5.8%
- Rents YoY
- -4.7%
- Active inventory
- 2460
- Price-to-rent
- 9.7×
Monthly cashflow live
- Estimated rent
- $2,009 high interval (Pro) →
- Mortgage (P&I)
- −$1,232
- Tax from tax record
- −$201 /mo · $2,416/yr
- Insurance
- −$98
- HOA
- −$0
- Vacancy / Maint / Mgmt
- −$422
- Net cashflow
- $55
Break-even live
UW: 25.0% down · 7.5% · 30yr · 1.5% tax · 5.0% vac · 8.0% maint · 8.0% mgmt
Financing live
Cash to close
- Down payment
- $58,750
- Closing costs
- $7,050
- Reserves months
- —
- Total cash needed
- —
Loan-product check · same deal, 3 products live
Conventional
25% down · 7.5% · 30yr
- Down + closing
- —
- Monthly P&I
- —
- Monthly cashflow
- —
- DSCR
- —
- Eligible?
- —
Personal DTI + credit; lowest rate.
DSCR
20% down · 8.5% · 30yr
- Down + closing
- —
- Monthly P&I
- —
- Monthly cashflow
- —
- DSCR
- —
- Eligible?
- —
No personal income docs; deal must DSCR.
Hard money
10% down · 12.0% · 12mo
- Down + closing
- —
- Monthly P&I
- —
- Monthly cashflow
- —
- DSCR
- —
- Eligible?
- —
Short-term bridge; refi at stabilization.
Rent comps 27 comps
| Address | Beds | Baths | Sqft | Rent | $/sqft | DOM | Units | Dist |
|---|---|---|---|---|---|---|---|---|
| 1051 Marine Ave S Lehigh Acres, FL | 3.0 | 2.0 | 1057 | $1,800 | $1.70 | 23d | 1 | 0.33mi |
| 1150 Darling St E Lehigh Acres, FL | 3.0 | 2.0 | 1292 | $1,800 | $1.39 | 23d | 1 | 0.42mi |
| 1107 Enrique St E Lehigh Acres, FL | 3.0 | 2.0 | 1363 | $1,800 | $1.32 | 23d | 1 | 0.45mi |
| 934 Marilyn Ave S Lehigh Acres, FL | 4.0 | 2.0 | 1577 | $2,000 | $1.27 | 11d | 1 | 0.46mi |
| 934 Marilyn Ave S Lehigh Acres, FL | 4.0 | 2.0 | 1577 | $2,000 | $1.27 | 1d | 1 | 0.46mi |
| 1142 Dutchess St E Lehigh Acres, FL | 4.0 | 2.5 | 1632 | $2,400 | $1.47 | 23d | 1 | 0.49mi |
| 1129 Deauville St E Lehigh Acres, FL | 3.0 | 2.0 | 1698 | $2,100 | $1.24 | 23d | 1 | 0.58mi |
| 1125 Deauville St E Lehigh Acres, FL | 3.0 | 2.0 | 1292 | $1,900 | $1.47 | 2d | 1 | 0.59mi |
| 1121 Deauville St E Lehigh Acres, FL | 3.0 | 2.0 | 1698 | $2,100 | $1.24 | 23d | 1 | 0.61mi |
| 1028 Eubanks St Lehigh Acres, FL | 3.0 | 3.0 | 1200 | $1,950 | $1.62 | 15d | 1 | 0.73mi |
| 847 Genoa Ave Lehigh Acres, FL | 3.0 | 2.0 | 1600 | $2,000 | $1.25 | 3d | 1 | 0.84mi |
| 1089 Eisenhower Blvd Lehigh Acres, FL | 4.0 | 2.0 | 1639 | $2,000 | $1.22 | 3d | 1 | 0.91mi |
| 828 Genoa Ave S Lehigh Acres, FL | 4.0 | 2.5 | 1632 | $2,400 | $1.47 | 23d | 1 | 0.99mi |
| 1248 Columbus Blvd Unit B Fort Myers, FL | 3.0 | 2.0 | 1100 | $1,850 | $1.68 | 23d | 1 | 1.03mi |
| 1129 Graystone Ave Lehigh Acres, FL | 3.0 | 2.0 | 1025 | $1,600 | $1.56 | 23d | 1 | 1.06mi |
| 1253 Columbus Blvd Fort Myers, FL | 3.0 | 2.0 | 1288 | $1,650 | $1.28 | 23d | 1 | 1.09mi |
| 936 Eisenhower Blvd Lehigh Acres, FL | 3.0 | 2.0 | 1300 | $1,395 | $1.07 | 3d | 1 | 1.10mi |
| 1135 Harvest Ave Unit A Lehigh Acres, FL | 2.0 | 2.0 | 1150 | $1,450 | $1.26 | 14d | 1 | 1.17mi |
| 1262 Best Ave Fort Myers, FL | 3.0 | 2.0 | 1288 | $1,600 | $1.24 | 14d | 1 | 1.17mi |
| 915 Graystone Ave Lehigh Acres, FL | 3.0 | 2.0 | 1115 | $1,525 | $1.37 | 14d | 1 | 1.18mi |
| 765 Aprile Ave S Lehigh Acres, FL | 4.0 | 2.0 | 1712 | $2,100 | $1.23 | 1d | 1 | 1.18mi |
| 763 Puccini Ave S Lehigh Acres, FL | 3.0 | 2.0 | 1055 | $1,699 | $1.61 | 2d | 1 | 1.24mi |
| 941 Elgin St Lehigh Acres, FL | 3.0 | 2.0 | 1582 | $2,664 | $1.68 | 23d | 1 | 1.24mi |
| 1270 Bermar St Fort Myers, FL | 3.0 | 2.0 | 1408 | $1,660 | $1.18 | 3d | 1 | 1.31mi |
| 827 Eisenhower Blvd Lehigh Acres, FL | 3.0 | 2.5 | 1640 | $1,780 | $1.09 | 11d | 1 | 1.37mi |
| 819 Eisenhower Blvd Unit 819 Lehigh Acres, FL | 3.0 | 2.0 | 1390 | $1,650 | $1.19 | 23d | 1 | 1.40mi |
| 1018 Garnet Ave Lehigh Acres, FL | 3.0 | 2.0 | 1381 | $1,575 | $1.14 | 23d | 1 | 1.42mi |
Listing history 15 events
-
2026-06-17days on market $235,000 Active 50 DOM
-
2026-06-16days on market $235,000 Active 49 DOM
-
2026-06-15pricedays on market $235,000 Active 48 DOM
-
2026-06-13days on market $260,000 Active 46 DOM
-
2026-06-10days on market $260,000 Active 43 DOM
-
2026-06-09days on market $260,000 Active 42 DOM
-
2026-06-08days on market $260,000 Active 41 DOM
-
2026-06-07days on market $260,000 Active 40 DOM
-
2026-06-03days on market $260,000 Active 36 DOM
-
2026-06-02days on market $260,000 Active 35 DOM
-
2026-06-01days on market $260,000 Active 34 DOM
-
2026-05-31days on market $260,000 Active 33 DOM
-
2026-04-28$260,000 Active
-
2015-03-02price $33,000 387-char remark
Show marketing remark (387 chars)
This home is a 3 bedroom, 2 bath, 2 car garage on a . 25 acre lot. Offers a great room, eat in kitchen, pantry, a small area with a computer desk and a lanai. Home is being sold As Is With Right To Inspect. A prequalification from a branch office of Bank of America Home Loans required for all financed offers. Finance with Bank of America and receive a free credit report and appraisal.
-
2011-04-14soldstatus $40,500 387-char remark
Show marketing remark (387 chars)
This home is a 3 bedroom, 2 bath, 2 car garage on a . 25 acre lot. Offers a great room, eat in kitchen, pantry, a small area with a computer desk and a lanai. Home is being sold As Is With Right To Inspect. A prequalification from a branch office of Bank of America Home Loans required for all financed offers. Finance with Bank of America and receive a free credit report and appraisal.
ⓘ Source: listings_history table (triggers on properties + properties_extension) + one-shot
backfill from property_details.listing_events for pre-trigger history.
Tax reassessment forecast FL · Resets to sale price
- Current annual tax
- $2,416 · $201/mo
- Projected year-2 tax
- $2,416 · $201/mo
- Expected delta
- $0/yr ($0/mo · 0.0%)
ⓘ Screening estimate from a state-policy table — verify with the county assessor before closing.
Climate risk First Street
- Flood 1/10 Low FEMA zone X (unshaded) · 0% chance over 30 yrs
- Wildfire 2/10 Low
- Heat 9/10 Extreme 7 d/yr ≥109°F today · 27 d/yr by 30 yrs out
- Wind 10/10 Extreme 99% chance of damaging wind over 30 yrs
- Air quality 2/10 Low 1 unhealthy d/yr today · 2 by 30 yrs out
Nearby sold comps map
Loading sold comps map…
Walkable amenities ~0.75 mi
Loading nearby amenities…
Taxation est. · year 1
- Rental income
- $24,106
- − Mortgage interest
- −$13,164
- − Property taxes
- −$2,416
- − Insurance
- −$1,175
- − Repairs & maintenance
- −$1,928
- − Management
- −$1,928
- − Depreciation
- −$6,836
- Taxable loss
- −$3,341
- Est. tax savings @ 24.0%
- +$802
- After-tax cash flow
- $1,467/yr
For passive investors: Depreciation is non-cash, so a rental often shows a tax loss while cash-flowing — sheltering income. Rental losses are passive: they offset passive income freely, and up to $25,000/yr can offset ordinary (W-2) income if you actively participate and your MAGI is under $100k (phasing out to $0 by $150k); unused losses carry forward. On sale, claimed depreciation is recaptured at up to 25%, and gains may owe capital-gains tax (a 1031 exchange can defer both). Figures are a year-1 estimate at your 24.0% rate — not tax advice; consult a CPA.
Schools (NCES district)
- District
- Lee
- NCES district ID
- 1201080
- Math proficiency
- 47% ▼ -11.00%
- Reading proficiency
- 50% ▼ -4.00%
- Median HH income
- $49,518
- Composite
- 41.49/100
- National rank
- #3458
- State rank
- #42 of 73 in FL
Livability — Lehigh Acres
- Score
- 59/100
- State rank
- #826
- US rank
- #20055
Category grades
Schools grade is shown separately in the Schools card above.
Census & demographics
- Census place
- Lehigh Acres, FL
- County
- Lee County · 788,662 people
- City population
- 130,638
- Metro
- Cape Coral-Fort Myers, FL
- Population (ZIP)
- 19,927
- Household income
- $72,192
- Rent vs Own
- Severe rent burden
- 434.0
Population outlook (Lee County) Hauer SSP2
- Today (2025)
- 871,946 people
- By 2030
- 955,468 · +9.6%
- By 2040
- 1,113,587 · +27.7%
- By 2050
- 1,256,891 · +44.1%
- By 2075
- 1,560,270 · +78.9%
- By 2100
- 1,726,848 · +98.0%
Race, ethnicity, and origin ACS 2023
- Neighborhood character
- Diverse neighborhood (Simpson 0.64)
- Race & ethnicity
- Hispanic / Latino 52% Two or more races 31% White 26% Black 18%
- Hispanic origin (detail)
- Mexican 12% Puerto Rican 7% Cuban 20% Dominican 4%
- Common ancestry
- Hispanic 7% Italian 1% Portuguese 1%
- Foreign-born
- 32% · Canada, Jamaica
- Languages at home
- 48% English-only · Spanish 43% French/Haitian/Cajun 7% Other Indo-European 1%
Political lean MEDSL · Lee
- 2024 margin
- Strong R (+28.4) · D 35.5% · R 63.9%
- 2008→2024 swing
- -18.0pp toward R · 2008: -10.4pp · 2024: -28.4pp
- All cycles
- 2024: R+28.4 2020: R+19.2 2016: R+20.4 2012: R+16.6 2008: R+10.4
Not yet ingested
- Civics
- —
Market trends
- HPI YoY
- ▲ 16.53%
- Current HPI
- 303.3399
- Rent YoY
- ▼ -4.68%
- Metro
- Cape Coral-Fort Myers, FL
- State GDP YoY
- ▲ 3.28%
- F500 in state
- 36
Industry mix (Fortune 500 HQ in FL)
| Industry | F500 HQs | Revenue |
|---|---|---|
| Industrial Technology | 2 | $29B |
|
||
| Insurance | 2 | $17B |
|
||
| Retail | 1 | $60B |
|
||
| Technology Distribution | 1 | $58B |
|
||
| Homebuilding | 1 | $35B |
|
||
| Technology Manufacturing | 1 | $35B |
|
||
Price history
+542.0% since first listed3 events — show timeline
- 2026-04-28 Listed $260,000 Stellar MLS as Distributed by MLS Grid
- 2015-03-02 Price Changed $33,000 FORTMLS
- 2011-04-14 Sold (MLS) $40,500 FORTMLS
Property tax history
+8.8%/yrLatest (2022): $2,416 · +18.2% YoY. Source: county tax records.
Cash-flow waterfall
monthlySold comps — $/sqft
last 12 mo · ≤1 miLoading sold comps…