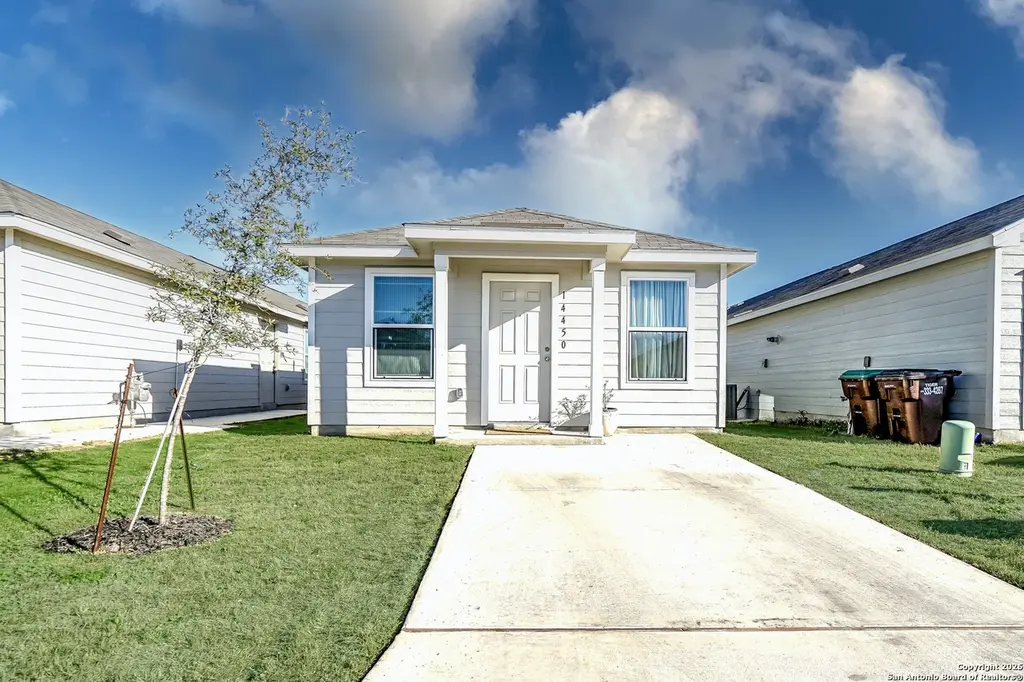
14450 Source · San Antonio, TX
Flood risk 1/10 · Minimal
- FEMA flood zone
- X (unshaded)
- Chance of flooding over 30 yrs
- 0.0%
- Est. flood insurance / yr
- $507 – $1,088
Fire risk 5/10 · Moderate
- Est. fire insurance / yr
- $1,222 – $2,270
Heat risk 8/10 · Major
- Hot days now (above 109°F)
- 7 days/yr
- Hot days in 30 yrs
- 23 days/yr
Wind risk 8/10 · Major
- Chance of severe wind over 30 yrs
- 80.0%
Air-quality risk 1/10 · Minimal
- Unhealthy air days now
- 0 days/yr
- Unhealthy air days in 30 yrs
- 0 days/yr
Risk factors via First Street. Map © Google.
Why this score? — see what drove the D- grade
The composite is a weighted blend of 9 inputs, each scored 0–100. Each bar is that input's sub-score; the figure is the points it added to the 100-point composite (weight × sub-score).
- ARV discount +15.0/15.0
- Cash flow +7.7/30.0
- Livability +4.0/5.0
- Condition / age +4.0/5.0
- 1% rule +3.2/10.0
- Schools +1.9/10.0
- DSCR +1.8/10.0
- Rent growth +1.7/5.0
- Appreciation +0.0/10.0
$149,500
🖨 Deal sheet (PDF) 📄 Offer letter ✓ Due diligence
Listing remarks MLS
Charming bungalow style, single-story home* Nice Open-concept, Living room flows into kitchenette and breakfast nook area* Styled by an interior designer, upgraded bedrooms with gorgeous luxury flooring, no carpet* Primary suite located rear of the home for privacy with private primary bathroom and roomy walk-in closet* Second bedroom conveniently next to 2nd full Bath* Step to your spacious big backyard with private greenbelt; perfect for relaxing & entertaining* Desirable community amenities, amazing Pool, great playground & walking trails* Close to Calaveras Lake and outdoor* 2-min to I-37; near Loop-410, Loop-1604, and City Base Shopping Center*
Key facts
- Open-concept
- Big backyard
- Upgraded bedrooms
Tags
Neighborhood map
What this means for you Summary
Snapshot
- This is a 2-bed/2.0-bath single-family listed at $150k. Condition is rated good.
Deal economics
- At list price, monthly cash flow is $-175 ($-2k/yr) — negative.
- To cash-flow at today's rent, offer at most $119k (20.7% below list).
- To meet the 1% rule (rent ≥ 1% of price), the offer needs to be $122k (18.5% below list).
- Recommended offer: $119k (20.7% below list) — sets the bar for cash-flow.
- Cap rate 4.9% vs local median 3.8% in San Antonio — meaningfully above typical; check what's discounted (condition, days-on-market, listing class) to confirm the premium yield is real.
Location & tenants
- Location reads 80/100 on livability (#31 in TX, #1,616 nationally) — a professional / high-income tenant draw. Strengths: amenities A+, commute A+, cost of living A+; Watch: schools C-, crime F.
- East Central ISD (rural): math 16% / reading 25% proficiency, ranked #758 of 826 in TX (top 92%) — low school quality limits family demand, transient renter base, plan for 1-2y turnover; 61% free/reduced lunch — lower-income household profile, screen leases tightly.
- Market conditions: Rents falling (-3.4%/yr); 329 active listings in the ZIP; 2 comparable units currently listed for rent nearby; 8,308 units permitted in Bexar County in 2024 (2,506 in 5+ unit buildings).
Forward outlook
- Local home prices are declining (-3.0%/yr); year-one equity from $1k of loan paydown is wiped out by about $4k of value loss. Plan a longer hold.
- Bexar County population projected at +50% by 2050 — long-run rental-demand tailwind backs the buy-and-hold thesis.
Negotiation context
- It's been on market 143 days — a 12% lower offer ($132k) is reasonable based on typical stale-listing flexibility.
- 4 sale attempts since 3y ago; this cycle's ask has dropped $15k (9%) from the opening price — seller is motivated, your offer sets the floor, not the list.
Risks & watch-outs
- Climate carrying-cost: severe wind risk, 80% chance of damaging wind over 30y; moderate wildfire risk; extreme-heat days projected 7→23/yr by 2055 (HVAC capex compounding) — expect insurance premiums to compound above CPI over the hold.
Questions for the listing agent
- What do current leases actually rent for vs. the listed asking? Can we see a recent rent roll and the last 12 months of T-12 income?
- It's been on market 143 days. Have you received any prior offers? Is the seller open to a 21% concession, seller financing, or rate buy-down credit?
- What does the HOA fee cover, when was the last increase, and are there any pending special assessments or reserve-fund shortfalls?
- Why hasn't it sold? Are there any deal-killer items the seller is aware of (foundation, flood, title, zoning, code violations)?
- Is there a deadline driving the sale (1031 exchange, divorce, estate, relocation)? That informs how much negotiation room exists.
- Crime grade is F in this area — have there been break-ins, vandalism, or insurance claims at this property in the last 3 years? What carrier currently insures it and at what premium?
- The area grade is low — what's the realistic commute time and amenity access for the typical tenant pool here? Any planned neighborhood developments (good or bad) we should know about?
- What's the average days-on-market for RENTAL listings here right now (not sales)? A rising rental-DOM trend means longer vacancies and softer asking-rent achievability than the comps imply.
- What's the recent tenant-quality profile in this submarket — average credit score on applications, eviction rate, late-payment / NSF rate, and stable-employment percentage? A property-management company in the area should have these aggregated.
- How much new for-sale + rental construction is in the pipeline within 1–3 miles? Heavy new supply typically softens prices + rents 12–24 months out; constrained supply supports both.
Investment metrics
- 1% rule
- 0.82% ✗
- Cap rate
- 4.89%
- Cash-on-cash
- -5.02%
- DSCR
- 0.78
- GRM
- 10.2
CMA / ARV
- ARV (median comp)
- $180,039
- List price
- $149,500
- Delta
- -16.96%
- Verdict
- UNDERPRICED
- Comps
- 12 within 1.0 mi
Projected returns pro-forma
-3.0% appreciation · 0.0% rent growth · sell at horizon
- IRR
- -28.6%
- Equity multiple
- 0.07×
- Total profit
- $-38,878
- Equity at exit
- $22,291
- IRR
- -48.3%
- Equity multiple
- -0.47×
- Total profit
- $-61,696
- Equity at exit
- $12,926
Cash invested: $41,860 (down + closing). Projections, not guarantees.
Landlord ↔ Tenant lean methodology
- Overall (STATE)
- 87 Strongly Landlord-Friendly
- State Texas
- 87 Strongly Landlord-Friendly · R+5
- County
- — inherits STATE
- City
- — inherits STATE
ZIP-level market 78223
- Home prices YoY
- -16.4%
- Rents YoY
- -3.4%
- Active inventory
- 329
- Price-to-rent
- 10.2×
Monthly cashflow live
- Estimated rent
- $1,219 medium interval (Pro) →
- Mortgage (P&I)
- −$784
- Tax from tax record
- −$264 /mo · $3,167/yr
- Insurance
- −$62
- HOA
- −$28
- Vacancy / Maint / Mgmt
- −$256
- Net cashflow
- $-175
Break-even live
Sensitivity live
| Price | -10% $-91 | -5% $-133 | +0% $-175 | +5% $-218 | +10% $-260 |
|---|---|---|---|---|---|
| Rent | -10% $-272 | -5% $-223 | +0% $-175 | +5% $-127 | +10% $-79 |
| Rate | -1.0pp $-100 | -0.5pp $-137 | base $-175 | +0.5pp $-214 | +1.0pp $-253 |
UW: 25.0% down · 7.5% · 30yr · 1.5% tax · 5.0% vac · 8.0% maint · 8.0% mgmt
Financing live
Cash to close
- Down payment
- $37,375
- Closing costs
- $4,485
- Reserves months
- —
- Total cash needed
- —
Loan-product check · same deal, 3 products live
Conventional
25% down · 7.5% · 30yr
- Down + closing
- —
- Monthly P&I
- —
- Monthly cashflow
- —
- DSCR
- —
- Eligible?
- —
Personal DTI + credit; lowest rate.
DSCR
20% down · 8.5% · 30yr
- Down + closing
- —
- Monthly P&I
- —
- Monthly cashflow
- —
- DSCR
- —
- Eligible?
- —
No personal income docs; deal must DSCR.
Hard money
10% down · 12.0% · 12mo
- Down + closing
- —
- Monthly P&I
- —
- Monthly cashflow
- —
- DSCR
- —
- Eligible?
- —
Short-term bridge; refi at stabilization.
Rent comps 2 comps
| Address | Beds | Baths | Sqft | Rent | $/sqft | DOM | Units | Dist |
|---|---|---|---|---|---|---|---|---|
| 4247 Thalweg Way San Antonio, TX | 1.0 | 1.0 | 520 | $1,100 | $2.12 | 44d | 1 | 0.13mi |
| 14050 Southton Rd Elmendorf, TX | 1.0–2.0 | 1.0–2.0 | 839 | $1,550 | $1.85 | 2d | 18 | 0.96mi |
HOA detail
- Monthly dues
- $28 · $336/yr
- Likely covers
- pool
Listing history 17 events
-
2026-06-08days on market $149,500 Active 143 DOM
-
2026-06-07days on market $149,500 Active 142 DOM
-
2026-06-04days on market $149,500 Active 139 DOM
-
2026-06-03days on market $149,500 Active 138 DOM
-
2026-06-02days on market $149,500 Active 137 DOM
-
2026-06-01days on market $149,500 Active 136 DOM
-
2026-05-31days on market $149,500 Active 135 DOM
-
2026-05-01price $149,500 665-char remark
Show marketing remark (665 chars)
Charming bungalow style, single-story home* Nice Open-concept, Living room flows into kitchenette and breakfast nook area* Styled by an interior designer, upgraded bedrooms with gorgeous luxury flooring, no carpet* Primary suite located rear of the home for privacy with private primary bathroom and roomy walk-in closet* Second bedroom conveniently next to 2nd full Bath* Step to your spacious big backyard with private greenbelt; perfect for relaxing & entertaining* Desirable community amenities, amazing Pool, great playground & walking trails* Close to Calaveras Lake and outdoor* 2-min to I-37; near Loop-410, Loop-1604, and City Base Shopping Center*
-
2026-04-14price $154,500 665-char remark
Show marketing remark (665 chars)
Charming bungalow style, single-story home* Nice Open-concept, Living room flows into kitchenette and breakfast nook area* Styled by an interior designer, upgraded bedrooms with gorgeous luxury flooring, no carpet* Primary suite located rear of the home for privacy with private primary bathroom and roomy walk-in closet* Second bedroom conveniently next to 2nd full Bath* Step to your spacious big backyard with private greenbelt; perfect for relaxing & entertaining* Desirable community amenities, amazing Pool, great playground & walking trails* Close to Calaveras Lake and outdoor* 2-min to I-37; near Loop-410, Loop-1604, and City Base Shopping Center*
-
2026-01-16$164,500 New 665-char remark
Show marketing remark (665 chars)
Charming bungalow style, single-story home* Nice Open-concept, Living room flows into kitchenette and breakfast nook area* Styled by an interior designer, upgraded bedrooms with gorgeous luxury flooring, no carpet* Primary suite located rear of the home for privacy with private primary bathroom and roomy walk-in closet* Second bedroom conveniently next to 2nd full Bath* Step to your spacious big backyard with private greenbelt; perfect for relaxing & entertaining* Desirable community amenities, amazing Pool, great playground & walking trails* Close to Calaveras Lake and outdoor* 2-min to I-37; near Loop-410, Loop-1604, and City Base Shopping Center*
-
2025-11-03historical
-
2025-09-09status Back on Market
-
2025-08-31historical
-
2025-02-28$169,900 New
-
2023-10-25soldstatus Sold
-
2023-10-02status Pending
-
2023-09-24$169,999 New
ⓘ Source: listings_history table (triggers on properties + properties_extension) + one-shot
backfill from property_details.listing_events for pre-trigger history.
Tax reassessment forecast TX · Resets to sale price
- Current annual tax
- $3,167 · $264/mo
- Projected year-2 tax
- $3,167 · $264/mo
- Expected delta
- $0/yr ($0/mo · 0.0%)
ⓘ Screening estimate from a state-policy table — verify with the county assessor before closing.
Climate risk First Street
- Flood 1/10 Low FEMA zone X (unshaded) · 0% chance over 30 yrs
- Wildfire 5/10 Major
- Heat 8/10 Severe 7 d/yr ≥109°F today · 23 d/yr by 30 yrs out
- Wind 8/10 Severe 80% chance of damaging wind over 30 yrs
- Air quality 1/10 Low 0 unhealthy d/yr today · 0 by 30 yrs out
Nearby sold comps map
Loading sold comps map…
Walkable amenities ~0.75 mi
Loading nearby amenities…
Taxation est. · year 1
- Rental income
- $14,627
- − Mortgage interest
- −$8,374
- − Property taxes
- −$3,167
- − Insurance
- −$748
- − Repairs & maintenance
- −$1,170
- − Management
- −$1,170
- − HOA
- −$336
- − Depreciation
- −$4,349
- Taxable loss
- −$4,687
- Est. tax savings @ 24.0%
- +$1,125
- After-tax cash flow
- $-978/yr
For passive investors: Depreciation is non-cash, so a rental often shows a tax loss while cash-flowing — sheltering income. Rental losses are passive: they offset passive income freely, and up to $25,000/yr can offset ordinary (W-2) income if you actively participate and your MAGI is under $100k (phasing out to $0 by $150k); unused losses carry forward. On sale, claimed depreciation is recaptured at up to 25%, and gains may owe capital-gains tax (a 1031 exchange can defer both). Figures are a year-1 estimate at your 24.0% rate — not tax advice; consult a CPA.
Condition & rehab AI · 12 photos
This charming bungalow is in good condition with modern updates and a well-maintained exterior. It's ready for a new owner or tenant.
Value-add opportunities
- Resale Paint exterior trim — Enhances curb appeal
- Rental Clean gutters — Keeps home in good condition
Renovation cost estimate screening
Value-add ROI direction
- Resale Paint exterior trim — Enhances curb appeal ↑
- Rental Clean gutters — Keeps home in good condition ↑
ⓘ Cost ranges are severity-bucket heuristics (US national rule-of-thumb). Get contractor quotes + a written scope before underwriting a rehab budget.
Schools (NCES district)
- District
- East Central ISD
- NCES district ID
- 4817850
- Math proficiency
- 16% ▼ -12.00%
- Reading proficiency
- 25% ▼ -6.00%
- Median HH income
- $53,941
- Composite
- 18.67/100
- National rank
- #8887
- State rank
- #758 of 826 in TX
Livability — San Antonio
- Score
- 80/100
- State rank
- #31
- US rank
- #1616
Category grades
Schools grade is shown separately in the Schools card above.
Census & demographics
- County
- Bexar County · 1,990,555 people
- City population
- 1,806,925
- Metro
- San Antonio-New Braunfels, TX
- Population (ZIP)
- 58,983
- Household income
- $52,088
- Rent vs Own
- Severe rent burden
- 2809.0
Population outlook (Bexar County) Hauer SSP2
- Today (2025)
- 2,336,851 people
- By 2030
- 2,560,728 · +9.6%
- By 2040
- 3,020,569 · +29.3%
- By 2050
- 3,493,522 · +49.5%
- By 2075
- 4,668,459 · +99.8%
- By 2100
- 5,533,242 · +136.8%
Race, ethnicity, and origin ACS 2023
- Neighborhood character
- Predominantly Hispanic (76%)
- Race & ethnicity
- Hispanic / Latino 76% Two or more races 28% White 16% Black 5% Asian 2% Native American 1%
- Hispanic origin (detail)
- Mexican 67%
- Common ancestry
- Lithuanian 2% Romanian 1% Slovak 1%
- Foreign-born
- 10% · Canada, Vietnam
- Languages at home
- 63% English-only · Spanish 36%
Political lean MEDSL · Bexar
- 2024 margin
- Lean D (+9.8) · D 54.3% · R 44.6% · Other 1.1%
- 2008→2024 swing
- +4.2pp toward D · 2008: 5.6pp · 2024: 9.8pp
- All cycles
- 2024: D+9.8 2020: D+18.2 2016: D+13.5 2012: D+4.6 2008: D+5.6
Not yet ingested
- Civics
- —
Market trends
- HPI YoY
- ▼ -52.06%
- Current HPI
- 265.2235
- Rent YoY
- ▼ -3.36%
- Metro
- San Antonio-New Braunfels, TX
- State GDP YoY
- ▲ 3.95%
- F500 in state
- 110
Industry mix (Fortune 500 HQ in TX)
| Industry | F500 HQs | Revenue |
|---|---|---|
| Energy | 16 | $1,198B |
|
||
| Technology | 5 | $198B |
|
||
| Engineering / Construction | 4 | $72B |
|
||
| Energy Services | 3 | $60B |
|
||
| Utilities | 3 | $41B |
|
||
| Healthcare | 2 | $330B |
|
||
Price history
-12.1% since first listed10 events — show timeline
- 2026-05-01 Price Changed $149,500 LERA
- 2026-04-14 Price Changed $154,500 LERA
- 2026-01-16 Listed $164,500 LERA
- 2025-11-03 Listing Removed — LERA
- 2025-09-09 Relisted — LERA
- 2025-08-31 Listing Removed — LERA
- 2025-02-28 Listed $169,900 LERA
- 2023-10-25 Sold (MLS) — LERA
- 2023-10-02 Pending — LERA
- 2023-09-24 Listed $169,999 LERA
Property tax history
+124.0%/yrLatest (2025): $3,167 · +6.6% YoY. Source: county tax records.
Cash-flow waterfall
monthlySold comps — $/sqft
last 12 mo · ≤1 miLoading sold comps…