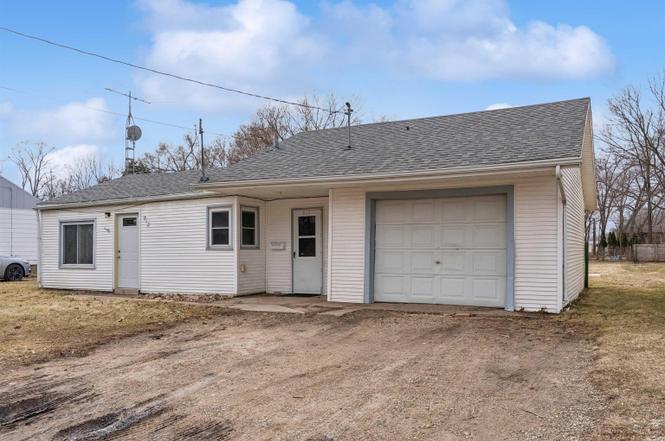
912 Jones Rd · Evansdale, IA
Flood risk 1/10 · Minimal
- FEMA flood zone
- X
- Chance of flooding over 30 yrs
- 0.0%
- Est. flood insurance / yr
- $507 – $1,088
Fire risk 1/10 · Minimal
- Est. fire insurance / yr
- $902 – $1,676
Heat risk 3/10 · Minor
- Hot days now (above 101°F)
- 7 days/yr
- Hot days in 30 yrs
- 15 days/yr
Wind risk 2/10 · Minimal
- Chance of severe wind over 30 yrs
- —
Air-quality risk 1/10 · Minimal
- Unhealthy air days now
- 0 days/yr
- Unhealthy air days in 30 yrs
- 0 days/yr
Risk factors via First Street. Map © Google.
Why this score? — see what drove the C grade
The composite is a weighted blend of 9 inputs, each scored 0–100. Each bar is that input's sub-score; the figure is the points it added to the 100-point composite (weight × sub-score).
- Cash flow +19.4/30.0
- ARV discount +15.0/15.0
- DSCR +6.1/10.0
- 1% rule +5.4/10.0
- Schools +4.4/10.0
- Livability +3.4/5.0
- Rent growth +2.5/5.0
- Condition / age +2.5/5.0
- Appreciation +0.0/10.0
$84,000
🖨 Deal sheet 📄 Offer letter ✓ Due diligence
Listing remarks
Affordable 2-3 bedroom ranch home. Everything all on main level. This home features eating area off kitchen or possibility for 3rd bedroom, updated vinyl windows, some updated wiring, newer carpet, main floor laundry connections and attached garage. Large rear yard and kitchen appliances remain with property.
Key facts
- Updated wiring
- Large rear yard
- 0.27 acre lot
Tags
Neighborhood map
What this means for you Summary
Snapshot
- This is a 2-bed/1.5-bath single-family listed at $84k.
Deal economics
- At list price, monthly cash flow is $94 ($1k/yr) — positive.
- The deal already cash-flows at list — no discount required.
- Meets the 1% rule at list price ($872 rent vs $84k).
- Recommended offer: $83k (1.5% below list) — sets the bar for market timing.
- Cap rate 7.6% vs local median 3.9% in Evansdale — top-decile yield for the area; either an underpriced asset or a hidden risk that comps aren't pricing in. Stress-test before assuming the spread holds.
Location & tenants
- Location reads 67/100 on livability (#487 in IA) — a middle-class / working-renter tenant base. Strengths: cost of living A+, housing A+, crime B+; Watch: employment D, amenities F, commute F.
- Waterloo Community School District (urban): math 50% / reading 54% proficiency, ranked #276 of 289 in IA (top 96%) — acceptable for families but not a draw, mixed tenant base, ~2y average lease.
- Zoned schools: Poyner Elementary (math 62% / reading 57%, grade B-, #390 of 616 statewide, top 69%, 362 students, 69% FRL); Bunger Middle School (math 48% / reading 47%, grade C-, #226 of 246 statewide, top 92%, 431 students, 75% FRL); East High School (math 39% / reading 58%, grade D, #317 of 336 statewide, top 94%, 1,022 students, 73% FRL).
- Market conditions: 64 active listings in the ZIP; 2 comparable units currently listed for rent nearby; 287 units permitted in Black Hawk County in 2024 (67 in 5+ unit buildings).
Forward outlook
- Local home prices are declining (-3.0%/yr); year-one equity from $581 of loan paydown is wiped out by about $3k of value loss. Plan a longer hold.
- Black Hawk County population projected at +10% by 2050 — modest demand growth; plan on rents tracking national, not racing it.
Negotiation context
- It's been on market 17 days — a 2% lower offer ($83k) is reasonable based on typical stale-listing flexibility.
Risks & watch-outs
- Watch-outs: built in 1949 — expect roof / HVAC / electrical / plumbing capex.
Questions for the listing agent
- Built in 1949 — when were the roof, HVAC, electrical panel, plumbing, and water heater last replaced?
- Is there a deadline driving the sale (1031 exchange, divorce, estate, relocation)? That informs how much negotiation room exists.
- What's the average days-on-market for RENTAL listings here right now (not sales)? A rising rental-DOM trend means longer vacancies and softer asking-rent achievability than the comps imply.
- What's the recent tenant-quality profile in this submarket — average credit score on applications, eviction rate, late-payment / NSF rate, and stable-employment percentage? A property-management company in the area should have these aggregated.
- How much new for-sale + rental construction is in the pipeline within 1–3 miles? Heavy new supply typically softens prices + rents 12–24 months out; constrained supply supports both.
Investment metrics
- 1% rule
- 1.04% ✓
- Cap rate
- 7.63%
- Cash-on-cash
- 4.79%
- DSCR
- 1.21
- GRM
- 8.0
CMA / ARV
- ARV (on-the-fly)
- $110,856
- Comps found
- 11
Show comp detail 11 sales within ~0.75 mi
| Address | Dist | Beds/Ba | Sqft | Sold | Price | $/sf | Match |
|---|---|---|---|---|---|---|---|
| 815 Fox Avenue Ave | 0.14mi | 2/1.0 | 807 (+8%) | 1mo | $161,000 | $200 | 76 |
| 103 Doyle Ave | 0.20mi | 1/1.0 (-1) | 708 (-5%) | 12mo | $81,500 | $115 | 65 |
| 620 Brookside Ave | 0.34mi | 2/1.0 | 728 (-2%) | 23mo | $121,000 | $166 | 59 |
| 1129 S Evans Rd | 0.48mi | 2/1.0 | 832 (+12%) | 1mo | $133,425 | $160 | 55 |
| 839 Home Acres | 0.32mi | 2/1.0 | 668 (-10%) | 16mo | $110,000 | $165 | 53 |
| 602 East End Ave | 0.64mi | 2/1.0 | 768 (+3%) | 13mo | $114,500 | $149 | 51 |
| 602 Home Acres Ave | 0.44mi | 2/1.0 | 704 (-5%) | 23mo | $65,000 | $92 | 49 |
| 611 East End Ave | 0.67mi | 2/1.0 | 660 (-11%) | 1mo | $68,000 | $103 | 47 |
| 317 Evans Rd | 0.69mi | 2/1.0 | 766 (+3%) | 19mo | $113,000 | $148 | 45 |
| 843 Evans Rd | 0.42mi | 2/1.0 | 672 (-10%) | 24mo | $78,000 | $116 | 42 |
| 813 Evans Rd | 0.43mi | 2/2.0 | 835 (+12%) | 23mo | $152,500 | $183 | 38 |
Match score weights: distance 35% · size 25% · config 20% · recency 20%. Top-matched comps best support the ARV.
Projected returns pro-forma
-3.0% appreciation · 3.0% rent growth · sell at horizon
- IRR
- -8.8%
- Equity multiple
- 0.68×
- Total profit
- $-7,612
- Equity at exit
- $12,525
- IRR
- 0.7%
- Equity multiple
- 1.05×
- Total profit
- $1,158
- Equity at exit
- $7,263
Cash invested: $23,520 (down + closing). Projections, not guarantees.
Landlord ↔ Tenant lean methodology
- Overall (STATE)
- 83 Strongly Landlord-Friendly
- State Iowa
- 83 Strongly Landlord-Friendly · R+6
- County
- — inherits STATE
- City
- — inherits STATE
ZIP-level market 50707
- Active inventory
- 64
- Price-to-rent
- 8.0×
Monthly cashflow live
- Estimated rent
- $872 medium interval (Pro) →
- Mortgage (P&I)
- −$441
- Tax from tax record
- −$120 /mo · $1,436/yr
- Insurance
- −$35
- HOA
- −$0
- Vacancy / Maint / Mgmt
- −$183
- Net cashflow
- $94
Break-even live
UW: 25.0% down · 7.5% · 30yr · 1.5% tax · 5.0% vac · 8.0% maint · 8.0% mgmt
Financing live
Cash to close
- Down payment
- $21,000
- Closing costs
- $2,520
- Reserves months
- —
- Total cash needed
- —
Loan-product check · same deal, 3 products live
Conventional
25% down · 7.5% · 30yr
- Down + closing
- —
- Monthly P&I
- —
- Monthly cashflow
- —
- DSCR
- —
- Eligible?
- —
Personal DTI + credit; lowest rate.
DSCR
20% down · 8.5% · 30yr
- Down + closing
- —
- Monthly P&I
- —
- Monthly cashflow
- —
- DSCR
- —
- Eligible?
- —
No personal income docs; deal must DSCR.
Hard money
10% down · 12.0% · 12mo
- Down + closing
- —
- Monthly P&I
- —
- Monthly cashflow
- —
- DSCR
- —
- Eligible?
- —
Short-term bridge; refi at stabilization.
Rent comps 2 comps
| Address | Beds | Baths | Sqft | Rent | $/sqft | DOM | Units | Dist |
|---|---|---|---|---|---|---|---|---|
| 850 Payne St Evansdale, IA | 2.0 | 1.0 | 640 | $900 | $1.41 | 44d | 1 | 0.48mi |
| 136 Earl St Evansdale, IA | 2.0 | 1.0 | 702 | $795 | $1.13 | 21d | 1 | 1.45mi |
Listing history 4 events
-
2026-05-08soldstatus $82,000
-
2026-03-23status Pending
-
2026-03-20price $84,000
-
2026-03-06$94,000 Active
ⓘ Source: listings_history table (triggers on properties + properties_extension) + one-shot
backfill from property_details.listing_events for pre-trigger history.
Tax reassessment forecast IA · Partial reset (capped growth)
- Current annual tax
- $1,436 · $120/mo
- Projected year-2 tax
- $1,436 · $120/mo
- Expected delta
- $0/yr ($0/mo · 0.0%)
ⓘ Screening estimate from a state-policy table — verify with the county assessor before closing.
Climate risk First Street
- Flood 1/10 Low FEMA zone X · 0% chance over 30 yrs
- Wildfire 1/10 Low
- Heat 3/10 Moderate 7 d/yr ≥101°F today · 15 d/yr by 30 yrs out
- Wind 2/10 Low
- Air quality 1/10 Low 0 unhealthy d/yr today · 0 by 30 yrs out
Nearby sold comps map
Loading sold comps map…
Walkable amenities ~0.75 mi
Loading nearby amenities…
Taxation est. · year 1
- Rental income
- $10,466
- − Mortgage interest
- −$4,705
- − Property taxes
- −$1,436
- − Insurance
- −$420
- − Repairs & maintenance
- −$837
- − Management
- −$837
- − Depreciation
- −$2,444
- Taxable loss
- −$213
- Est. tax savings @ 24.0%
- +$51
- After-tax cash flow
- $1,177/yr
For passive investors: Depreciation is non-cash, so a rental often shows a tax loss while cash-flowing — sheltering income. Rental losses are passive: they offset passive income freely, and up to $25,000/yr can offset ordinary (W-2) income if you actively participate and your MAGI is under $100k (phasing out to $0 by $150k); unused losses carry forward. On sale, claimed depreciation is recaptured at up to 25%, and gains may owe capital-gains tax (a 1031 exchange can defer both). Figures are a year-1 estimate at your 24.0% rate — not tax advice; consult a CPA.
Schools (NCES district)
- District
- Waterloo Community School District
- NCES district ID
- 1930480
- Math proficiency
- 50% ▼ -4.00%
- Reading proficiency
- 54% ▲ 1.00%
- Median HH income
- $42,545
- Composite
- 43.72/100
- National rank
- #2950
- State rank
- #276 of 289 in IA
Livability — Evansdale
- Score
- 67/100
- State rank
- #487
- US rank
- #10824
Category grades
Schools grade is shown separately in the Schools card above.
Census & demographics
- Census place
- Evansdale, IA
- City population
- 7,407
- Population (ZIP)
- 7,407
Population outlook (Black Hawk County) Hauer SSP2
- Today (2025)
- 139,716 people
- By 2030
- 142,853 · +2.2%
- By 2040
- 147,843 · +5.8%
- By 2050
- 153,247 · +9.7%
- By 2075
- 167,977 · +20.2%
- By 2100
- 177,320 · +26.9%
Race, ethnicity, and origin ACS 2023
- Neighborhood character
- Predominantly White (80%)
- Race & ethnicity
- White 80% Black 8% Hispanic / Latino 7% Two or more races 6%
- Hispanic origin (detail)
- Mexican 3%
- Common ancestry
- Portuguese 3% Iranian 2% Lithuanian 1%
- Foreign-born
- 1% · Canada
- Languages at home
- 95% English-only · Spanish 3%
Political lean MEDSL · Black Hawk
- 2024 margin
- Toss-up / Even · D 50.0% · R 48.8% · Other 1.2%
- 2008→2024 swing
- -21.3pp toward R · 2008: 22.4pp · 2024: 1.2pp
- All cycles
- 2024: D+1.2 2020: D+9.0 2016: D+7.3 2012: D+20.0 2008: D+22.4
Not yet ingested
- Civics
- —
Market trends
- HPI YoY
- ▼ -121.77%
- Current HPI
- 178.5926
- Rent YoY
- —
- Metro
- —
- State GDP YoY
- ▲ 2.48%
- F500 in state
- 4
Industry mix (Fortune 500 HQ in IA)
| Industry | F500 HQs | Revenue |
|---|---|---|
| Financial Services | 1 | $16B |
|
||
| Retail / Convenience | 1 | $15B |
|
||
Price history
-12.8% since first listed4 events — show timeline
- 2026-05-08 Sold (Public Records) $82,000 Public Records
- 2026-03-23 Pending — NEIRBR as distributed by MLS GRID
- 2026-03-20 Price Changed $84,000 NEIRBR as distributed by MLS GRID
- 2026-03-06 Listed $94,000 NEIRBR as distributed by MLS GRID
Property tax history
+2.5%/yrLatest (2025): $1,436 · +12.5% YoY. Source: county tax records.
Cash-flow waterfall
monthlySold comps — $/sqft
last 12 mo · ≤1 miLoading sold comps…