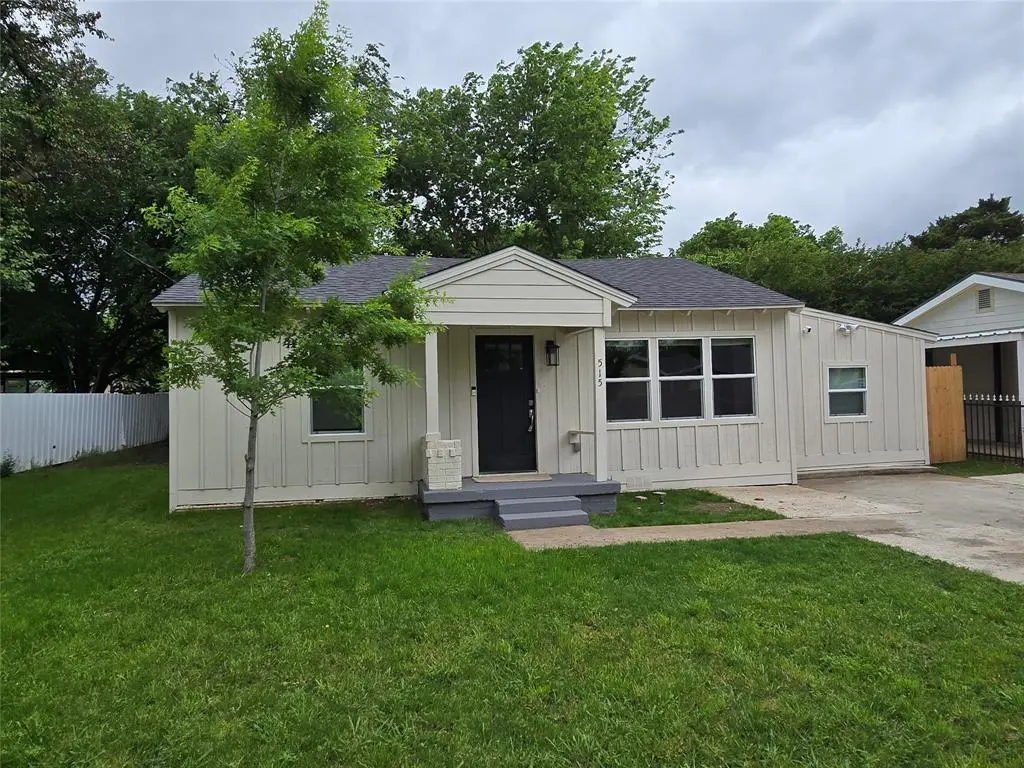
515 Elkhart Ave · Dallas, TX
Flood risk 1/10 · Minimal
- FEMA flood zone
- X (unshaded)
- Chance of flooding over 30 yrs
- 0.0%
- Est. flood insurance / yr
- $507 – $1,088
Fire risk 3/10 · Minor
- Est. fire insurance / yr
- $1,222 – $2,270
Heat risk 7/10 · Major
- Hot days now (above 110°F)
- 7 days/yr
- Hot days in 30 yrs
- 27 days/yr
Wind risk 6/10 · Moderate
- Chance of severe wind over 30 yrs
- 27.0%
Air-quality risk 2/10 · Minimal
- Unhealthy air days now
- 1 days/yr
- Unhealthy air days in 30 yrs
- 2 days/yr
Risk factors via First Street. Map © Google.
Why this score? — see what drove the D grade
The composite is a weighted blend of 9 inputs, each scored 0–100. Each bar is that input's sub-score; the figure is the points it added to the 100-point composite (weight × sub-score).
- Cash flow +12.4/30.0
- ARV discount +11.0/15.0
- Livability +4.0/5.0
- DSCR +3.7/10.0
- 1% rule +3.5/10.0
- Rent growth +2.8/5.0
- Schools +2.8/10.0
- Condition / age +2.5/5.0
- Appreciation +0.0/10.0
$217,700
🖨 Deal sheet (PDF) 📄 Offer letter ✓ Due diligence
Listing remarks
Great opportunity for a first-time homebuyer to have a fully renovated home. This nicely updated home features a totally new kitchen that has been fully redone with new cabinets and opens to the living area. It's freshly painted and has new flooring throughout. The major updates include a new roof and energy-efficient HVAC system with heat pump. The large backyard offers plenty of space, with a new wood fence and alley access on two sides. There’s also a partially shaded patio for outdoor use. Located half block from the nearby elementary school. (Garage conversion may not be included in county square footage. )
Key facts
- New kitchen
- Fully renovated home
- Large backyard
Tags
Property features AI
Finance
- Other: Property listed as for sale with standard listing conditions; Possession at closing/funding
- Financial info: Listing accepts Cash, FHA, owner-carry/second, and private financing
- HOA & community: No homeowners association
Exterior
- Parking: Concrete driveway
- Security: Audio and video surveillance devices present
- Utilities: City water; City sewer; Electricity connected; Natural gas available; Cable available
- Home design: Single-family residence; One story; Residential property
- Construction: Built in 1955; Wood construction; Composition roof
- Exterior features: Large backyard with grass; Patio; Chain link and wood fencing; Alley access
Interior
- Kitchen: Gas range; Microwave; Dishwasher; Garbage disposal; Gas water heater
- Bedrooms: Three bedrooms (all on the main level); Primary bedroom approx. 12 x 11; Second primary bedroom approx. 12 x 11; Third bedroom approx. 13 x 10
- Flooring: Carpet; Vinyl
- Bathrooms: One full bathroom
- Heating & cooling: Central heating (electric, heat pump); Central air conditioning (electric, heat pump)
- Interior features: Pantry; One living area; One dining area; Total of 6 rooms
- Laundry & utility: Individual water meter; Individual gas meter
Neighborhood map
What this means for you Summary
Snapshot
- This is a 3-bed/1.0-bath single-family listed at $218k.
Deal economics
- At list price, monthly cash flow is $-34 ($-413/yr) — negative.
- To cash-flow at today's rent, offer at most $212k (2.8% below list).
- To meet the 1% rule (rent ≥ 1% of price), the offer needs to be $185k (14.9% below list).
- Recommended offer: $185k (14.9% below list) — sets the bar for 1% rule.
- Cap rate 6.1% vs local median 2.3% in Dallas — top-decile yield for the area; either an underpriced asset or a hidden risk that comps aren't pricing in. Stress-test before assuming the spread holds.
Location & tenants
- Location reads 81/100 on livability (#24 in TX, #1,380 nationally) — a professional / high-income tenant draw. Strengths: amenities A+, commute A+, housing A+; Watch: crime F.
- Dallas ISD (urban): math 31% / reading 36% proficiency, ranked #559 of 826 in TX (top 68%) — families likely to look elsewhere, expect single-tenant / working-renter base with shorter leases; 83% free/reduced lunch — lower-income household profile, screen leases tightly.
- Zoned schools: Rufus C Burleson El (math 37% / reading 28%, grade F, #2,234 of 4,322 statewide, top 52%, 506 students, 98% FRL); E B Comstock Middle (math 17% / reading 18%, grade F, #1,507 of 1,662 statewide, top 91%, 683 students, 98% FRL); H Grady Spruce H S (math 21% / reading 18%, grade F, #1,424 of 1,632 statewide, top 88%, 1,558 students, 96% FRL).
- Market conditions: Rents rising (+1.0%/yr); 203 active listings in the ZIP; 17 comparable units currently listed for rent nearby; rentals leasing fast (median 8d on market — plan ~1-2 weeks tenant-placement turnaround); 12,577 units permitted in Dallas County in 2024 (6,829 in 5+ unit buildings).
- This rent runs 40% of the median local income ($56k/yr) — at the standard rent-burdened threshold; future hikes will face affordability resistance.
Forward outlook
- Local home prices are declining (-3.0%/yr); year-one equity from $2k of loan paydown is wiped out by about $7k of value loss. Plan a longer hold.
- Dallas County population projected at +35% by 2050 — long-run rental-demand tailwind backs the buy-and-hold thesis.
Negotiation context
- It's been on market 64 days — a 6% lower offer ($205k) is reasonable based on typical stale-listing flexibility.
- Current owner paid $31k; list at $218k implies a 604% gain — meaningful room to come down on a strong offer.
Risks & watch-outs
- Watch-outs: built in 1955 — expect roof / HVAC / electrical / plumbing capex.
- Climate carrying-cost: major wind risk, 27% chance of damaging wind over 30y; extreme-heat days projected 7→27/yr by 2055 (HVAC capex compounding) — expect insurance premiums to compound above CPI over the hold.
Questions for the listing agent
- What do current leases actually rent for vs. the listed asking? Can we see a recent rent roll and the last 12 months of T-12 income?
- It's been on market 64 days. Have you received any prior offers? Is the seller open to a 15% concession, seller financing, or rate buy-down credit?
- Built in 1955 — when were the roof, HVAC, electrical panel, plumbing, and water heater last replaced?
- Why hasn't it sold? Are there any deal-killer items the seller is aware of (foundation, flood, title, zoning, code violations)?
- Is there a deadline driving the sale (1031 exchange, divorce, estate, relocation)? That informs how much negotiation room exists.
- Crime grade is F in this area — have there been break-ins, vandalism, or insurance claims at this property in the last 3 years? What carrier currently insures it and at what premium?
- The area grade is low — what's the realistic commute time and amenity access for the typical tenant pool here? Any planned neighborhood developments (good or bad) we should know about?
- What's the average days-on-market for RENTAL listings here right now (not sales)? A rising rental-DOM trend means longer vacancies and softer asking-rent achievability than the comps imply.
- What's the recent tenant-quality profile in this submarket — average credit score on applications, eviction rate, late-payment / NSF rate, and stable-employment percentage? A property-management company in the area should have these aggregated.
- How much new for-sale + rental construction is in the pipeline within 1–3 miles? Heavy new supply typically softens prices + rents 12–24 months out; constrained supply supports both.
Investment metrics
- 1% rule
- 0.85% ✗
- Cap rate
- 6.10%
- Cash-on-cash
- -0.68%
- DSCR
- 0.97
- GRM
- 9.8
CMA / ARV
- ARV (median comp)
- $236,040
- List price
- $217,700
- Delta
- -7.77%
- Verdict
- FAIR
- Comps
- 20 within 1.0 mi
Show comp detail 12 sales within ~0.75 mi
| Address | Dist | Beds/Ba | Sqft | Sold | Price | $/sf | Match |
|---|---|---|---|---|---|---|---|
| 547 Helena St | 0.15mi | 3/1.0 | 982 (-8%) | 6mo | $230,000 | $234 | 75 |
| 609 Woodmont Dr | 0.50mi | 3/2.0 | 1,028 (-4%) | 2mo | $227,900 | $222 | 65 |
| 6340 Bellbrook Dr | 0.32mi | 3/1.0 | 1,144 (+7%) | 13mo | $99,900 | $87 | 62 |
| 559 Helena St | 0.17mi | 3/2.0 | 1,178 (+10%) | 12mo | $257,500 | $219 | 61 |
| 6818 Oleta Dr | 0.73mi | 3/1.0 | 1,027 (-4%) | 10mo | $198,000 | $193 | 51 |
| 6520 Godfrey Ave | 0.60mi | 3/2.0 | 1,127 (+6%) | 9mo | $219,999 | $195 | 51 |
| 548 Ezekial Ave | 0.24mi | 3/2.0 | 1,222 (+15%) | 12mo | $151,000 | $124 | 50 |
| 535 Alcorn Ave | 0.54mi | 3/1.0 | 953 (-11%) | 11mo | $210,000 | $220 | 48 |
| 6526 Oleta Dr | 0.59mi | 2/2.0 (-1) | 986 (-8%) | 5mo | $119,900 | $122 | 47 |
| 6721 Oleta Dr | 0.65mi | 3/1.5 | 1,188 (+11%) | 4mo | $145,000 | $122 | 45 |
| 433 Alcorn Ave | 0.57mi | 3/1.5 | 1,192 (+12%) | 9mo | $174,950 | $147 | 44 |
| 7011 Antler Ave | 0.73mi | 3/1.5 | 1,200 (+13%) | 13mo | $125,000 | $104 | 32 |
Match score weights: distance 35% · size 25% · config 20% · recency 20%. Top-matched comps best support the ARV.
Projected returns pro-forma
-3.0% appreciation · 1.02% rent growth · sell at horizon
- IRR
- -19.6%
- Equity multiple
- 0.33×
- Total profit
- $-41,064
- Equity at exit
- $32,460
- IRR
- -17.2%
- Equity multiple
- 0.13×
- Total profit
- $-52,754
- Equity at exit
- $18,823
Cash invested: $60,956 (down + closing). Projections, not guarantees.
Landlord ↔ Tenant lean methodology
- Overall (STATE)
- 87 Strongly Landlord-Friendly
- State Texas
- 87 Strongly Landlord-Friendly · R+5
- County
- — inherits STATE
- City
- — inherits STATE
ZIP-level market 75217
- Home prices YoY
- -4.3%
- Rents YoY
- 1.0%
- Active inventory
- 203
- Price-to-rent
- 9.8×
Monthly cashflow live
- Estimated rent
- $1,852 high interval (Pro) →
- Mortgage (P&I)
- −$1,142
- Tax from tax record
- −$265 /mo · $3,182/yr
- Insurance
- −$91
- HOA
- −$0
- Vacancy / Maint / Mgmt
- −$389
- Net cashflow
- $-34
Break-even live
Sensitivity live
| Price | -10% $89 | -5% $27 | +0% $-34 | +5% $-96 | +10% $-158 |
|---|---|---|---|---|---|
| Rent | -10% $-181 | -5% $-108 | +0% $-34 | +5% $39 | +10% $112 |
| Rate | -1.0pp $75 | -0.5pp $21 | base $-34 | +0.5pp $-91 | +1.0pp $-148 |
UW: 25.0% down · 7.5% · 30yr · 1.5% tax · 5.0% vac · 8.0% maint · 8.0% mgmt
Financing live
Cash to close
- Down payment
- $54,425
- Closing costs
- $6,531
- Reserves months
- —
- Total cash needed
- —
Loan-product check · same deal, 3 products live
Conventional
25% down · 7.5% · 30yr
- Down + closing
- —
- Monthly P&I
- —
- Monthly cashflow
- —
- DSCR
- —
- Eligible?
- —
Personal DTI + credit; lowest rate.
DSCR
20% down · 8.5% · 30yr
- Down + closing
- —
- Monthly P&I
- —
- Monthly cashflow
- —
- DSCR
- —
- Eligible?
- —
No personal income docs; deal must DSCR.
Hard money
10% down · 12.0% · 12mo
- Down + closing
- —
- Monthly P&I
- —
- Monthly cashflow
- —
- DSCR
- —
- Eligible?
- —
Short-term bridge; refi at stabilization.
Rent comps 17 comps
| Address | Beds | Baths | Sqft | Rent | $/sqft | DOM | Units | Dist |
|---|---|---|---|---|---|---|---|---|
| 332 Ezekial Ave Dallas, TX | 3.0 | 2.5 | 1347 | $1,838 | $1.36 | 3d | 1 | 0.26mi |
| 328 Ezekial Ave Dallas, TX | 3.0 | 2.5 | 1347 | $2,098 | $1.56 | 8d | 1 | 0.26mi |
| 146 Creek Cove Dr Dallas, TX | 3.0 | 2.5 | 1347 | $1,773 | $1.32 | 45d | 1 | 0.41mi |
| 130 Creek Cove Dr Dallas, TX | 3.0 | 2.5 | 1347 | $1,873 | $1.39 | 26d | 1 | 0.43mi |
| 220 Stoneport Dr Dallas, TX | 2.0–4.0 | 2.0 | 1062 | $1,518 | $1.43 | 7d | 13 | 0.44mi |
| 758 Bethpage Ave Dallas, TX | 4.0 | 2.0 | 1484 | $1,975 | $1.33 | 9d | 1 | 0.47mi |
| 445 Bolero Ave Dallas, TX | 3.0 | 2.0 | 1200 | $1,900 | $1.58 | 9d | 1 | 0.59mi |
| 6415 Godfrey Ave Dallas, TX | 2.0 | 1.0 | 751 | $1,435 | $1.91 | 3d | 1 | 0.61mi |
| 6811 Marla Dr Dallas, TX | 3.0 | 2.0 | 1070 | $1,850 | $1.73 | 3d | 1 | 0.62mi |
| 119 Palm Oak Dr Dallas, TX | 3.0 | 1.5 | 1401 | $2,000 | $1.43 | 8d | 1 | 0.77mi |
| 7250 Elam Rd Dallas, TX | 1.0–3.0 | 1.0–2.0 | 724 | $1,612 | $2.23 | 4d | 9 | 0.80mi |
| 121 N Jim Miller Rd Unit 121 Dallas, TX | 3.0 | 2.0 | 1169 | $1,175 | $1.01 | 9d | 1 | 0.84mi |
| 7203 Great Trinity Forest Way Dallas, TX | 2.0 | 1.0 | 850 | $1,114 | $1.31 | 45d | 1 | 1.03mi |
| 1355 N Jim Miller Rd Unit 121 Dallas, TX | 3.0 | 1.5 | 1169 | $1,250 | $1.07 | 4d | 1 | 1.26mi |
| 1355 N Jim Miller Rd Unit 23 Dallas, TX | 2.0 | 1.5 | 953 | $1,100 | $1.15 | 4d | 1 | 1.26mi |
| 7514 Olusta Dr Dallas, TX | 2.0 | 1.0 | 862 | $1,395 | $1.62 | 19d | 1 | 1.33mi |
| 7516 Olusta Dr Unit 7514 Dallas, TX | 2.0 | 1.0 | 862 | $1,395 | $1.62 | 26d | 1 | 1.33mi |
Listing history 17 events
-
2026-06-21days on market $217,700 Active 64 DOM
-
2026-06-18days on market $217,700 Active 61 DOM
-
2026-06-17days on market $217,700 Active 60 DOM
-
2026-06-16days on market $217,700 Active 59 DOM
-
2026-06-15days on market $217,700 Active 58 DOM
-
2026-06-13days on market $217,700 Active 56 DOM
-
2026-06-09days on market $217,700 Active 52 DOM
-
2026-06-08days on market $217,700 Active 51 DOM
-
2026-06-07days on market $217,700 Active 50 DOM
-
2026-06-04days on market $217,700 Active 47 DOM
-
2026-06-03days on market $217,700 Active 46 DOM
-
2026-06-02days on market $217,700 Active 45 DOM
-
2026-06-01days on market $217,700 Active 44 DOM
-
2026-05-31days on market $217,700 Active 43 DOM
-
2026-04-17$217,700 Active 625-char remark
-
2005-11-17soldstatus
-
2003-01-22soldstatus $30,920
ⓘ Source: listings_history table (triggers on properties + properties_extension) + one-shot
backfill from property_details.listing_events for pre-trigger history.
Tax reassessment forecast TX · Resets to sale price
- Current annual tax
- $3,182 · $265/mo
- Projected year-2 tax
- $3,984 · $332/mo
- Expected delta
- +$802/yr (+$67/mo · 25.2%)
ⓘ Screening estimate from a state-policy table — verify with the county assessor before closing.
Climate risk First Street
- Flood 1/10 Low FEMA zone X (unshaded) · 0% chance over 30 yrs
- Wildfire 3/10 Moderate
- Heat 7/10 Severe 7 d/yr ≥110°F today · 27 d/yr by 30 yrs out
- Wind 6/10 Major 27% chance of damaging wind over 30 yrs
- Air quality 2/10 Low 1 unhealthy d/yr today · 2 by 30 yrs out
Nearby sold comps map
Loading sold comps map…
Walkable amenities ~0.75 mi
Loading nearby amenities…
Taxation est. · year 1
- Rental income
- $22,224
- − Mortgage interest
- −$12,195
- − Property taxes
- −$3,182
- − Insurance
- −$1,088
- − Repairs & maintenance
- −$1,778
- − Management
- −$1,778
- − Depreciation
- −$6,333
- Taxable loss
- −$4,130
- Est. tax savings @ 24.0%
- +$991
- After-tax cash flow
- $578/yr
For passive investors: Depreciation is non-cash, so a rental often shows a tax loss while cash-flowing — sheltering income. Rental losses are passive: they offset passive income freely, and up to $25,000/yr can offset ordinary (W-2) income if you actively participate and your MAGI is under $100k (phasing out to $0 by $150k); unused losses carry forward. On sale, claimed depreciation is recaptured at up to 25%, and gains may owe capital-gains tax (a 1031 exchange can defer both). Figures are a year-1 estimate at your 24.0% rate — not tax advice; consult a CPA.
Schools (NCES district)
- District
- Dallas ISD
- NCES district ID
- 4816230
- Math proficiency
- 31% ▼ -16.00%
- Reading proficiency
- 36% ▼ -4.00%
- Median HH income
- $42,881
- Composite
- 28.41/100
- National rank
- #6763
- State rank
- #559 of 826 in TX
Livability — Dallas
- Score
- 81/100
- State rank
- #24
- US rank
- #1380
Category grades
Schools grade is shown separately in the Schools card above.
Census & demographics
- Census place
- Dallas, TX
- County
- Dallas County · 2,612,404 people
- City population
- 1,168,437
- Metro
- Dallas-Fort Worth-Arlington, TX
- Population (ZIP)
- 85,028
- Household income
- $55,723
- Rent vs Own
- Severe rent burden
- 2649.0
Population outlook (Dallas County) Hauer SSP2
- Today (2025)
- 2,979,839 people
- By 2030
- 3,191,823 · +7.1%
- By 2040
- 3,619,611 · +21.5%
- By 2050
- 4,026,915 · +35.1%
- By 2075
- 4,957,073 · +66.4%
- By 2100
- 5,508,725 · +84.9%
Race, ethnicity, and origin ACS 2023
- Neighborhood character
- Predominantly Hispanic (73%)
- Race & ethnicity
- Hispanic / Latino 73% Two or more races 34% Black 20% White 6%
- Hispanic origin (detail)
- Mexican 68%
- Foreign-born
- 30% · Canada, Philippines
- Languages at home
- 34% English-only · Spanish 65% Other Asian/Pacific 1%
Political lean MEDSL · Dallas
- 2024 margin
- Strong D (+22.2) · D 60.2% · R 38.0% · Other 1.8%
- 2008→2024 swing
- +6.9pp toward D · 2008: 15.3pp · 2024: 22.2pp
- All cycles
- 2024: D+22.2 2020: D+31.6 2016: D+26.2 2012: D+15.4 2008: D+15.3
Not yet ingested
- Civics
- —
Market trends
- HPI YoY
- ▼ -17.04%
- Current HPI
- 382.5527
- Rent YoY
- ▲ 1.02%
- Metro
- Dallas-Fort Worth-Arlington, TX
- State GDP YoY
- ▲ 3.95%
- F500 in state
- 110
Industry mix (Fortune 500 HQ in TX)
| Industry | F500 HQs | Revenue |
|---|---|---|
| Energy | 16 | $1,198B |
|
||
| Technology | 5 | $198B |
|
||
| Engineering / Construction | 4 | $72B |
|
||
| Energy Services | 3 | $60B |
|
||
| Utilities | 3 | $41B |
|
||
| Healthcare | 2 | $330B |
|
||
Price history
+604.1% since first listed3 events — show timeline
- 2026-04-17 Listed $217,700 NTREIS
- 2005-11-17 Sold (Public Records) — Public Records
- 2003-01-22 Sold (Public Records) $30,920 Public Records
Property tax history
+11.4%/yrLatest (2025): $3,182 · +68.7% YoY. Source: county tax records.
Cash-flow waterfall
monthlySold comps — $/sqft
last 12 mo · ≤1 miLoading sold comps…