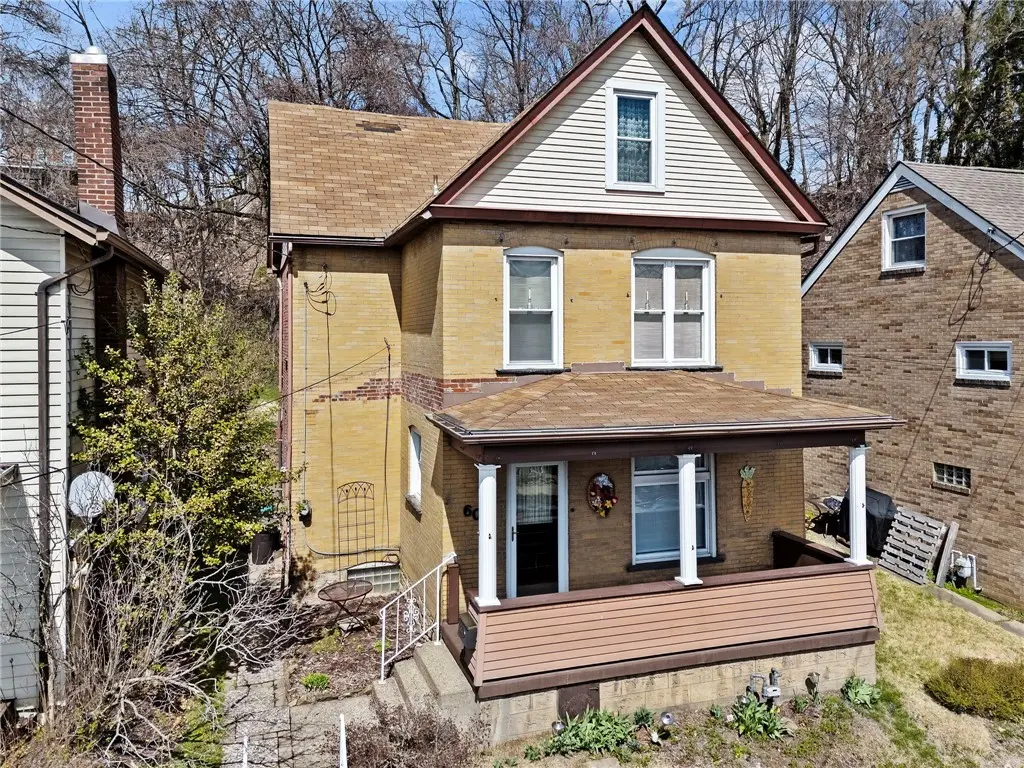
601 E 7th Ave · Tarentum, PA
Flood risk 5/10 · Moderate
- FEMA flood zone
- X (unshaded)
- Chance of flooding over 30 yrs
- 0.27%
- Est. flood insurance / yr
- $473 – $860
Fire risk 1/10 · Minimal
- Est. fire insurance / yr
- $511 – $949
Heat risk 4/10 · Minor
- Hot days now (above 97°F)
- 8 days/yr
- Hot days in 30 yrs
- 19 days/yr
Wind risk 2/10 · Minimal
- Chance of severe wind over 30 yrs
- 0.0%
Air-quality risk 4/10 · Minor
- Unhealthy air days now
- 4 days/yr
- Unhealthy air days in 30 yrs
- 5 days/yr
Risk factors via First Street. Map © Google.
Why this score? — see what drove the C grade
The composite is a weighted blend of 9 inputs, each scored 0–100. Each bar is that input's sub-score; the figure is the points it added to the 100-point composite (weight × sub-score).
- Cash flow +24.6/30.0
- DSCR +7.9/10.0
- 1% rule +5.4/10.0
- Appreciation +5.2/10.0
- Livability +4.0/5.0
- Schools +3.3/10.0
- Rent growth +2.5/5.0
- Condition / age +2.5/5.0
- ARV discount +0.0/15.0
$129,900
🖨 Deal sheet 📄 Offer letter ✓ Due diligence
Listing remarks MLS
CHARM, CHARACTER, and OPPORTUNITY come together in this well maintained 2 STORY HOME with a FULL ATTIC that offers potential for a 4TH BEDROOM or additional living space. Perfect for a FIRST TIME HOMEBUYER or INVESTOR looking for value and flexibility. Step inside and appreciate the GORGEOUS ORIGINAL WOODWORK that adds warmth and timeless appeal throughout. The LIVING ROOM features HIDDEN POCKET DOORS, creating both function and charm rarely found in today’s homes. HARDWOOD FLOORS are located UNDER CARPET, ready to be uncovered and restored to their full beauty. The home is MOVE IN READY with DOUBLE PANED WINDOWS for efficiency and comfort. The EAT IN KITCHEN provides a practical layout with space for everyday dining and gatherings. Enjoy outdoor living with a GREAT BACKYARD and a welcoming FRONT PORCH, ideal for relaxing or entertaining. Located in a QUIET NEIGHBORHOOD, this property offers a peaceful setting while still being convenient to local amenities. A solid opportunity for a FIRST TIME HOMEBUYER looking to build equity or an INVESTOR seeking a property with CHARACTER and UPSIDE.
Key facts
- Hidden pocket doors
- Eat in kitchen
- Front porch
Tags
Neighborhood map
What this means for you Summary
Snapshot
- This is a 3-bed/1.0-bath single-family listed at $130k.
Deal economics
- At list price, monthly cash flow is $268 ($3k/yr) — positive.
- The deal already cash-flows at list — no discount required.
- Meets the 1% rule at list price ($1k rent vs $130k).
- Recommended offer: $122k (6.0% below list) — sets the bar for market timing.
Location & tenants
- Location reads 79/100 on livability (#240 in PA, #2,066 nationally) — a middle-class / working-renter tenant base. Strengths: commute A+, cost of living A+, housing A+; Watch: schools C-, amenities F, employment F.
- Highlands SD (suburban): math 29% / reading 48% proficiency, ranked #376 of 539 in PA (top 70%) — families likely to look elsewhere, expect single-tenant / working-renter base with shorter leases.
- Market conditions: 39 active listings in the ZIP; 8 comparable units currently listed for rent nearby; rentals at typical pace (median 15d on market — plan ~3-4 weeks tenant-placement turnaround); 2,996 units permitted in Allegheny County in 2024 (1,588 in 5+ unit buildings).
Forward outlook
- In year one you build about $1k of equity ($898 loan paydown + $589 appreciation (0.5% local appreciation)).
- At projected returns (0.5% appreciation + 3.0% rent growth), your $36k cash investment doubles in ~7 years — after that, you're playing with house money.
Negotiation context
- It's been on market 63 days — a 6% lower offer ($122k) is reasonable based on typical stale-listing flexibility.
Risks & watch-outs
- Watch-outs: built in 1900 — expect roof / HVAC / electrical / plumbing capex.
- Climate carrying-cost: moderate flood risk — expect insurance premiums to compound above CPI over the hold.
Questions for the listing agent
- It's been on market 63 days. Have you received any prior offers? Is the seller open to a 6% concession, seller financing, or rate buy-down credit?
- Built in 1900 — when were the roof, HVAC, electrical panel, plumbing, and water heater last replaced?
- Why hasn't it sold? Are there any deal-killer items the seller is aware of (foundation, flood, title, zoning, code violations)?
- Is there a deadline driving the sale (1031 exchange, divorce, estate, relocation)? That informs how much negotiation room exists.
- What's the average days-on-market for RENTAL listings here right now (not sales)? A rising rental-DOM trend means longer vacancies and softer asking-rent achievability than the comps imply.
- What's the recent tenant-quality profile in this submarket — average credit score on applications, eviction rate, late-payment / NSF rate, and stable-employment percentage? A property-management company in the area should have these aggregated.
- How much new for-sale + rental construction is in the pipeline within 1–3 miles? Heavy new supply typically softens prices + rents 12–24 months out; constrained supply supports both.
Investment metrics
- 1% rule
- 1.04% ✓
- Cap rate
- 8.76%
- Cash-on-cash
- 8.83%
- DSCR
- 1.39
- GRM
- 8.0
CMA / ARV
- ARV (median comp)
- $107,959
- List price
- $129,900
- Delta
- 20.32%
- Verdict
- OVERPRICED
- Comps
- 20 within 1.0 mi
Show comp detail 12 sales within ~0.75 mi
| Address | Dist | Beds/Ba | Sqft | Sold | Price | $/sf | Match |
|---|---|---|---|---|---|---|---|
| 473 E 7th | 0.02mi | 3/2.0 | 1,417 (+7%) | 4mo | $115,000 | $81 | 79 |
| 515 E 8th Ave | 0.15mi | 2/1.0 (-1) | 1,260 (-4%) | 3mo | $55,000 | $44 | 78 |
| 524 Roup St | 0.19mi | 3/2.0 | 1,440 (+9%) | 2mo | $183,000 | $127 | 71 |
| 108 W 8th Ave | 0.64mi | 3/1.0 | 1,312 (-1%) | 6mo | $85,750 | $65 | 64 |
| 135 E First Ave | 0.48mi | 2/1.5 (-1) | 1,292 (-2%) | 4mo | $120,000 | $93 | 64 |
| 1126 Highland St | 0.35mi | 3/1.5 | 1,440 (+9%) | 7mo | $206,500 | $143 | 61 |
| 807 Hazlett Ave | 0.18mi | 2/1.0 (-1) | 1,136 (-14%) | 6mo | $15,000 | $13 | 58 |
| 612 Roup St | 0.16mi | 2/1.0 (-1) | 1,140 (-14%) | 8mo | $31,000 | $27 | 58 |
| 805 Kentucky St | 0.73mi | 3/1.0 | 1,216 (-8%) | 0mo | $138,000 | $113 | 53 |
| 1117 8th Ave | 0.71mi | 2/1.5 (-1) | 1,302 (-1%) | 8mo | $78,000 | $60 | 51 |
| 1107 Constitution St | 0.38mi | 2/1.5 (-1) | 1,122 (-15%) | 1mo | $152,000 | $135 | 49 |
| 1066 Roup Ave | 0.66mi | 3/2.0 | 1,515 (+15%) | 3mo | $148,000 | $98 | 38 |
Match score weights: distance 35% · size 25% · config 20% · recency 20%. Top-matched comps best support the ARV.
Projected returns pro-forma
0.45% appreciation · 3.0% rent growth · sell at horizon
- IRR
- 9.0%
- Equity multiple
- 1.44×
- Total profit
- $15,999
- Equity at exit
- $40,693
- IRR
- 13.4%
- Equity multiple
- 2.54×
- Total profit
- $55,977
- Equity at exit
- $51,355
Cash invested: $36,372 (down + closing). Projections, not guarantees.
Landlord ↔ Tenant lean methodology
- Overall (STATE)
- 62 Landlord-Friendly
- State Pennsylvania
- 62 Landlord-Friendly · EVEN
- County
- — inherits STATE
- City
- — inherits STATE
ZIP-level market 15084
- Home prices YoY
- 0.2%
- Active inventory
- 39
- Price-to-rent
- 8.0×
Monthly cashflow live
- Estimated rent
- $1,351 high interval (Pro) →
- Mortgage (P&I)
- −$681
- Tax from tax record
- −$64 /mo · $770/yr
- Insurance
- −$54
- HOA
- −$0
- Vacancy / Maint / Mgmt
- −$284
- Net cashflow
- $268
Break-even live
UW: 25.0% down · 7.5% · 30yr · 1.5% tax · 5.0% vac · 8.0% maint · 8.0% mgmt
Financing live
Cash to close
- Down payment
- $32,475
- Closing costs
- $3,897
- Reserves months
- —
- Total cash needed
- —
Loan-product check · same deal, 3 products live
Conventional
25% down · 7.5% · 30yr
- Down + closing
- —
- Monthly P&I
- —
- Monthly cashflow
- —
- DSCR
- —
- Eligible?
- —
Personal DTI + credit; lowest rate.
DSCR
20% down · 8.5% · 30yr
- Down + closing
- —
- Monthly P&I
- —
- Monthly cashflow
- —
- DSCR
- —
- Eligible?
- —
No personal income docs; deal must DSCR.
Hard money
10% down · 12.0% · 12mo
- Down + closing
- —
- Monthly P&I
- —
- Monthly cashflow
- —
- DSCR
- —
- Eligible?
- —
Short-term bridge; refi at stabilization.
Rent comps 8 comps
| Address | Beds | Baths | Sqft | Rent | $/sqft | DOM | Units | Dist |
|---|---|---|---|---|---|---|---|---|
| 875 1st Ave Brackenridge, PA | 3.0 | 2.0 | 1440 | $1,399 | $0.97 | 14d | 1 | 0.45mi |
| 1067 Cleveland Ave Brackenridge, PA | 3.0 | 1.0 | 1096 | $1,500 | $1.37 | 43d | 1 | 0.62mi |
| 1067 Cleveland Ave Brackenridge, PA | 3.0 | 1.0 | 1096 | $1,350 | $1.23 | 1d | 1 | 0.62mi |
| 1079 9th Ave Brackenridge, PA | 2.0 | 1.0 | 1352 | $1,095 | $0.81 | 1d | 1 | 0.68mi |
| 1210 Minnesota Ave Natrona Heights, PA | 3.0 | 1.0 | 1224 | $1,980 | $1.62 | 1d | 1 | 0.98mi |
| 424 W 7th Ave Unit 1 Tarentum, PA | 2.0 | 1.0 | 1632 | $1,000 | $0.61 | 43d | 1 | 1.02mi |
| 424 W 7th Ave Unit 2 Tarentum, PA | 3.0 | 1.0 | 1632 | $1,250 | $0.77 | 43d | 1 | 1.02mi |
| 300 Craigdell Rd New Kensington, PA | 3.0 | 2.0 | 1300 | $1,130 | $0.87 | 1d | 1 | 1.32mi |
Listing history 15 events
-
2026-06-18days on market $129,900 Active 63 DOM
-
2026-06-17days on market $129,900 Active 62 DOM
-
2026-06-16days on market $129,900 Active 61 DOM
-
2026-06-15days on market $129,900 Active 60 DOM
-
2026-06-13days on market $129,900 Active 58 DOM
-
2026-06-13days on market $129,900 Active 57 DOM
-
2026-06-09days on market $129,900 Active 54 DOM
-
2026-06-08days on market $129,900 Active 53 DOM
-
2026-06-07days on market $129,900 Active 52 DOM
-
2026-06-05days on market $129,900 Active 49 DOM
-
2026-06-03days on market $129,900 Active 48 DOM
-
2026-06-02days on market $129,900 Active 47 DOM
-
2026-06-01days on market $129,900 Active 46 DOM
-
2026-05-31days on market $129,900 Active 45 DOM
-
2026-04-16$129,900 Active 1110-char remark
Show marketing remark (1110 chars)
CHARM, CHARACTER, and OPPORTUNITY come together in this well maintained 2 STORY HOME with a FULL ATTIC that offers potential for a 4TH BEDROOM or additional living space. Perfect for a FIRST TIME HOMEBUYER or INVESTOR looking for value and flexibility. Step inside and appreciate the GORGEOUS ORIGINAL WOODWORK that adds warmth and timeless appeal throughout. The LIVING ROOM features HIDDEN POCKET DOORS, creating both function and charm rarely found in today’s homes. HARDWOOD FLOORS are located UNDER CARPET, ready to be uncovered and restored to their full beauty. The home is MOVE IN READY with DOUBLE PANED WINDOWS for efficiency and comfort. The EAT IN KITCHEN provides a practical layout with space for everyday dining and gatherings. Enjoy outdoor living with a GREAT BACKYARD and a welcoming FRONT PORCH, ideal for relaxing or entertaining. Located in a QUIET NEIGHBORHOOD, this property offers a peaceful setting while still being convenient to local amenities. A solid opportunity for a FIRST TIME HOMEBUYER looking to build equity or an INVESTOR seeking a property with CHARACTER and UPSIDE.
ⓘ Source: listings_history table (triggers on properties + properties_extension) + one-shot
backfill from property_details.listing_events for pre-trigger history.
Tax reassessment forecast PA · Partial reset (capped growth)
- Current annual tax
- $770 · $64/mo
- Projected year-2 tax
- $1,411 · $118/mo
- Expected delta
- +$641/yr (+$53/mo · 83.2%)
ⓘ Screening estimate from a state-policy table — verify with the county assessor before closing.
Climate risk First Street
- Flood 5/10 Major FEMA zone X (unshaded) · 27% chance over 30 yrs
- Wildfire 1/10 Low
- Heat 4/10 Moderate 8 d/yr ≥97°F today · 19 d/yr by 30 yrs out
- Wind 2/10 Low 0% chance of damaging wind over 30 yrs
- Air quality 4/10 Moderate 4 unhealthy d/yr today · 5 by 30 yrs out
Nearby sold comps map
Loading sold comps map…
Walkable amenities ~0.75 mi
Loading nearby amenities…
Taxation est. · year 1
- Rental income
- $16,210
- − Mortgage interest
- −$7,276
- − Property taxes
- −$770
- − Insurance
- −$650
- − Repairs & maintenance
- −$1,297
- − Management
- −$1,297
- − Depreciation
- −$3,779
- Taxable income
- $1,141
- Est. tax owed @ 24.0%
- −$274
- After-tax cash flow
- $2,937/yr
For passive investors: Depreciation is non-cash, so a rental often shows a tax loss while cash-flowing — sheltering income. Rental losses are passive: they offset passive income freely, and up to $25,000/yr can offset ordinary (W-2) income if you actively participate and your MAGI is under $100k (phasing out to $0 by $150k); unused losses carry forward. On sale, claimed depreciation is recaptured at up to 25%, and gains may owe capital-gains tax (a 1031 exchange can defer both). Figures are a year-1 estimate at your 24.0% rate — not tax advice; consult a CPA.
Schools (NCES district)
- District
- Highlands SD
- NCES district ID
- 4211880
- Math proficiency
- 29% ▼ -9.00%
- Reading proficiency
- 48% ▼ -9.00%
- Median HH income
- $43,730
- Composite
- 32.58/100
- National rank
- #5679
- State rank
- #376 of 539 in PA
Livability — Tarentum
- Score
- 79/100
- State rank
- #240
- US rank
- #2066
Category grades
Schools grade is shown separately in the Schools card above.
Census & demographics
- Census place
- Tarentum, PA
- Population (ZIP)
- 9,884
Population outlook (Allegheny County) Hauer SSP2
- Today (2025)
- 1,250,282 people
- By 2030
- 1,256,482 · +0.5%
- By 2040
- 1,256,318 · +0.5%
- By 2050
- 1,244,169 · -0.5%
- By 2075
- 1,197,693 · -4.2%
- By 2100
- 1,093,187 · -12.6%
Race, ethnicity, and origin ACS 2023
- Neighborhood character
- Predominantly White (92%)
- Race & ethnicity
- White 92% Two or more races 4% Black 3% Hispanic / Latino 1%
- Common ancestry
- Romanian 14% Lithuanian 2% Serbian 2%
- Foreign-born
- 1%
- Languages at home
- 98% English-only · French/Haitian/Cajun 1%
Political lean MEDSL · Allegheny
- 2024 margin
- Strong D (+20.3) · D 59.7% · R 39.4%
- 2008→2024 swing
- +4.8pp toward D · 2008: 15.5pp · 2024: 20.3pp
- All cycles
- 2024: D+20.3 2020: D+20.4 2016: D+16.4 2012: D+14.4 2008: D+15.5
Not yet ingested
- Civics
- —
Market trends
- HPI YoY
- ▲ 0.45%
- Current HPI
- 230.7532
- Rent YoY
- —
- Metro
- —
- State GDP YoY
- ▲ 1.68%
- F500 in state
- 34
Industry mix (Fortune 500 HQ in PA)
| Industry | F500 HQs | Revenue |
|---|---|---|
| Healthcare | 2 | $309B |
|
||
| Insurance | 2 | $27B |
|
||
| Telecommunications / Media | 1 | $124B |
|
||
| Industrial Distribution | 1 | $22B |
|
||
| Financial Services | 1 | $20B |
|
||
| Chemicals / Materials | 1 | $18B |
|
||
Price history
1 event — show timeline
- 2026-04-16 Listed $129,900 West Penn MLS
Property tax history
-0.4%/yrLatest (2026): $770 · -1.3% YoY. Source: county tax records.
Cash-flow waterfall
monthlySold comps — $/sqft
last 12 mo · ≤1 miLoading sold comps…