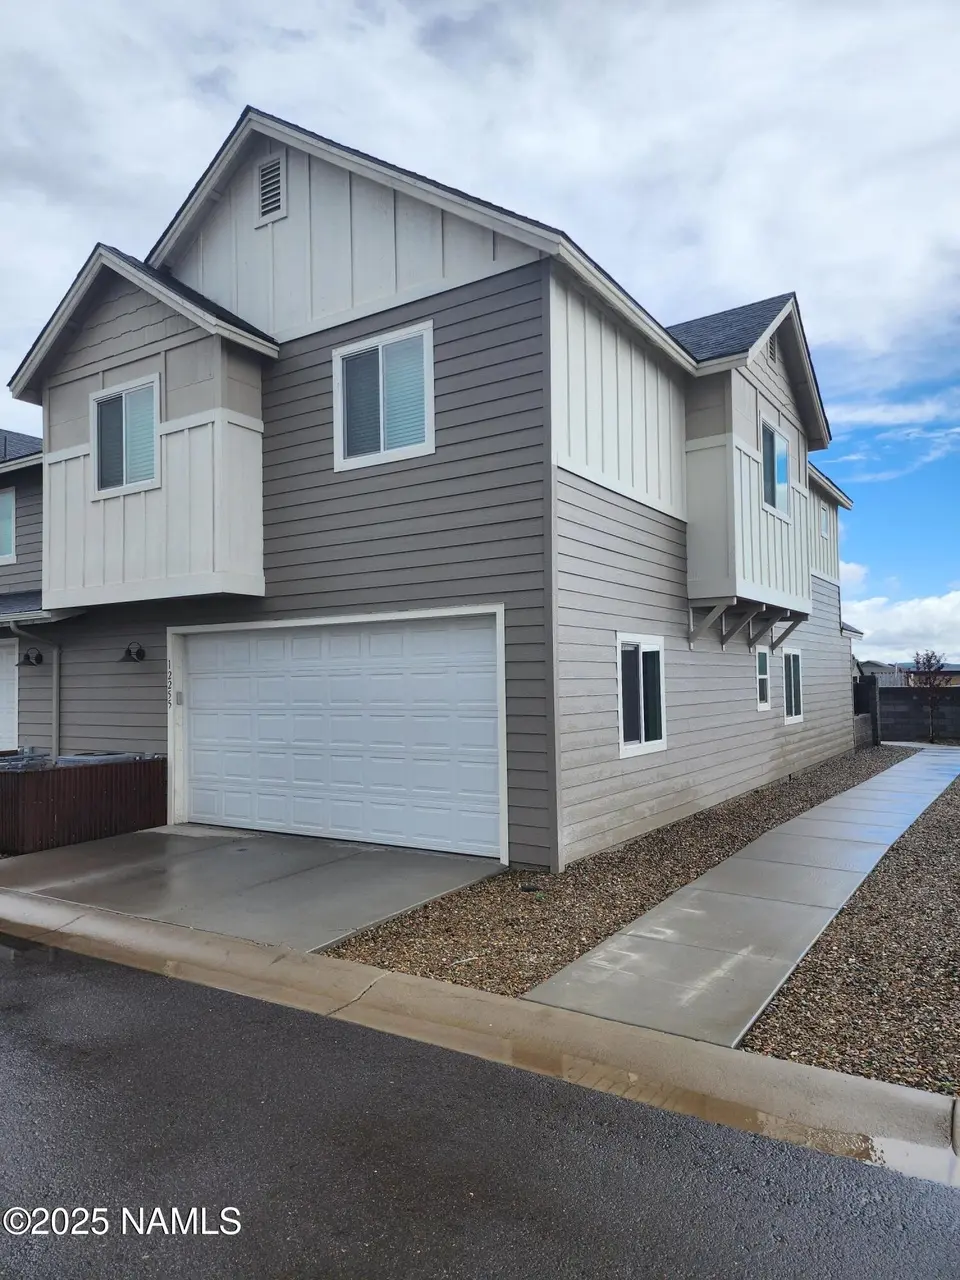
12255 Bliss Ave · Bellemont, AZ
Flood risk 1/10 · Minimal
- FEMA flood zone
- X (unshaded)
- Chance of flooding over 30 yrs
- 0.0%
- Est. flood insurance / yr
- $507 – $1,088
Fire risk 8/10 · Major
- Est. fire insurance / yr
- $610 – $1,132
Heat risk 2/10 · Minimal
- Hot days now (above 86°F)
- 8 days/yr
- Hot days in 30 yrs
- 21 days/yr
Wind risk 1/10 · Minimal
- Chance of severe wind over 30 yrs
- —
Air-quality risk 2/10 · Minimal
- Unhealthy air days now
- 1 days/yr
- Unhealthy air days in 30 yrs
- 1 days/yr
Risk factors via First Street. Map © Google.
Why this score? — see what drove the D grade
The composite is a weighted blend of 9 inputs, each scored 0–100. Each bar is that input's sub-score; the figure is the points it added to the 100-point composite (weight × sub-score).
- Cash flow +17.1/30.0
- DSCR +5.3/10.0
- Condition / age +4.0/5.0
- 1% rule +3.9/10.0
- Appreciation +3.5/10.0
- Rent growth +2.5/5.0
- Livability +2.5/5.0
- Schools +2.1/10.0
- ARV discount +0.0/15.0
$495,000
🖨 Deal sheet (PDF) 📄 Offer letter ✓ Due diligence
Listing remarks MLS
Energy Efficient end unit townhome that is move-in ready! Features include granite countertops, Samsung stainless steel appliances, soft-close shaker cabinets, and vinyl plank flooring. Furnishings and fully stocked kitchen negotiable- making it a true turnkey opportunity. Includes a 2-car garage and gated front yard. Community amenities: pickleball court, playground, dog park, picnic gazebos, and a large grassy park. Call today for a private showing.
Key facts
- Pickleball court
- Gated front yard
- Granite countertops
Tags
Neighborhood map
What this means for you Summary
Snapshot
- This is a 3-bed/2.5-bath condo listed at $495k. Condition is rated good.
Deal economics
- At list price, monthly cash flow is $344 ($4k/yr) — positive.
- The deal already cash-flows at list — no discount required.
- To meet the 1% rule (rent ≥ 1% of price), the offer needs to be $440k (11.1% below list).
- Recommended offer: $436k (12.0% below list) — sets the bar for market timing.
Location & tenants
- Location reads: area grade D — affects rentability + tenant quality, not the cash-flow math above.
- Flagstaff Unified District (4192) (urban): math 18% / reading 29% proficiency, ranked #158 of 249 in AZ (top 64%) — low school quality limits family demand, transient renter base, plan for 1-2y turnover.
- Zoned schools: Manuel Demiguel Elementary School (math 39% / reading 55%, grade D-, #308 of 1,109 statewide, top 29%, 579 students, 19% FRL); Mount Elden Middle School (math 16% / reading 23%, grade F, #134 of 218 statewide, top 63%, 757 students, 51% FRL); Flagstaff High School (math 22% / reading 27%, grade F, #154 of 381 statewide, top 53%, 1,620 students, 25% FRL).
- Market conditions: 45 active listings in the ZIP; 698 units permitted in Coconino County in 2024 (354 in 5+ unit buildings).
Forward outlook
- Local home prices are declining (-2.9%/yr); year-one equity from $3k of loan paydown is wiped out by about $14k of value loss. Plan a longer hold.
- Coconino County population projected at +20% by 2050 — long-run rental-demand tailwind backs the buy-and-hold thesis.
Negotiation context
- It's been on market 261 days — a 12% lower offer ($436k) is reasonable based on typical stale-listing flexibility.
- 2 sale attempts since 5y ago with the ask held roughly flat each time — persistent listings suggest the price (not the market) is what's stuck; bring a comps-based counter.
- Current owner paid $395k; 25% above their basis — modest negotiation headroom, anchor on the comps not their cost.
Risks & watch-outs
- Climate carrying-cost: severe wildfire risk — expect insurance premiums to compound above CPI over the hold.
Questions for the listing agent
- It's been on market 261 days. Have you received any prior offers? Is the seller open to a 12% concession, seller financing, or rate buy-down credit?
- What does the HOA fee cover, when was the last increase, and are there any pending special assessments or reserve-fund shortfalls?
- Any open or pending special assessments — roof, HVAC, plumbing, elevator, façade? What's the per-unit balance and payoff schedule, and is the seller paying it off at close or rolling it to the buyer?
- Why hasn't it sold? Are there any deal-killer items the seller is aware of (foundation, flood, title, zoning, code violations)?
- Is there a deadline driving the sale (1031 exchange, divorce, estate, relocation)? That informs how much negotiation room exists.
- The area grade is low — what's the realistic commute time and amenity access for the typical tenant pool here? Any planned neighborhood developments (good or bad) we should know about?
- What's the average days-on-market for RENTAL listings here right now (not sales)? A rising rental-DOM trend means longer vacancies and softer asking-rent achievability than the comps imply.
- What's the recent tenant-quality profile in this submarket — average credit score on applications, eviction rate, late-payment / NSF rate, and stable-employment percentage? A property-management company in the area should have these aggregated.
- How much new apartment / multifamily construction is in the pipeline within 1–3 miles? Heavy new supply (>2% of stock underway) typically softens rents 12–24 months out; light construction supports rent growth.
Investment metrics
- 1% rule
- 0.89% ✗
- Cap rate
- 7.13%
- Cash-on-cash
- 2.98%
- DSCR
- 1.13
- GRM
- 9.4
CMA / ARV
- ARV (median comp)
- $421,428
- List price
- $495,000
- Delta
- 17.46%
- Verdict
- OVERPRICED
- Comps
- 20 within 1.0 mi
Projected returns pro-forma
-2.91% appreciation · 3.0% rent growth · sell at horizon
- IRR
- -11.1%
- Equity multiple
- 0.59×
- Total profit
- $-56,505
- Equity at exit
- $75,808
- IRR
- -2.1%
- Equity multiple
- 0.86×
- Total profit
- $-19,808
- Equity at exit
- $46,245
Cash invested: $138,600 (down + closing). Projections, not guarantees.
Landlord ↔ Tenant lean methodology
- Overall (STATE)
- 87 Strongly Landlord-Friendly
- State Arizona
- 87 Strongly Landlord-Friendly · R+3
- County
- — inherits STATE
- City
- — inherits STATE
ZIP-level market 86015
- Home prices YoY
- -1.3%
- Active inventory
- 45
- Price-to-rent
- 9.4×
Monthly cashflow live
- Estimated rent
- $4,401 medium interval (Pro) →
- Mortgage (P&I)
- −$2,596
- Tax from tax record
- −$224 /mo · $2,694/yr
- Insurance
- −$206
- HOA
- −$106
- Vacancy / Maint / Mgmt
- −$924
- Net cashflow
- $344
Break-even live
Sensitivity live
| Price | -10% $625 | -5% $485 | +0% $344 | +5% $204 | +10% $64 |
|---|---|---|---|---|---|
| Rent | -10% $-3 | -5% $171 | +0% $344 | +5% $518 | +10% $692 |
| Rate | -1.0pp $594 | -0.5pp $470 | base $344 | +0.5pp $216 | +1.0pp $86 |
UW: 25.0% down · 7.5% · 30yr · 1.5% tax · 5.0% vac · 8.0% maint · 8.0% mgmt
Financing live
Cash to close
- Down payment
- $123,750
- Closing costs
- $14,850
- Reserves months
- —
- Total cash needed
- —
Loan-product check · same deal, 3 products live
Conventional
25% down · 7.5% · 30yr
- Down + closing
- —
- Monthly P&I
- —
- Monthly cashflow
- —
- DSCR
- —
- Eligible?
- —
Personal DTI + credit; lowest rate.
DSCR
20% down · 8.5% · 30yr
- Down + closing
- —
- Monthly P&I
- —
- Monthly cashflow
- —
- DSCR
- —
- Eligible?
- —
No personal income docs; deal must DSCR.
Hard money
10% down · 12.0% · 12mo
- Down + closing
- —
- Monthly P&I
- —
- Monthly cashflow
- —
- DSCR
- —
- Eligible?
- —
Short-term bridge; refi at stabilization.
HOA detail condo
- Monthly dues
- $106 · $1,272/yr
- Likely covers
- security
- Assessments
- None detected in remarks — confirm with the listing agent.
Listing history 23 events
-
2026-06-21days on market $495,000 Active 261 DOM
-
2026-06-19days on market $495,000 Active 259 DOM
-
2026-06-18days on market $495,000 Active 258 DOM
-
2026-06-17days on market $495,000 Active 257 DOM
-
2026-06-16days on market $495,000 Active 256 DOM
-
2026-06-15days on market $495,000 Active 255 DOM
-
2026-06-14days on market $495,000 Active 253 DOM
-
2026-06-13days on market $495,000 Active 252 DOM
-
2026-06-10days on market $495,000 Active 250 DOM
-
2026-06-09days on market $495,000 Active 249 DOM
-
2026-06-08days on market $495,000 Active 248 DOM
-
2026-06-07days on market $495,000 Active 247 DOM
-
2026-06-05days on market $495,000 Active 244 DOM
-
2026-06-03days on market $495,000 Active 243 DOM
-
2026-06-02days on market $495,000 Active 242 DOM
-
2026-06-01days on market $495,000 Active 241 DOM
-
2026-05-31days on market $495,000 Active 240 DOM
-
2026-05-30days on market $495,000 Active 239 DOM
-
2026-01-05price $495,000 457-char remark
Show marketing remark (457 chars)
Energy Efficient end unit townhome that is move-in ready! Features include granite countertops, Samsung stainless steel appliances, soft-close shaker cabinets, and vinyl plank flooring. Furnishings and fully stocked kitchen negotiable- making it a true turnkey opportunity. Includes a 2-car garage and gated front yard. Community amenities: pickleball court, playground, dog park, picnic gazebos, and a large grassy park. Call today for a private showing.
-
2025-10-21price $507,000 457-char remark
Show marketing remark (457 chars)
Energy Efficient end unit townhome that is move-in ready! Features include granite countertops, Samsung stainless steel appliances, soft-close shaker cabinets, and vinyl plank flooring. Furnishings and fully stocked kitchen negotiable- making it a true turnkey opportunity. Includes a 2-car garage and gated front yard. Community amenities: pickleball court, playground, dog park, picnic gazebos, and a large grassy park. Call today for a private showing.
-
2025-09-19$519,000 Active 457-char remark
Show marketing remark (457 chars)
Energy Efficient end unit townhome that is move-in ready! Features include granite countertops, Samsung stainless steel appliances, soft-close shaker cabinets, and vinyl plank flooring. Furnishings and fully stocked kitchen negotiable- making it a true turnkey opportunity. Includes a 2-car garage and gated front yard. Community amenities: pickleball court, playground, dog park, picnic gazebos, and a large grassy park. Call today for a private showing.
-
2021-12-30soldstatus $395,052 780-char remark
Show marketing remark (780 chars)
BRAND NEW ENERGY EFFICIENT TOWNHOME! One of the best new home values in the Flagstaff area. The community features 94 townhomes. Builder includes upgraded items like granite countertops (kitchen & bathrooms), Samsung® stainless steel appliances, shaker style cabinets with soft close drawers/doors, spray foam insulation with 2x6 construction, fiber optic internet ready, luxury vinyl plank flooring, an extended warranty and many more items STANDARD. Many designer choices are available to make this the home of your dreams. The townhomes each have an oversize 2 car garage and a gated/fenced front yard. Inside the community you will have a playground, a couple picnic gazebo's, a pickleball court, a large grassy park area for various activities and a fun dog park area
-
2021-12-01$395,052 780-char remark
Show marketing remark (780 chars)
BRAND NEW ENERGY EFFICIENT TOWNHOME! One of the best new home values in the Flagstaff area. The community features 94 townhomes. Builder includes upgraded items like granite countertops (kitchen & bathrooms), Samsung® stainless steel appliances, shaker style cabinets with soft close drawers/doors, spray foam insulation with 2x6 construction, fiber optic internet ready, luxury vinyl plank flooring, an extended warranty and many more items STANDARD. Many designer choices are available to make this the home of your dreams. The townhomes each have an oversize 2 car garage and a gated/fenced front yard. Inside the community you will have a playground, a couple picnic gazebo's, a pickleball court, a large grassy park area for various activities and a fun dog park area
ⓘ Source: listings_history table (triggers on properties + properties_extension) + one-shot
backfill from property_details.listing_events for pre-trigger history.
Tax reassessment forecast AZ · Resets to sale price
- Current annual tax
- $2,694 · $224/mo
- Projected year-2 tax
- $3,267 · $272/mo
- Expected delta
- +$573/yr (+$48/mo · 21.3%)
ⓘ Screening estimate from a state-policy table — verify with the county assessor before closing.
Climate risk First Street
- Flood 1/10 Low FEMA zone X (unshaded) · 0% chance over 30 yrs
- Wildfire 8/10 Severe
- Heat 2/10 Low 8 d/yr ≥86°F today · 21 d/yr by 30 yrs out
- Wind 1/10 Low
- Air quality 2/10 Low 1 unhealthy d/yr today · 1 by 30 yrs out
Nearby sold comps map
Loading sold comps map…
Walkable amenities ~0.75 mi
Loading nearby amenities…
Taxation est. · year 1
- Rental income
- $52,815
- − Mortgage interest
- −$27,728
- − Property taxes
- −$2,694
- − Insurance
- −$2,475
- − Repairs & maintenance
- −$4,225
- − Management
- −$4,225
- − HOA
- −$1,272
- − Depreciation
- −$14,400
- Taxable loss
- −$4,204
- Est. tax savings @ 24.0%
- +$1,009
- After-tax cash flow
- $5,142/yr
For passive investors: Depreciation is non-cash, so a rental often shows a tax loss while cash-flowing — sheltering income. Rental losses are passive: they offset passive income freely, and up to $25,000/yr can offset ordinary (W-2) income if you actively participate and your MAGI is under $100k (phasing out to $0 by $150k); unused losses carry forward. On sale, claimed depreciation is recaptured at up to 25%, and gains may owe capital-gains tax (a 1031 exchange can defer both). Figures are a year-1 estimate at your 24.0% rate — not tax advice; consult a CPA.
Condition & rehab AI · 13 photos
This move-in ready townhome is in good condition with modern finishes and appliances. It has potential for further value through landscaping and interior updates.
Value-add opportunities
- Both landscaping — improve curb appeal and add value
- Both furniture — update furniture to match style
- Both window treatments — improve natural light and aesthetics
Renovation cost estimate screening
Value-add ROI direction
- Both landscaping — improve curb appeal and add value ↑
- Both furniture — update furniture to match style ↑
- Both window treatments — improve natural light and aesthetics ↑
ⓘ Cost ranges are severity-bucket heuristics (US national rule-of-thumb). Get contractor quotes + a written scope before underwriting a rehab budget.
Schools (NCES district)
- District
- Flagstaff Unified District (4192)
- NCES district ID
- 0402860
- Math proficiency
- 18% ▼ -16.00%
- Reading proficiency
- 29% ▼ -10.00%
- Median HH income
- $53,510
- Composite
- 21.11/100
- National rank
- #8437
- State rank
- #158 of 249 in AZ
Livability — Bellemont
No livability data for this city. (Only ~50 U.S. cities are tracked.)
Census & demographics
- Census place
- Bellemont, AZ
- Population (ZIP)
- 1,447
Population outlook (Coconino County) Hauer SSP2
- Today (2025)
- 150,645 people
- By 2030
- 156,857 · +4.1%
- By 2040
- 168,714 · +12.0%
- By 2050
- 181,082 · +20.2%
- By 2075
- 218,399 · +45.0%
- By 2100
- 238,853 · +58.6%
Race, ethnicity, and origin ACS 2023
- Neighborhood character
- Highly diverse neighborhood (Simpson 0.77)
- Race & ethnicity
- White 44% Native American 23% Two or more races 22% Hispanic / Latino 17% Asian 4%
- Hispanic origin (detail)
- Mexican 15% Puerto Rican 1%
- Common ancestry
- Slovak 4% Iranian 2% Italian 2%
- Foreign-born
- 4%
- Languages at home
- 71% English-only · Other Asian/Pacific 3% Spanish 3% Tagalog/Filipino 1%
Political lean MEDSL · Coconino
- 2024 margin
- D (+19.9) · D 59.2% · R 39.4% · Other 1.4%
- 2008→2024 swing
- +2.9pp toward D · 2008: 17.0pp · 2024: 19.9pp
- All cycles
- 2024: D+19.9 2020: D+24.1 2016: D+19.4 2012: D+14.9 2008: D+17.0
Not yet ingested
- Civics
- —
Market trends
- HPI YoY
- ▼ -2.91%
- Current HPI
- 219.9374
- Rent YoY
- —
- Metro
- —
- State GDP YoY
- ▲ 4.54%
- F500 in state
- 20
Industry mix (Fortune 500 HQ in AZ)
| Industry | F500 HQs | Revenue |
|---|---|---|
| Technology | 2 | $13B |
|
||
| Mining / Metals | 1 | $23B |
|
||
| Environmental Services | 1 | $16B |
|
||
| Metals / Steel | 1 | $14B |
|
||
| Technology Distribution | 1 | $9B |
|
||
| Homebuilding | 1 | $8B |
|
||
Price history
+25.3% since first listed5 events — show timeline
- 2026-01-05 Price Changed $495,000 NAZMLS
- 2025-10-21 Price Changed $507,000 NAZMLS
- 2025-09-19 Listed $519,000 NAZMLS
- 2021-12-30 Sold (MLS) $395,052 NAZMLS
- 2021-12-01 Listed $395,052 NAZMLS
Property tax history
+129.0%/yrLatest (2025): $2,694 · +5.9% YoY. Source: county tax records.
Cash-flow waterfall
monthlySold comps — $/sqft
last 12 mo · ≤1 miLoading sold comps…