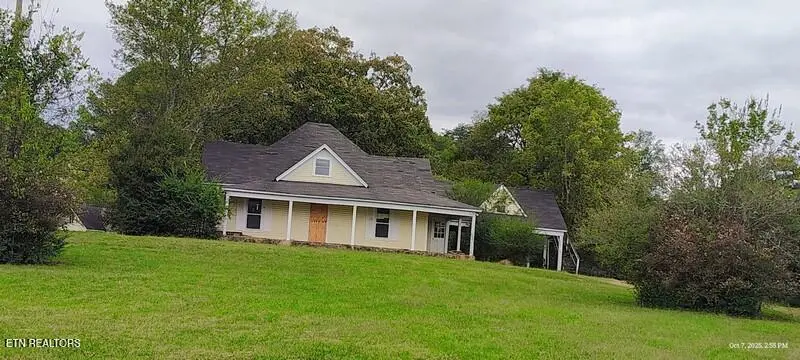
150 Larry Lynch Rd · Delano, TN
Flood risk 1/10 · Minimal
- FEMA flood zone
- X (unshaded)
- Chance of flooding over 30 yrs
- 0.0%
- Est. flood insurance / yr
- $473 – $860
Fire risk 6/10 · Moderate
- Est. fire insurance / yr
- $949 – $1,763
Heat risk 6/10 · Moderate
- Hot days now (above 105°F)
- 7 days/yr
- Hot days in 30 yrs
- 19 days/yr
Wind risk 2/10 · Minimal
- Chance of severe wind over 30 yrs
- 3.0%
Air-quality risk 3/10 · Minor
- Unhealthy air days now
- 2 days/yr
- Unhealthy air days in 30 yrs
- 2 days/yr
Risk factors via First Street. Map © Google.
Why this score? — see what drove the D+ grade
The composite is a weighted blend of 9 inputs, each scored 0–100. Each bar is that input's sub-score; the figure is the points it added to the 100-point composite (weight × sub-score).
- Cash flow +12.2/30.0
- Appreciation +10.0/10.0
- ARV discount +7.5/15.0
- DSCR +3.6/10.0
- Schools +2.7/10.0
- Rent growth +2.5/5.0
- Livability +2.5/5.0
- Condition / age +2.5/5.0
- 1% rule +2.4/10.0
$174,900
🖨 Deal sheet 📄 Offer letter ✓ Due diligence
Listing remarks MLS
This home has a great view of the mountains and just needs some love to bring back its historic southern charm as a farmhouse style home. it has a double attached carport with concrete. Home has had some additions originally built and all info such as sqft should be verified. Large front yard lined with evergreen trees for privacy from the roadway.
Key facts
- Large front yard
- 1.93 acre lot
- Garage
Tags
Neighborhood map
What this means for you Summary
Snapshot
- This is a 3-bed/1.0-bath single-family listed at $175k.
Deal economics
- At list price, monthly cash flow is $-36 ($-431/yr) — negative.
- To cash-flow at today's rent, offer at most $169k (3.6% below list).
- To meet the 1% rule (rent ≥ 1% of price), the offer needs to be $130k (25.8% below list).
- Recommended offer: $130k (25.8% below list) — sets the bar for 1% rule.
- Cap rate 6.0% vs local median 0.9% in Delano — top-decile yield for the area; either an underpriced asset or a hidden risk that comps aren't pricing in. Stress-test before assuming the spread holds.
Location & tenants
- Location reads: area grade D — affects rentability + tenant quality, not the cash-flow math above.
- Polk County (rural): math 32% / reading 32% proficiency, ranked #44 of 139 in TN (top 32%) — families likely to look elsewhere, expect single-tenant / working-renter base with shorter leases.
- Market conditions: 20 active listings in the ZIP; 211 units permitted in Polk County in 2024 (0 in 5+ unit buildings).
Forward outlook
- In year one you build about $19k of equity ($1k loan paydown + $17k appreciation (10.0% local appreciation)).
- Polk County population projected to shrink 9% by 2050 — rents likely to lag national; underwrite the cash flow, not the appreciation.
- At projected returns (10.0% appreciation + 3.0% rent growth), your $49k cash investment doubles in ~3 years — after that, you're playing with house money.
- By year 2, paydown + projected appreciation supports a ~$30k cash-out refi (75% LTV) — recoverable capital for the next deal without selling this one.
Negotiation context
- It's been on market 107 days — a 9% lower offer ($159k) is reasonable based on typical stale-listing flexibility.
- 2 sale attempts since 17y ago; this cycle's ask has dropped $25k (13%) from the opening price — seller is motivated, your offer sets the floor, not the list.
- Current owner paid $58k; list at $175k implies a 204% gain — meaningful room to come down on a strong offer.
Risks & watch-outs
- Watch-outs: built in 1930 — expect roof / HVAC / electrical / plumbing capex.
- Climate carrying-cost: major wildfire risk; extreme-heat days projected 7→19/yr by 2055 (HVAC capex compounding) — expect insurance premiums to compound above CPI over the hold.
Questions for the listing agent
- What do current leases actually rent for vs. the listed asking? Can we see a recent rent roll and the last 12 months of T-12 income?
- It's been on market 107 days. Have you received any prior offers? Is the seller open to a 26% concession, seller financing, or rate buy-down credit?
- Built in 1930 — when were the roof, HVAC, electrical panel, plumbing, and water heater last replaced?
- Why hasn't it sold? Are there any deal-killer items the seller is aware of (foundation, flood, title, zoning, code violations)?
- Is there a deadline driving the sale (1031 exchange, divorce, estate, relocation)? That informs how much negotiation room exists.
- The area grade is low — what's the realistic commute time and amenity access for the typical tenant pool here? Any planned neighborhood developments (good or bad) we should know about?
- What's the average days-on-market for RENTAL listings here right now (not sales)? A rising rental-DOM trend means longer vacancies and softer asking-rent achievability than the comps imply.
- What's the recent tenant-quality profile in this submarket — average credit score on applications, eviction rate, late-payment / NSF rate, and stable-employment percentage? A property-management company in the area should have these aggregated.
- How much new for-sale + rental construction is in the pipeline within 1–3 miles? Heavy new supply typically softens prices + rents 12–24 months out; constrained supply supports both.
Investment metrics
- 1% rule
- 0.74% ✗
- Cap rate
- 6.05%
- Cash-on-cash
- -0.88%
- DSCR
- 0.96
- GRM
- 11.2
CMA / ARV
- ARV (median comp)
- $446,896
- List price
- $174,900
- Delta
- -60.86%
- Verdict
- UNDERPRICED
- Comps
- 7 within 2.0 mi
Projected returns pro-forma
10.0% appreciation · 3.0% rent growth · sell at horizon
- IRR
- 23.6%
- Equity multiple
- 2.90×
- Total profit
- $92,897
- Equity at exit
- $157,564
- IRR
- 21.0%
- Equity multiple
- 6.62×
- Total profit
- $275,224
- Equity at exit
- $339,792
Cash invested: $48,972 (down + closing). Projections, not guarantees.
Landlord ↔ Tenant lean methodology
- Overall (STATE)
- 87 Strongly Landlord-Friendly
- State Tennessee
- 87 Strongly Landlord-Friendly · R+13
- County
- — inherits STATE
- City
- — inherits STATE
ZIP-level market 37325
- Active inventory
- 20
- Price-to-rent
- 11.2×
Monthly cashflow live
- Estimated rent
- $1,298 medium interval (Pro) →
- Mortgage (P&I)
- −$917
- Tax from tax record
- −$71 /mo · $853/yr
- Insurance
- −$73
- HOA
- −$0
- Vacancy / Maint / Mgmt
- −$273
- Net cashflow
- $-36
Break-even live
UW: 25.0% down · 7.5% · 30yr · 1.5% tax · 5.0% vac · 8.0% maint · 8.0% mgmt
Financing live
Cash to close
- Down payment
- $43,725
- Closing costs
- $5,247
- Reserves months
- —
- Total cash needed
- —
Loan-product check · same deal, 3 products live
Conventional
25% down · 7.5% · 30yr
- Down + closing
- —
- Monthly P&I
- —
- Monthly cashflow
- —
- DSCR
- —
- Eligible?
- —
Personal DTI + credit; lowest rate.
DSCR
20% down · 8.5% · 30yr
- Down + closing
- —
- Monthly P&I
- —
- Monthly cashflow
- —
- DSCR
- —
- Eligible?
- —
No personal income docs; deal must DSCR.
Hard money
10% down · 12.0% · 12mo
- Down + closing
- —
- Monthly P&I
- —
- Monthly cashflow
- —
- DSCR
- —
- Eligible?
- —
Short-term bridge; refi at stabilization.
Listing history 21 events
-
2026-06-19days on market $174,900 Active 107 DOM
-
2026-06-18days on market $174,900 Active 106 DOM
-
2026-06-17days on market $174,900 Active 105 DOM
-
2026-06-16days on market $174,900 Active 104 DOM
-
2026-06-15days on market $174,900 Active 103 DOM
-
2026-06-14days on market $174,900 Active 101 DOM
-
2026-06-13days on market $174,900 Active 100 DOM
-
2026-06-10days on market $174,900 Active 98 DOM
-
2026-06-09days on market $174,900 Active 97 DOM
-
2026-06-08days on market $174,900 Active 96 DOM
-
2026-06-07pricedays on market $174,900 Active 95 DOM
-
2026-06-03days on market $184,900 Active 91 DOM
-
2026-06-02days on market $184,900 Active 90 DOM
-
2026-06-01days on market $184,900 Active 89 DOM
-
2026-05-31days on market $184,900 Active 88 DOM
-
2026-05-30days on market $184,900 Active 87 DOM
-
2026-05-08price $184,900 350-char remark
Show marketing remark (350 chars)
This home has a great view of the mountains and just needs some love to bring back its historic southern charm as a farmhouse style home. it has a double attached carport with concrete. Home has had some additions originally built and all info such as sqft should be verified. Large front yard lined with evergreen trees for privacy from the roadway.
-
2026-04-02price $189,900 350-char remark
Show marketing remark (350 chars)
This home has a great view of the mountains and just needs some love to bring back its historic southern charm as a farmhouse style home. it has a double attached carport with concrete. Home has had some additions originally built and all info such as sqft should be verified. Large front yard lined with evergreen trees for privacy from the roadway.
-
2026-03-04$199,900 Active 350-char remark
Show marketing remark (350 chars)
This home has a great view of the mountains and just needs some love to bring back its historic southern charm as a farmhouse style home. it has a double attached carport with concrete. Home has had some additions originally built and all info such as sqft should be verified. Large front yard lined with evergreen trees for privacy from the roadway.
-
2009-05-29$330,000
-
2001-04-25soldstatus $57,500
ⓘ Source: listings_history table (triggers on properties + properties_extension) + one-shot
backfill from property_details.listing_events for pre-trigger history.
Tax reassessment forecast TN · Resets to sale price
- Current annual tax
- $853 · $71/mo
- Projected year-2 tax
- $1,242 · $103/mo
- Expected delta
- +$389/yr (+$32/mo · 45.6%)
ⓘ Screening estimate from a state-policy table — verify with the county assessor before closing.
Climate risk First Street
- Flood 1/10 Low FEMA zone X (unshaded) · 0% chance over 30 yrs
- Wildfire 6/10 Major
- Heat 6/10 Major 7 d/yr ≥105°F today · 19 d/yr by 30 yrs out
- Wind 2/10 Low 3% chance of damaging wind over 30 yrs
- Air quality 3/10 Moderate 2 unhealthy d/yr today · 2 by 30 yrs out
Nearby sold comps map
Loading sold comps map…
Walkable amenities ~0.75 mi
Loading nearby amenities…
Taxation est. · year 1
- Rental income
- $15,573
- − Mortgage interest
- −$9,797
- − Property taxes
- −$853
- − Insurance
- −$874
- − Repairs & maintenance
- −$1,246
- − Management
- −$1,246
- − Depreciation
- −$5,088
- Taxable loss
- −$3,531
- Est. tax savings @ 24.0%
- +$847
- After-tax cash flow
- $417/yr
For passive investors: Depreciation is non-cash, so a rental often shows a tax loss while cash-flowing — sheltering income. Rental losses are passive: they offset passive income freely, and up to $25,000/yr can offset ordinary (W-2) income if you actively participate and your MAGI is under $100k (phasing out to $0 by $150k); unused losses carry forward. On sale, claimed depreciation is recaptured at up to 25%, and gains may owe capital-gains tax (a 1031 exchange can defer both). Figures are a year-1 estimate at your 24.0% rate — not tax advice; consult a CPA.
Schools (NCES district)
- District
- Polk County
- NCES district ID
- 4703450
- Math proficiency
- 32% ▼ -6.00%
- Reading proficiency
- 32% ▼ -1.00%
- Median HH income
- $37,990
- Composite
- 26.72/100
- National rank
- #7149
- State rank
- #44 of 139 in TN
Livability — Delano
No livability data for this city. (Only ~50 U.S. cities are tracked.)
Census & demographics
- Population (ZIP)
- 1,952
Population outlook (Polk County) Hauer SSP2
- Today (2025)
- 16,734 people
- By 2030
- 16,567 · -1.0%
- By 2040
- 16,015 · -4.3%
- By 2050
- 15,172 · -9.3%
- By 2075
- 12,998 · -22.3%
- By 2100
- 10,606 · -36.6%
Race, ethnicity, and origin ACS 2023
- Neighborhood character
- Predominantly White (96%)
- Race & ethnicity
- White 96% Two or more races 3% Hispanic / Latino 1%
- Common ancestry
- Polish 2% Serbian 2% Lithuanian 1%
- Foreign-born
- 4% · Canada, China
- Languages at home
- 89% English-only · German/W. Germanic 10% Spanish 1%
Political lean MEDSL · Polk
- 2024 margin
- Solid R (+68.1) · D 15.5% · R 83.7%
- 2008→2024 swing
- -35.2pp toward R · 2008: -33.0pp · 2024: -68.1pp
- All cycles
- 2024: R+68.1 2020: R+63.4 2016: R+59.0 2012: R+37.2 2008: R+33.0
Not yet ingested
- Civics
- —
Market trends
- HPI YoY
- ▲ 118.08%
- Current HPI
- 433.79
- Rent YoY
- —
- Metro
- —
- State GDP YoY
- ▲ 2.78%
- F500 in state
- 22
Industry mix (Fortune 500 HQ in TN)
| Industry | F500 HQs | Revenue |
|---|---|---|
| Healthcare | 3 | $91B |
|
||
| Retail | 3 | $72B |
|
||
| Transportation / Logistics | 1 | $88B |
|
||
| Paper / Packaging | 1 | $19B |
|
||
| Insurance | 1 | $13B |
|
||
| Energy | 1 | $12B |
|
||
Price history
+221.6% since first listed5 events — show timeline
- 2026-05-08 Price Changed $184,900 Knoxville MLS
- 2026-04-02 Price Changed $189,900 Knoxville MLS
- 2026-03-04 Listed $199,900 Knoxville MLS
- 2009-05-29 Listed $330,000 Knoxville MLS
- 2001-04-25 Sold (Public Records) $57,500 Public Records
Property tax history
+0.9%/yrLatest (2025): $853 · +0.0% YoY. Source: county tax records.
Cash-flow waterfall
monthlySold comps — $/sqft
last 12 mo · ≤1 miLoading sold comps…