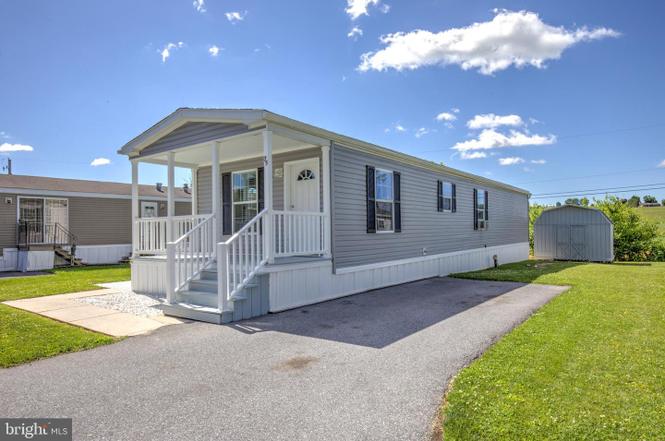
75 Lobin Rd · Earl, PA
Flood risk 1/10 · Minimal
- FEMA flood zone
- X (unshaded)
- Chance of flooding over 30 yrs
- 0.0%
- Est. flood insurance / yr
- $473 – $860
Fire risk 1/10 · Minimal
- Est. fire insurance / yr
- $511 – $949
Heat risk 5/10 · Moderate
- Hot days now (above 101°F)
- 7 days/yr
- Hot days in 30 yrs
- 15 days/yr
Wind risk 5/10 · Moderate
- Chance of severe wind over 30 yrs
- 24.0%
Air-quality risk 5/10 · Moderate
- Unhealthy air days now
- 6 days/yr
- Unhealthy air days in 30 yrs
- 8 days/yr
Risk factors via First Street. Map © Google.
Why this score? — see what drove the C grade
The composite is a weighted blend of 9 inputs, each scored 0–100. Each bar is that input's sub-score; the figure is the points it added to the 100-point composite (weight × sub-score).
- Cash flow +24.9/30.0
- DSCR +8.1/10.0
- ARV discount +7.5/15.0
- 1% rule +5.4/10.0
- Schools +3.6/10.0
- Rent growth +2.5/5.0
- Livability +2.5/5.0
- Condition / age +2.5/5.0
- Appreciation +0.0/10.0
$119,500
🖨 Deal sheet (PDF) 📄 Offer letter ✓ Due diligence
Listing remarks MLS
PC3742 14X70 MOBILE HM W/ 2-SHEDS(1-10X14 WOOD SHED 1-YR OLD) * MSTR SUITEW/ GARDEN TUB * WALK-IN CLOSET * ALL APPLIANCES STAY * A/C * REDWOOD DECK ENCLOSED W/ SHRUBS
Key facts
- Open floor plan
- Front porch
- Modern finishes
Tags
Property features AI
Finance
- Other: Property manager present; Pets allowed with restrictions (size/weight limits, pet addendum/deposit, number limits, breed restrictions)
- HOA & community: Ground rent $561 monthly; rented lot
Exterior
- Parking: Off-street parking
- Utilities: Electric hot water; Private sewer; Community water
- Home design: Manufactured single-wide home; Estimated year built
- Construction: Vinyl siding; Shingle roof; No basement
- Exterior features: Porch(es); Shed; Rented lot (ground rent)
Interior
- Kitchen: Built-in microwave; Dishwasher; Gas range/oven; Refrigerator; Stainless steel appliances
- Bedrooms: Two bedrooms on the main level
- Bathrooms: One full bathroom
- Heating & cooling: Forced air heating; Propane (owned) heating fuel; Window cooling units (electric)
- Interior features: Open floor plan with family room off the kitchen; Combination kitchen/dining area; Recessed lighting; Ceiling fan(s); Tub/shower
- Laundry & utility: Washer and dryer on the main floor
Neighborhood map
What this means for you Summary
Snapshot
- This is a 2-bed/1.0-bath manufactured listed at $120k.
Deal economics
- At list price, monthly cash flow is $258 ($3k/yr) — positive.
- The deal already cash-flows at list — no discount required.
- Meets the 1% rule at list price ($1k rent vs $120k).
Location & tenants
- Location reads: area grade C — affects rentability + tenant quality, not the cash-flow math above.
- Eastern Lancaster County SD (suburban): math 34% / reading 48% proficiency, ranked #321 of 539 in PA (top 60%) — families likely to look elsewhere, expect single-tenant / working-renter base with shorter leases.
- Market conditions: 15 active listings in the ZIP; 1,093 units permitted in Lancaster County in 2024 (201 in 5+ unit buildings).
Forward outlook
- Local home prices are declining (-3.0%/yr); year-one equity from $826 of loan paydown is wiped out by about $4k of value loss. Plan a longer hold.
- Lancaster County population projected at +5% by 2050 — modest demand growth; plan on rents tracking national, not racing it.
Negotiation context
- Only 2 days on market — expect competitive offers; lowballing is unlikely to land.
- 2 sale attempts since 24y ago with the ask held roughly flat each time — persistent listings suggest the price (not the market) is what's stuck; bring a comps-based counter.
- Current owner paid $14k; list at $120k implies a 724% gain — meaningful room to come down on a strong offer.
Risks & watch-outs
- Climate carrying-cost: moderate wind risk, 24% chance of damaging wind over 30y; extreme-heat days projected 7→15/yr by 2055 (HVAC capex compounding) — expect insurance premiums to compound above CPI over the hold.
Questions for the listing agent
- Is there a deadline driving the sale (1031 exchange, divorce, estate, relocation)? That informs how much negotiation room exists.
- What's the average days-on-market for RENTAL listings here right now (not sales)? A rising rental-DOM trend means longer vacancies and softer asking-rent achievability than the comps imply.
- What's the recent tenant-quality profile in this submarket — average credit score on applications, eviction rate, late-payment / NSF rate, and stable-employment percentage? A property-management company in the area should have these aggregated.
- How much new for-sale + rental construction is in the pipeline within 1–3 miles? Heavy new supply typically softens prices + rents 12–24 months out; constrained supply supports both.
Investment metrics
- 1% rule
- 1.04% ✓
- Cap rate
- 8.89%
- Cash-on-cash
- 9.26%
- DSCR
- 1.41
- GRM
- 8.0
CMA / ARV
No comps found within radius.
Projected returns pro-forma
-3.0% appreciation · 3.0% rent growth · sell at horizon
- IRR
- -2.4%
- Equity multiple
- 0.91×
- Total profit
- $-2,964
- Equity at exit
- $17,818
- IRR
- 7.3%
- Equity multiple
- 1.55×
- Total profit
- $18,415
- Equity at exit
- $10,332
Cash invested: $33,460 (down + closing). Projections, not guarantees.
Landlord ↔ Tenant lean methodology
- Overall (STATE)
- 62 Landlord-Friendly
- State Pennsylvania
- 62 Landlord-Friendly · EVEN
- County
- — inherits STATE
- City
- — inherits STATE
ZIP-level market 17519
- Home prices YoY
- -12.1%
- Active inventory
- 15
- Price-to-rent
- 8.0×
Monthly cashflow live
- Estimated rent
- $1,242 medium interval (Pro) →
- Mortgage (P&I)
- −$627
- Tax from tax record
- −$47 /mo · $561/yr
- Insurance
- −$50
- HOA
- −$0
- Vacancy / Maint / Mgmt
- −$261
- Net cashflow
- $258
Break-even live
Sensitivity live
| Price | -10% $326 | -5% $292 | +0% $258 | +5% $224 | +10% $191 |
|---|---|---|---|---|---|
| Rent | -10% $160 | -5% $209 | +0% $258 | +5% $307 | +10% $356 |
| Rate | -1.0pp $318 | -0.5pp $289 | base $258 | +0.5pp $227 | +1.0pp $196 |
UW: 25.0% down · 7.5% · 30yr · 1.5% tax · 5.0% vac · 8.0% maint · 8.0% mgmt
Financing live
Cash to close
- Down payment
- $29,875
- Closing costs
- $3,585
- Reserves months
- —
- Total cash needed
- —
Loan-product check · same deal, 3 products live
Conventional
25% down · 7.5% · 30yr
- Down + closing
- —
- Monthly P&I
- —
- Monthly cashflow
- —
- DSCR
- —
- Eligible?
- —
Personal DTI + credit; lowest rate.
DSCR
20% down · 8.5% · 30yr
- Down + closing
- —
- Monthly P&I
- —
- Monthly cashflow
- —
- DSCR
- —
- Eligible?
- —
No personal income docs; deal must DSCR.
Hard money
10% down · 12.0% · 12mo
- Down + closing
- —
- Monthly P&I
- —
- Monthly cashflow
- —
- DSCR
- —
- Eligible?
- —
Short-term bridge; refi at stabilization.
Listing history 3 events
-
2026-06-18days on market $119,500 Active 2 DOM
-
2026-06-16remarks 578-char remark
-
2026-06-16$119,500 Active 1 DOM
ⓘ Source: listings_history table (triggers on properties + properties_extension) + one-shot
backfill from property_details.listing_events for pre-trigger history.
Tax reassessment forecast PA · Partial reset (capped growth)
- Current annual tax
- $561 · $47/mo
- Projected year-2 tax
- $1,224 · $102/mo
- Expected delta
- +$664/yr (+$55/mo · 118.3%)
ⓘ Screening estimate from a state-policy table — verify with the county assessor before closing.
Climate risk First Street
- Flood 1/10 Low FEMA zone X (unshaded) · 0% chance over 30 yrs
- Wildfire 1/10 Low
- Heat 5/10 Major 7 d/yr ≥101°F today · 15 d/yr by 30 yrs out
- Wind 5/10 Major 24% chance of damaging wind over 30 yrs
- Air quality 5/10 Major 6 unhealthy d/yr today · 8 by 30 yrs out
Nearby sold comps map
Loading sold comps map…
Walkable amenities ~0.75 mi
Loading nearby amenities…
Taxation est. · year 1
- Rental income
- $14,907
- − Mortgage interest
- −$6,694
- − Property taxes
- −$561
- − Insurance
- −$598
- − Repairs & maintenance
- −$1,193
- − Management
- −$1,193
- − Depreciation
- −$3,476
- Taxable income
- $1,194
- Est. tax owed @ 24.0%
- −$286
- After-tax cash flow
- $2,812/yr
For passive investors: Depreciation is non-cash, so a rental often shows a tax loss while cash-flowing — sheltering income. Rental losses are passive: they offset passive income freely, and up to $25,000/yr can offset ordinary (W-2) income if you actively participate and your MAGI is under $100k (phasing out to $0 by $150k); unused losses carry forward. On sale, claimed depreciation is recaptured at up to 25%, and gains may owe capital-gains tax (a 1031 exchange can defer both). Figures are a year-1 estimate at your 24.0% rate — not tax advice; consult a CPA.
Schools (NCES district)
- District
- Eastern Lancaster County SD
- NCES district ID
- 4208820
- Math proficiency
- 34% ▼ -12.00%
- Reading proficiency
- 48% ▼ -15.00%
- Median HH income
- $57,567
- Composite
- 36.0/100
- National rank
- #4787
- State rank
- #321 of 539 in PA
Livability — Earl
No livability data for this city. (Only ~50 U.S. cities are tracked.)
Census & demographics
- Population (ZIP)
- 6,868
Population outlook (Lancaster County) Hauer SSP2
- Today (2025)
- 561,011 people
- By 2030
- 570,969 · +1.8%
- By 2040
- 585,929 · +4.4%
- By 2050
- 591,056 · +5.4%
- By 2075
- 594,747 · +6.0%
- By 2100
- 558,850 · -0.4%
Race, ethnicity, and origin ACS 2023
- Neighborhood character
- Predominantly White (94%)
- Race & ethnicity
- White 94% Two or more races 2% Hispanic / Latino 2%
- Common ancestry
- Iranian 3% Portuguese 2% Lithuanian 1%
- Foreign-born
- 5%
- Languages at home
- 77% English-only · German/W. Germanic 20% French/Haitian/Cajun 1% Spanish 1%
Political lean MEDSL · Lancaster
- 2024 margin
- R (+15.9) · D 41.5% · R 57.5%
- 2008→2024 swing
- -4.1pp toward R · 2008: -11.8pp · 2024: -15.9pp
- All cycles
- 2024: R+15.9 2020: R+15.8 2016: R+19.7 2012: R+19.2 2008: R+11.8
Not yet ingested
- Civics
- —
Market trends
- HPI YoY
- ▼ -36.32%
- Current HPI
- 265.1191
- Rent YoY
- —
- Metro
- —
- State GDP YoY
- ▲ 1.68%
- F500 in state
- 34
Industry mix (Fortune 500 HQ in PA)
| Industry | F500 HQs | Revenue |
|---|---|---|
| Healthcare | 2 | $309B |
|
||
| Insurance | 2 | $27B |
|
||
| Telecommunications / Media | 1 | $124B |
|
||
| Industrial Distribution | 1 | $22B |
|
||
| Financial Services | 1 | $20B |
|
||
| Chemicals / Materials | 1 | $18B |
|
||
Price history
+702.0% since first listed4 events — show timeline
- 2026-06-16 Listed $119,500 BRIGHT MLS
- 2003-02-14 Sold (MLS) $14,500 BRIGHT MLS
- 2002-07-29 Listing Removed — BRIGHT MLS
- 2002-07-29 Listed $14,900 BRIGHT MLS
Property tax history
+3.1%/yrLatest (2026): $561 · +3.7% YoY. Source: county tax records.
Cash-flow waterfall
monthlySold comps — $/sqft
last 12 mo · ≤1 miLoading sold comps…