 Duplex
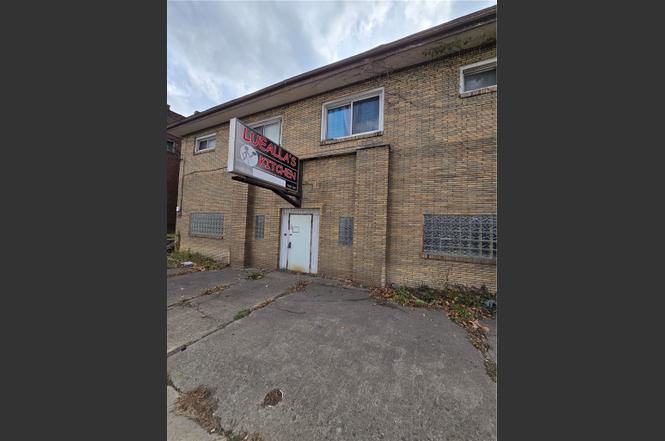
911 Duquesne Blvd · Duquesne, PA
Flood risk No data
- FEMA flood zone
- —
- Chance of flooding over 30 yrs
- —
- Est. flood insurance / yr
- —
Fire risk No data
- Est. fire insurance / yr
- —
Heat risk No data
- Hot days now (above threshold)
- —
- Hot days in 30 yrs
- —
Wind risk No data
- Chance of severe wind over 30 yrs
- —
Air-quality risk No data
- Unhealthy air days now
- —
- Unhealthy air days in 30 yrs
- —
Risk factors via First Street. Map © Google.
Why this score? — see what drove the B- grade
The composite is a weighted blend of 9 inputs, each scored 0–100. Each bar is that input's sub-score; the figure is the points it added to the 100-point composite (weight × sub-score).
- Cash flow +30.0/30.0
- 1% rule +10.0/10.0
- DSCR +10.0/10.0
- ARV discount +7.5/15.0
- Livability +3.4/5.0
- Rent growth +2.5/5.0
- Condition / age +2.5/5.0
- Appreciation +2.1/10.0
- Schools +1.3/10.0
$120,000
🖨 Deal sheet (PDF) 📄 Offer letter ✓ Due diligence
Multi-family units
County records classify this as Multi-Family (2-4 Unit). Listing-text estimate: 2 units. confirmed
Listing remarks
Welcome to this incredible multi-use investment opportunity. Featuring two residential units and one commercial kitchen unit downstairs, this property is ready for the right investor. Located next to Kennywood amusement park, there is shopping, residences, and public transit nearby that both business owners and residents will enjoy. Upstairs are two units, a 2/1 currently rented at $800 per month and a 1/1 currently rented at $700 per month. The 1600 square foot commercial space estimates a rent of $1500 per month, giving a gross monthly revenue of $3,000 per month. The upstairs units are fully equipped with new appliances, updated flooring, and fresh cosmetics throughout. The commercial un
Key facts
- Shopping nearby
- Updated flooring
- 6,098 sq ft lot
Tags
Neighborhood map
What this means for you Summary
Snapshot
- This is a 2 × 3-bed/1.5-bath units multifamily listed at $120k.
Deal economics
- At list price, monthly cash flow is $1k ($16k/yr) — positive. Per door: $685/mo.
- The deal already cash-flows at list — no discount required.
- Meets the 1% rule at list price ($3k rent vs $120k).
- Recommended offer: $116k (3.0% below list) — sets the bar for market timing.
Location & tenants
- Location reads 68/100 on livability (#927 in PA) — a middle-class / working-renter tenant base. Strengths: commute A+, cost of living A+, housing A+; Watch: health & safety D+, schools F, crime F.
- Duquesne City SD (suburban): math 10% / reading 15% proficiency, ranked #611 of 658 in PA (top 93%) — low school quality limits family demand, transient renter base, plan for 1-2y turnover; 97% free/reduced lunch — lower-income household profile, screen leases tightly.
- Market conditions: 19 active listings in the ZIP; 3 comparable units currently listed for rent nearby; rentals at typical pace (median 20d on market — plan ~3-4 weeks tenant-placement turnaround); 2,996 units permitted in Allegheny County in 2024 (1,588 in 5+ unit buildings).
Forward outlook
- Local home prices are declining (-3.0%/yr); year-one equity from $830 of loan paydown is wiped out by about $4k of value loss. Plan a longer hold.
- At projected returns (-3.0% appreciation + 3.0% rent growth), your $34k cash investment doubles in ~3 years — after that, you're playing with house money.
Negotiation context
- It's been on market 31 days — a 3% lower offer ($116k) is reasonable based on typical stale-listing flexibility.
- 3 sale attempts; this cycle's ask is 9% above the opening price — seller raised mid-cycle; expect resistance to lowballs.
Risks & watch-outs
- Watch-outs: built in 1900 — expect roof / HVAC / electrical / plumbing capex.
Questions for the listing agent
- It's been on market 31 days. Have you received any prior offers? Is the seller open to a 3% concession, seller financing, or rate buy-down credit?
- Can we see the unit-by-unit rent roll, current vacancy, and any below-market leases? What's the average tenancy length?
- What capital expenditures (roof, boiler, parking lot, exteriors) have been made in the last 5 years, and what's planned in the next 2?
- Built in 1900 — when were the roof, HVAC, electrical panel, plumbing, and water heater last replaced?
- Is there a deadline driving the sale (1031 exchange, divorce, estate, relocation)? That informs how much negotiation room exists.
- Schools are F-rated, which usually means shorter tenancies and higher turnover. Who's the typical renter profile here, and what's been the actual vacancy rate?
- Crime grade is F in this area — have there been break-ins, vandalism, or insurance claims at this property in the last 3 years? What carrier currently insures it and at what premium?
- What's the average days-on-market for RENTAL listings here right now (not sales)? A rising rental-DOM trend means longer vacancies and softer asking-rent achievability than the comps imply.
- What's the recent tenant-quality profile in this submarket — average credit score on applications, eviction rate, late-payment / NSF rate, and stable-employment percentage? A property-management company in the area should have these aggregated.
- How much new apartment / multifamily construction is in the pipeline within 1–3 miles? Heavy new supply (>2% of stock underway) typically softens rents 12–24 months out; light construction supports rent growth.
Investment metrics
- 1% rule
- 2.32% ✓
- Cap rate
- 19.99%
- Cash-on-cash
- 48.93%
- DSCR
- 3.18
- GRM
- 3.6
CMA / ARV
No comps found within radius.
Projected returns pro-forma
-3.0% appreciation · 3.0% rent growth · sell at horizon
- IRR
- 46.5%
- Equity multiple
- 3.02×
- Total profit
- $67,857
- Equity at exit
- $17,892
- IRR
- 52.3%
- Equity multiple
- 6.11×
- Total profit
- $171,621
- Equity at exit
- $10,375
Cash invested: $33,600 (down + closing). Projections, not guarantees.
Landlord ↔ Tenant lean methodology
- Overall (STATE)
- 62 Landlord-Friendly
- State Pennsylvania
- 62 Landlord-Friendly · EVEN
- County
- — inherits STATE
- City
- — inherits STATE
ZIP-level market 15110
- Home prices YoY
- -4.0%
- Active inventory
- 19
- Price-to-rent
- 7.2×
Monthly cashflow live
- Estimated rent
- $2,784 high interval (Pro) →
- Mortgage (P&I)
- −$629
- Tax est. 1.5%
- −$150 /mo · $1,800/yr
- Insurance
- −$50
- HOA
- −$0
- Vacancy / Maint / Mgmt
- −$585
- Net cashflow
- $1,370
Break-even live
Sensitivity live
| Price | -10% $1,453 | -5% $1,412 | +0% $1,370 | +5% $1,329 | +10% $1,287 |
|---|---|---|---|---|---|
| Rent | -10% $1,150 | -5% $1,260 | +0% $1,370 | +5% $1,480 | +10% $1,590 |
| Rate | -1.0pp $1,430 | -0.5pp $1,401 | base $1,370 | +0.5pp $1,339 | +1.0pp $1,307 |
2-unit breakdown (identical units grouped — click to expand)
| Units | Beds | Baths | Est. rent |
|---|---|---|---|
| 2× units | 3 | 1.5 | $2,784 |
| #1 | 3 | 1.5 | $1,392 |
| #2 | 3 | 1.5 | $1,392 |
| Total (2 units) | $2,784 | ||
UW: 25.0% down · 7.5% · 30yr · 1.5% tax · 5.0% vac · 8.0% maint · 8.0% mgmt
Financing live
Cash to close
- Down payment
- $30,000
- Closing costs
- $3,600
- Reserves months
- —
- Total cash needed
- —
Loan-product check · same deal, 3 products live
Conventional
25% down · 7.5% · 30yr
- Down + closing
- —
- Monthly P&I
- —
- Monthly cashflow
- —
- DSCR
- —
- Eligible?
- —
Personal DTI + credit; lowest rate.
DSCR
20% down · 8.5% · 30yr
- Down + closing
- —
- Monthly P&I
- —
- Monthly cashflow
- —
- DSCR
- —
- Eligible?
- —
No personal income docs; deal must DSCR.
Hard money
10% down · 12.0% · 12mo
- Down + closing
- —
- Monthly P&I
- —
- Monthly cashflow
- —
- DSCR
- —
- Eligible?
- —
Short-term bridge; refi at stabilization.
Rent comps 3 comps
| Address | Beds | Baths | Sqft | Rent | $/sqft | DOM | Units | Dist |
|---|---|---|---|---|---|---|---|---|
| 521 Bessemer Ave East Pittsburgh, PA | 5.0 | 1.0 | 1704 | $1,349 | $0.79 | 24d | 1 | 1.25mi |
| 504 Center St Unit 1546027P East Pittsburgh, PA | 5.0 | 2.0 | 1991 | $3,742 | $1.88 | 15d | 1 | 1.25mi |
| 504 Center St Unit 1385745P East Pittsburgh, PA | 5.0 | 2.0 | — | $4,821 | — | 20d | 1 | 1.25mi |
Listing history 7 events
-
2026-03-28status Pending
-
2026-03-08status Active
-
2026-03-03status Pending
-
2026-03-01status Active
-
2026-03-01price $120,000
-
2025-12-11status Pending
-
2025-12-03$110,000 Active
ⓘ Source: listings_history table (triggers on properties + properties_extension) + one-shot
backfill from property_details.listing_events for pre-trigger history.
Nearby sold comps map
Loading sold comps map…
Walkable amenities ~0.75 mi
Loading nearby amenities…
Taxation est. · year 1
- Rental income
- $33,408
- − Mortgage interest
- −$6,722
- − Property taxes
- −$1,800
- − Insurance
- −$600
- − Repairs & maintenance
- −$2,673
- − Management
- −$2,673
- − Depreciation
- −$3,491
- Taxable income
- $15,450
- Est. tax owed @ 24.0%
- −$3,708
- After-tax cash flow
- $12,733/yr
For passive investors: Depreciation is non-cash, so a rental often shows a tax loss while cash-flowing — sheltering income. Rental losses are passive: they offset passive income freely, and up to $25,000/yr can offset ordinary (W-2) income if you actively participate and your MAGI is under $100k (phasing out to $0 by $150k); unused losses carry forward. On sale, claimed depreciation is recaptured at up to 25%, and gains may owe capital-gains tax (a 1031 exchange can defer both). Figures are a year-1 estimate at your 24.0% rate — not tax advice; consult a CPA.
Schools (NCES district)
- District
- Duquesne City SD
- NCES district ID
- 4208010
- Math proficiency
- 10% ▲ 4.00%
- Reading proficiency
- 15% ▬ 0.00%
- Median HH income
- $24,173
- Composite
- 12.77/100
- National rank
- #14546
- State rank
- #611 of 658 in PA
Livability — Duquesne
- Score
- 68/100
- State rank
- #927
- US rank
- #10089
Category grades
Schools grade is shown separately in the Schools card above.
Census & demographics
- Census place
- Duquesne, PA
- City population
- 5,186
- Population (ZIP)
- 5,186
Population outlook (Allegheny County) Hauer SSP2
- Today (2025)
- 1,250,282 people
- By 2030
- 1,256,482 · +0.5%
- By 2040
- 1,256,318 · +0.5%
- By 2050
- 1,244,169 · -0.5%
- By 2075
- 1,197,693 · -4.2%
- By 2100
- 1,093,187 · -12.6%
Race, ethnicity, and origin ACS 2023
- Neighborhood character
- Diverse neighborhood (Simpson 0.67)
- Race & ethnicity
- Black 44% White 37% Two or more races 16% Hispanic / Latino 3%
- Common ancestry
- Romanian 3% Lithuanian 2% Slovene 1%
- Foreign-born
- 1% · Canada
- Languages at home
- 96% English-only · Spanish 3%
Political lean MEDSL · Allegheny
- 2024 margin
- Strong D (+20.3) · D 59.7% · R 39.4%
- 2008→2024 swing
- +4.8pp toward D · 2008: 15.5pp · 2024: 20.3pp
- All cycles
- 2024: D+20.3 2020: D+20.4 2016: D+16.4 2012: D+14.4 2008: D+15.5
Not yet ingested
- Civics
- —
Market trends
- HPI YoY
- ▼ -5.75%
- Current HPI
- 138.4974
- Rent YoY
- —
- Metro
- —
- State GDP YoY
- ▲ 1.68%
- F500 in state
- 34
Industry mix (Fortune 500 HQ in PA)
| Industry | F500 HQs | Revenue |
|---|---|---|
| Healthcare | 2 | $309B |
|
||
| Insurance | 2 | $27B |
|
||
| Telecommunications / Media | 1 | $124B |
|
||
| Industrial Distribution | 1 | $22B |
|
||
| Financial Services | 1 | $20B |
|
||
| Chemicals / Materials | 1 | $18B |
|
||
Price history
+9.1% since first listed7 events — show timeline
- 2026-03-28 Pending — West Penn MLS
- 2026-03-08 Relisted — West Penn MLS
- 2026-03-03 Pending — West Penn MLS
- 2026-03-01 Relisted — West Penn MLS
- 2026-03-01 Price Changed $120,000 West Penn MLS
- 2025-12-11 Pending — West Penn MLS
- 2025-12-03 Listed $110,000 West Penn MLS
Cash-flow waterfall
monthlySold comps — $/sqft
last 12 mo · ≤1 miLoading sold comps…