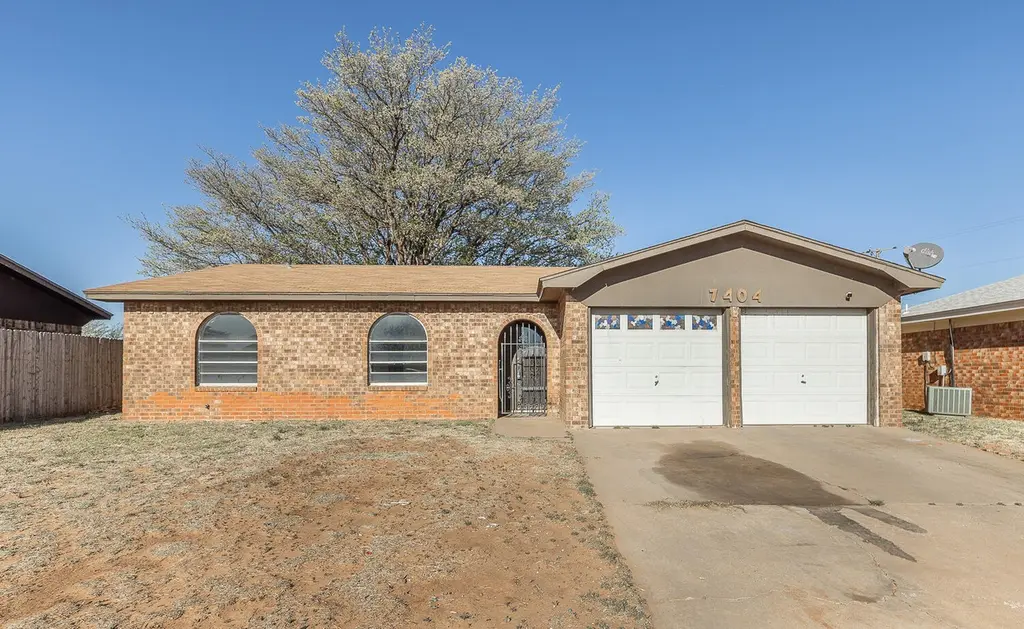
7404 Fir Ave · Lubbock, TX
Flood risk 1/10 · Minimal
- FEMA flood zone
- X (unshaded)
- Chance of flooding over 30 yrs
- 0.0%
- Est. flood insurance / yr
- $507 – $1,088
Fire risk 4/10 · Minor
- Est. fire insurance / yr
- $1,222 – $2,270
Heat risk 5/10 · Moderate
- Hot days now (above 100°F)
- 7 days/yr
- Hot days in 30 yrs
- 21 days/yr
Wind risk 2/10 · Minimal
- Chance of severe wind over 30 yrs
- —
Air-quality risk 1/10 · Minimal
- Unhealthy air days now
- 0 days/yr
- Unhealthy air days in 30 yrs
- 0 days/yr
Risk factors via First Street. Map © Google.
Why this score? — see what drove the C- grade
The composite is a weighted blend of 9 inputs, each scored 0–100. Each bar is that input's sub-score; the figure is the points it added to the 100-point composite (weight × sub-score).
- Cash flow +20.0/30.0
- Appreciation +6.6/10.0
- DSCR +6.3/10.0
- 1% rule +5.8/10.0
- Livability +4.0/5.0
- ARV discount +3.1/15.0
- Schools +3.1/10.0
- Rent growth +2.5/5.0
- Condition / age +2.5/5.0
$140,000
🖨 Deal sheet 📄 Offer letter ✓ Due diligence
Listing remarks MLS
Cute 3/2/2 on cul-de-sac street! Lots of storage, very nice patio with a metal cover, large backyard with a storage building. One block from a nice park! Easy to show! Easy access to I-27 and Loop 289.
Key facts
- 7,680 sq ft lot
- 2 garage spots
- Built 1981
Neighborhood map
What this means for you Summary
Snapshot
- This is a 3-bed/2.0-bath single-family listed at $140k.
Deal economics
- At list price, monthly cash flow is $171 ($2k/yr) — positive.
- The deal already cash-flows at list — no discount required.
- Meets the 1% rule at list price ($2k rent vs $140k).
- Recommended offer: $132k (6.0% below list) — sets the bar for market timing.
Location & tenants
- Location reads 80/100 on livability (#37 in TX, #1,749 nationally) — a professional / high-income tenant draw. Strengths: commute A+, cost of living A+, housing A+; Watch: employment C-, schools D+, crime F.
- Lubbock ISD (urban): math 36% / reading 39% proficiency, ranked #481 of 826 in TX (top 58%) — families likely to look elsewhere, expect single-tenant / working-renter base with shorter leases; 60% free/reduced lunch — lower-income household profile, screen leases tightly.
- Market conditions: 91 active listings in the ZIP; 33 comparable units currently listed for rent nearby; rentals at typical pace (median 21d on market — plan ~3-4 weeks tenant-placement turnaround); 48% of comp listings sitting > 30 days — soft ceiling on asking rent; 2,219 units permitted in Lubbock County in 2024 (252 in 5+ unit buildings).
- This rent runs 35% of the median local income ($52k/yr) — at the standard rent-burdened threshold; future hikes will face affordability resistance.
Forward outlook
- In year one you build about $5k of equity ($968 loan paydown + $5k appreciation (3.2% local appreciation)).
- Lubbock County population projected at +39% by 2050 — long-run rental-demand tailwind backs the buy-and-hold thesis.
- At projected returns (3.2% appreciation + 3.0% rent growth), your $39k cash investment doubles in ~5 years — after that, you're playing with house money.
- By year 7, paydown + projected appreciation supports a ~$35k cash-out refi (75% LTV) — recoverable capital for the next deal without selling this one.
Negotiation context
- It's been on market 83 days — a 6% lower offer ($132k) is reasonable based on typical stale-listing flexibility.
- 8 sale attempts since 9y ago; this cycle's ask has dropped $8k (5%) from the opening price — seller is motivated, your offer sets the floor, not the list.
Risks & watch-outs
- Climate carrying-cost: extreme-heat days projected 7→21/yr by 2055 (HVAC capex compounding) — expect insurance premiums to compound above CPI over the hold.
Questions for the listing agent
- It's been on market 83 days. Have you received any prior offers? Is the seller open to a 6% concession, seller financing, or rate buy-down credit?
- Why hasn't it sold? Are there any deal-killer items the seller is aware of (foundation, flood, title, zoning, code violations)?
- Is there a deadline driving the sale (1031 exchange, divorce, estate, relocation)? That informs how much negotiation room exists.
- Schools are D-rated, which usually means shorter tenancies and higher turnover. Who's the typical renter profile here, and what's been the actual vacancy rate?
- Crime grade is F in this area — have there been break-ins, vandalism, or insurance claims at this property in the last 3 years? What carrier currently insures it and at what premium?
- What's the average days-on-market for RENTAL listings here right now (not sales)? A rising rental-DOM trend means longer vacancies and softer asking-rent achievability than the comps imply.
- What's the recent tenant-quality profile in this submarket — average credit score on applications, eviction rate, late-payment / NSF rate, and stable-employment percentage? A property-management company in the area should have these aggregated.
- How much new for-sale + rental construction is in the pipeline within 1–3 miles? Heavy new supply typically softens prices + rents 12–24 months out; constrained supply supports both.
Investment metrics
- 1% rule
- 1.08% ✓
- Cap rate
- 7.76%
- Cash-on-cash
- 5.24%
- DSCR
- 1.23
- GRM
- 7.7
CMA / ARV
- ARV (median comp)
- $127,633
- List price
- $140,000
- Delta
- 9.69%
- Verdict
- FAIR
- Comps
- 5 within 2.0 mi
Show comp detail 1 sale within ~0.75 mi
| Address | Dist | Beds/Ba | Sqft | Sold | Price | $/sf | Match |
|---|---|---|---|---|---|---|---|
| 707 77th St | 0.72mi | 3/1.0 | 1,394 (+6%) | 18mo | $137,464 | $99 | 37 |
Match score weights: distance 35% · size 25% · config 20% · recency 20%. Top-matched comps best support the ARV.
Projected returns pro-forma
3.22% appreciation · 3.0% rent growth · sell at horizon
- IRR
- 13.0%
- Equity multiple
- 1.75×
- Total profit
- $29,496
- Equity at exit
- $64,719
- IRR
- 14.8%
- Equity multiple
- 3.24×
- Total profit
- $87,778
- Equity at exit
- $101,136
Cash invested: $39,200 (down + closing). Projections, not guarantees.
Landlord ↔ Tenant lean methodology
- Overall (STATE)
- 87 Strongly Landlord-Friendly
- State Texas
- 87 Strongly Landlord-Friendly · R+5
- County
- — inherits STATE
- City
- — inherits STATE
ZIP-level market 79404
- Home prices YoY
- 2.0%
- Active inventory
- 91
- Price-to-rent
- 7.7×
Monthly cashflow live
- Estimated rent
- $1,518 high interval (Pro) →
- Mortgage (P&I)
- −$734
- Tax from tax record
- −$235 /mo · $2,825/yr
- Insurance
- −$58
- HOA
- −$0
- Vacancy / Maint / Mgmt
- −$319
- Net cashflow
- $171
Break-even live
UW: 25.0% down · 7.5% · 30yr · 1.5% tax · 5.0% vac · 8.0% maint · 8.0% mgmt
Financing live
Cash to close
- Down payment
- $35,000
- Closing costs
- $4,200
- Reserves months
- —
- Total cash needed
- —
Loan-product check · same deal, 3 products live
Conventional
25% down · 7.5% · 30yr
- Down + closing
- —
- Monthly P&I
- —
- Monthly cashflow
- —
- DSCR
- —
- Eligible?
- —
Personal DTI + credit; lowest rate.
DSCR
20% down · 8.5% · 30yr
- Down + closing
- —
- Monthly P&I
- —
- Monthly cashflow
- —
- DSCR
- —
- Eligible?
- —
No personal income docs; deal must DSCR.
Hard money
10% down · 12.0% · 12mo
- Down + closing
- —
- Monthly P&I
- —
- Monthly cashflow
- —
- DSCR
- —
- Eligible?
- —
Short-term bridge; refi at stabilization.
Rent comps 33 comps
| Address | Beds | Baths | Sqft | Rent | $/sqft | DOM | Units | Dist |
|---|---|---|---|---|---|---|---|---|
| 320 E 76th St Lubbock, TX | 3.0 | 2.0 | 1310 | $1,599 | $1.22 | 13d | 1 | 0.15mi |
| 312 E 76th St Lubbock, TX | 3.0 | 2.0 | 1430 | $1,599 | $1.12 | 13d | 1 | 0.17mi |
| 7702 Elm Ave Lubbock, TX | 3.0 | 2.0 | 1470 | $1,600 | $1.09 | 13d | 1 | 0.19mi |
| 7704 Elm Ave Lubbock, TX | 3.0 | 2.0 | 1310 | $1,599 | $1.22 | 13d | 1 | 0.20mi |
| 312 E 77th St Lubbock, TX | 3.0 | 2.0 | 1310 | $1,619 | $1.24 | 43d | 1 | 0.21mi |
| 7715 Date Ave Lubbock, TX | 3.0 | 2.0 | 1430 | $1,599 | $1.12 | 21d | 1 | 0.25mi |
| 7717 Date Ave Lubbock, TX | 3.0 | 2.0 | 1430 | $1,899 | $1.33 | 13d | 1 | 0.26mi |
| 7723 Date Ave Lubbock, TX | 3.0 | 2.0 | 1310 | $1,599 | $1.22 | 21d | 1 | 0.28mi |
| 8011 Date Ave Lubbock, TX | 3.0 | 2.0 | 1310 | $1,599 | $1.22 | 21d | 1 | 0.40mi |
| 8015 Date Ave Lubbock, TX | 3.0 | 2.0 | 1310 | $1,599 | $1.22 | 21d | 1 | 0.42mi |
| 8017 Date Ave Lubbock, TX | 3.0 | 2.0 | 1382 | $1,599 | $1.16 | 13d | 1 | 0.43mi |
| 8030 Elm Ave Lubbock, TX | 3.0 | 2.0 | 1310 | $1,599 | $1.22 | 13d | 1 | 0.47mi |
| 110 E 82nd St Unit 2 Lubbock, TX | 3.0 | 2.0 | 1113 | $1,150 | $1.03 | 43d | 1 | 0.58mi |
| 914 82nd St Unit B Lubbock, TX | 2.0 | 1.0 | 932 | $900 | $0.97 | 43d | 1 | 0.99mi |
| 1106 82nd St Unit B Lubbock, TX | 3.0 | 2.0 | 1243 | $950 | $0.76 | 43d | 1 | 1.05mi |
| 1108 82nd St Unit A Lubbock, TX | 3.0 | 2.0 | 1243 | $950 | $0.76 | 43d | 1 | 1.05mi |
| 1113 80th St Unit A Lubbock, TX | 3.0 | 2.0 | 1443 | $1,250 | $0.87 | 43d | 1 | 1.06mi |
| 1112 82nd St Unit B Lubbock, TX | 3.0 | 2.0 | 1243 | $950 | $0.76 | 43d | 1 | 1.07mi |
| 1115 80th St Unit A Lubbock, TX | 3.0 | 2.0 | 1443 | $1,250 | $0.87 | 43d | 1 | 1.08mi |
| 1116 82nd St Unit B Lubbock, TX | 3.0 | 2.0 | 1243 | $950 | $0.76 | 43d | 1 | 1.09mi |
| 1118 82nd St Unit A Lubbock, TX | 3.0 | 2.0 | 1243 | $950 | $0.76 | 43d | 1 | 1.10mi |
| 5614 Avenue A Unit A Lubbock, TX | 3.0 | 1.0 | 1129 | $695 | $0.62 | 21d | 1 | 1.15mi |
| 1508 82nd St Unit A Lubbock, TX | 2.0 | 1.0 | 960 | $750 | $0.78 | 43d | 1 | 1.27mi |
| 1512 82nd St Unit B Lubbock, TX | 2.0 | 1.0 | 900 | $750 | $0.83 | 21d | 1 | 1.29mi |
| 1307 61st St Lubbock, TX | 3.0 | 1.0 | 1073 | $1,150 | $1.07 | 13d | 1 | 1.33mi |
| 5512 Avenue G Unit G Lubbock, TX | 3.0 | 1.0 | 1117 | $1,000 | $0.90 | 43d | 1 | 1.34mi |
| 1341 65th Dr Unit C Lubbock, TX | 2.0 | 1.5 | 1000 | $695 | $0.69 | 21d | 1 | 1.35mi |
| 313 52nd St Lubbock, TX | 4.0 | 1.0 | 1044 | $975 | $0.93 | 21d | 1 | 1.42mi |
| 6130 Avenue P Lubbock, TX | 4.0 | 2.0 | 1387 | $1,100 | $0.79 | 43d | 1 | 1.44mi |
| 1625 79th Pl Lubbock, TX | 3.0 | 2.0 | 1541 | $1,650 | $1.07 | 44d | 1 | 1.44mi |
| 7006 Avenue S Lubbock, TX | 4.0 | 2.0 | 1498 | $1,800 | $1.20 | 43d | 1 | 1.46mi |
| 1606 82nd St Lubbock, TX | 1.0–2.0 | 1.0–2.0 | 843 | $1,580 | $1.87 | 13d | 16 | 1.46mi |
| 1805 79th Pl Lubbock, TX | 3.0 | 2.0 | 1284 | $1,375 | $1.07 | 43d | 1 | 1.48mi |
Listing history 36 events
-
2026-06-18days on market $140,000 Active 83 DOM
-
2026-06-17days on market $140,000 Active 82 DOM
-
2026-06-16days on market $140,000 Active 81 DOM
-
2026-06-15price $140,000 Active 80 DOM
-
2026-06-15days on market $142,500 Active 80 DOM
-
2026-06-14days on market $142,500 Active 78 DOM
-
2026-06-13days on market $142,500 Active 77 DOM
-
2026-06-10days on market $142,500 Active 75 DOM
-
2026-06-09days on market $142,500 Active 74 DOM
-
2026-06-08days on market $142,500 Active 73 DOM
-
2026-06-07days on market $142,500 Active 72 DOM
-
2026-06-05days on market $142,500 Active 69 DOM
-
2026-06-03days on market $142,500 Active 68 DOM
-
2026-06-02days on market $142,500 Active 67 DOM
-
2026-06-01days on market $142,500 Active 66 DOM
-
2026-05-31days on market $142,500 Active 65 DOM
-
2026-05-30days on market $142,500 Active 64 DOM
-
2026-05-08price $142,500 203-char remark
Show marketing remark (203 chars)
Cute 3/2/2 on cul-de-sac street! Lots of storage, very nice patio with a metal cover, large backyard with a storage building. One block from a nice park! Easy to show! Easy access to I-27 and Loop 289.
-
2026-03-27$147,500 Active 203-char remark
Show marketing remark (203 chars)
Cute 3/2/2 on cul-de-sac street! Lots of storage, very nice patio with a metal cover, large backyard with a storage building. One block from a nice park! Easy to show! Easy access to I-27 and Loop 289.
-
2026-03-26historical $1,275
-
2026-03-24$1,275
-
2026-03-23historical $1,325
-
2026-03-11$1,325
-
2026-03-11historical $1,325
-
2026-01-10price $1,325
-
2026-01-09$1,275
-
2025-03-08historical $1,275
-
2025-02-20$1,275
-
2025-02-13historical $1,275
-
2025-01-31$1,275
-
2023-11-14historical $1,275
-
2023-10-04$1,275
-
2022-04-22soldstatus
-
2017-08-31soldstatus
-
2017-08-30soldstatus 232-char remark
Show marketing remark (232 chars)
Cute 3/2/2 on cul-de-sac street! New interior/exterior paint. central heat/air. Fireplace. Lots of storage. Very nice patio with metal covering. Storage house. One block from nice park! Easy to show! Easy access to I27 and Loop 289.
-
2017-07-13$82,000 232-char remark
Show marketing remark (232 chars)
Cute 3/2/2 on cul-de-sac street! New interior/exterior paint. central heat/air. Fireplace. Lots of storage. Very nice patio with metal covering. Storage house. One block from nice park! Easy to show! Easy access to I27 and Loop 289.
ⓘ Source: listings_history table (triggers on properties + properties_extension) + one-shot
backfill from property_details.listing_events for pre-trigger history.
Tax reassessment forecast TX · Resets to sale price
- Current annual tax
- $2,825 · $235/mo
- Projected year-2 tax
- $2,825 · $235/mo
- Expected delta
- $0/yr ($0/mo · 0.0%)
ⓘ Screening estimate from a state-policy table — verify with the county assessor before closing.
Climate risk First Street
- Flood 1/10 Low FEMA zone X (unshaded) · 0% chance over 30 yrs
- Wildfire 4/10 Moderate
- Heat 5/10 Major 7 d/yr ≥100°F today · 21 d/yr by 30 yrs out
- Wind 2/10 Low
- Air quality 1/10 Low 0 unhealthy d/yr today · 0 by 30 yrs out
Nearby sold comps map
Loading sold comps map…
Walkable amenities ~0.75 mi
Loading nearby amenities…
Taxation est. · year 1
- Rental income
- $18,216
- − Mortgage interest
- −$7,842
- − Property taxes
- −$2,825
- − Insurance
- −$700
- − Repairs & maintenance
- −$1,457
- − Management
- −$1,457
- − Depreciation
- −$4,073
- Taxable loss
- −$139
- Est. tax savings @ 24.0%
- +$33
- After-tax cash flow
- $2,089/yr
For passive investors: Depreciation is non-cash, so a rental often shows a tax loss while cash-flowing — sheltering income. Rental losses are passive: they offset passive income freely, and up to $25,000/yr can offset ordinary (W-2) income if you actively participate and your MAGI is under $100k (phasing out to $0 by $150k); unused losses carry forward. On sale, claimed depreciation is recaptured at up to 25%, and gains may owe capital-gains tax (a 1031 exchange can defer both). Figures are a year-1 estimate at your 24.0% rate — not tax advice; consult a CPA.
Schools (NCES district)
- District
- Lubbock ISD
- NCES district ID
- 4828500
- Math proficiency
- 36% ▼ -8.00%
- Reading proficiency
- 39% ▼ -1.00%
- Median HH income
- $39,820
- Composite
- 31.44/100
- National rank
- #5984
- State rank
- #481 of 826 in TX
Livability — Lubbock
- Score
- 80/100
- State rank
- #37
- US rank
- #1749
Category grades
Schools grade is shown separately in the Schools card above.
Census & demographics
- Census place
- Lubbock, TX
- County
- Lubbock County · 293,542 people
- City population
- 283,030
- Metro
- Lubbock, TX
- Population (ZIP)
- 8,529
- Household income
- $51,630
- Rent vs Own
- Severe rent burden
- 366.0
Population outlook (Lubbock County) Hauer SSP2
- Today (2025)
- 345,960 people
- By 2030
- 371,449 · +7.4%
- By 2040
- 424,539 · +22.7%
- By 2050
- 481,150 · +39.1%
- By 2075
- 633,467 · +83.1%
- By 2100
- 746,853 · +115.9%
Race, ethnicity, and origin ACS 2023
- Neighborhood character
- Diverse neighborhood (Simpson 0.60)
- Race & ethnicity
- Hispanic / Latino 55% Black 22% White 20% Two or more races 17% Native American 2%
- Hispanic origin (detail)
- Mexican 46%
- Common ancestry
- Romanian 1% Lithuanian 0%
- Foreign-born
- 5% · Canada
- Languages at home
- 64% English-only · Spanish 36%
Political lean MEDSL · Lubbock
- 2024 margin
- Solid R (+39.5) · D 29.7% · R 69.2% · Other 1.0%
- 2008→2024 swing
- -2.8pp toward R · 2008: -36.7pp · 2024: -39.5pp
- All cycles
- 2024: R+39.5 2020: R+32.2 2016: R+38.4 2012: R+40.9 2008: R+36.7
Not yet ingested
- Civics
- —
Market trends
- HPI YoY
- ▲ 3.22%
- Current HPI
- 163.854
- Rent YoY
- —
- Metro
- Lubbock, TX
- State GDP YoY
- ▲ 3.95%
- F500 in state
- 110
Industry mix (Fortune 500 HQ in TX)
| Industry | F500 HQs | Revenue |
|---|---|---|
| Energy | 16 | $1,198B |
|
||
| Technology | 5 | $198B |
|
||
| Engineering / Construction | 4 | $72B |
|
||
| Energy Services | 3 | $60B |
|
||
| Utilities | 3 | $41B |
|
||
| Healthcare | 2 | $330B |
|
||
Price history
+73.8% since first listed19 events — show timeline
- 2026-05-08 Price Changed $142,500 LARMLS
- 2026-03-27 Listed $147,500 LARMLS
- 2026-03-26 Rental Removed $1,275 TENANTTURNER2
- 2026-03-24 Listed for Rent $1,275 TENANTTURNER2
- 2026-03-23 Rental Removed $1,325 LARMLS
- 2026-03-11 Listed for Rent $1,325 LARMLS
- 2026-03-11 Rental Removed $1,325 TENANTTURNER2
- 2026-01-10 Price Changed $1,325 TENANTTURNER2
- 2026-01-09 Listed for Rent $1,275 TENANTTURNER2
- 2025-03-08 Rental Removed $1,275 LARMLS
- 2025-02-20 Listed for Rent $1,275 LARMLS
- 2025-02-13 Rental Removed $1,275 LARMLS
- 2025-01-31 Listed for Rent $1,275 LARMLS
- 2023-11-14 Rental Removed $1,275 LARMLS
- 2023-10-04 Listed for Rent $1,275 LARMLS
- 2022-04-22 Sold (Public Records) — Public Records
- 2017-08-31 Sold (Public Records) — Public Records
- 2017-08-30 Sold (MLS) — LARMLS
- 2017-07-13 Listed $82,000 LARMLS
Property tax history
+6.5%/yrLatest (2025): $2,825 · -1.5% YoY. Source: county tax records.
Cash-flow waterfall
monthlySold comps — $/sqft
last 12 mo · ≤1 miLoading sold comps…