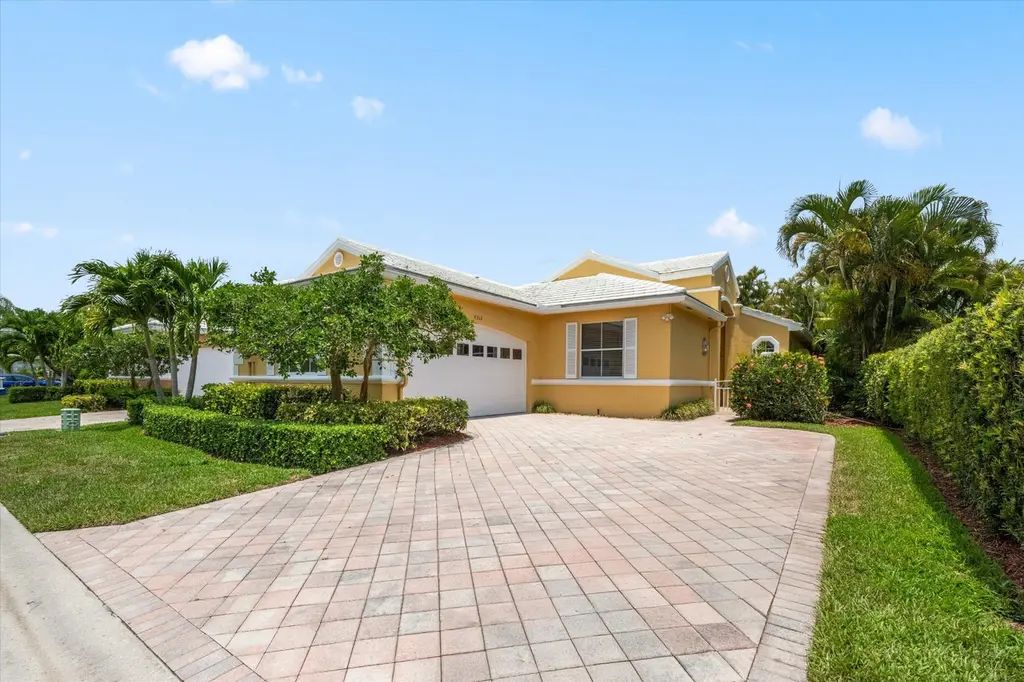
4362 Kensington Park Way · Wellington, FL
Flood risk 1/10 · Minimal
- FEMA flood zone
- X (unshaded)
- Chance of flooding over 30 yrs
- 0.0%
- Est. flood insurance / yr
- $507 – $1,088
Fire risk 1/10 · Minimal
- Est. fire insurance / yr
- $947 – $1,759
Heat risk 9/10 · Severe
- Hot days now (above 106°F)
- 7 days/yr
- Hot days in 30 yrs
- 25 days/yr
Wind risk 10/10 · Severe
- Chance of severe wind over 30 yrs
- 99.0%
Air-quality risk 2/10 · Minimal
- Unhealthy air days now
- 0 days/yr
- Unhealthy air days in 30 yrs
- 2 days/yr
Risk factors via First Street. Map © Google.
Why this score? — see what drove the C grade
The composite is a weighted blend of 9 inputs, each scored 0–100. Each bar is that input's sub-score; the figure is the points it added to the 100-point composite (weight × sub-score).
- Cash flow +16.1/30.0
- 1% rule +9.7/10.0
- ARV discount +7.5/15.0
- DSCR +5.0/10.0
- Appreciation +4.7/10.0
- Schools +4.3/10.0
- Livability +3.7/5.0
- Rent growth +2.5/5.0
- Condition / age +2.5/5.0
$299,000
🖨 Deal sheet 📄 Offer letter ✓ Due diligence
Listing remarks
Fantastic opportunity to enjoy the Wycliffe lifestyle in this freshly updated residence featuring new interior paint and new carpet. The well-designed layout offers comfortable living with a private screened-in patio, perfect for relaxing or entertaining. Experience all that Wycliffe Golf & Country Club has to offer. This home is located within Wycliffe Golf & Country Club, a private country club community offering an exceptional lifestyle and an impressive array of amenities. Residents enjoy access to two championship 18-hole golf courses, a recently completed $18+ million clubhouse renovation, multiple on-site dining venues, a full-service spa, a state-of-the-art fitness cente
Key facts
- 5,634 sq ft lot
- 2 garage spots
- Built 1993
Property features AI
Finance
- Financial info: Pets allowed with restrictions and potential number limits
- HOA & community: Homeowner association present (GRS and Wycliffe); Association amenities include clubhouse, fitness center, golf course, tennis courts, bocce ball, pickleball courts, putting green, sidewalks, community room, business center, cafe/restaurant, library, management, manager on site, elevator(s); Primary association dues billed monthly; additional association with quarterly fees
Exterior
- Parking: Attached 2-car garage with garage door opener; 2 covered parking spaces (total 2 parking spaces)
- Utilities: Public water; Public sewer; Cable available; Water and sewer available
- Home design: Single family residence; One story; Resale property; Faces south
- Construction: CBS construction; Tile roof; Building area reported as 2,828 total; living area reported as 2,192; Built (resale — year not provided)
- Exterior features: Private maintained road; Not waterfront
Interior
- Kitchen: Dishwasher; Electric range; Refrigerator
- Bedrooms: 3 bedrooms on the main level
- Flooring: Carpet; Ceramic tile
- Bathrooms: 2 full bathrooms on the main level
- Heating & cooling: Central electric heating; Central air conditioning; Ceiling fans
- Interior features: Walk-in closets; Split bedroom layout; Unfurnished
- Laundry & utility: Laundry closet inside the home; Electric water heater
Neighborhood map
What this means for you Summary
Snapshot
- This is a 3-bed/2.0-bath single-family listed at $299k.
Deal economics
- At list price, monthly cash flow is $153 ($2k/yr) — positive.
- The deal already cash-flows at list — no discount required.
- Meets the 1% rule at list price ($4k rent vs $299k).
- Recommended offer: $290k (3.0% below list) — sets the bar for market timing.
- Cap rate 6.9% vs local median 3.4% in Wellington — top-decile yield for the area; either an underpriced asset or a hidden risk that comps aren't pricing in. Stress-test before assuming the spread holds.
Location & tenants
- Location reads 73/100 on livability (#294 in FL, #4,986 nationally) — a middle-class / working-renter tenant base. Strengths: crime A+, employment A+, housing A+; Watch: amenities F, commute F, cost of living F.
- Palm Beach (suburban): math 46% / reading 53% proficiency, ranked #34 of 73 in FL (top 47%) — families likely to look elsewhere, expect single-tenant / working-renter base with shorter leases.
- Zoned schools: Panther Run Elementary School (math 85% / reading 82%, grade A+, #60 of 2,144 statewide, top 3%, 787 students, 19% FRL); Polo Park Middle School (math 65% / reading 68%, grade A-, #84 of 571 statewide, top 16%, 1,156 students, 33% FRL); Palm Beach Central High School (math 42% / reading 55%, grade D, #198 of 667 statewide, top 30%, 2,980 students, 40% FRL) — zoned schools average 31% FRL vs 52% district-wide (21 pts lower); this property's tenant base skews higher-income than the district average.
- Zoned-school proficiency averages 66% at this address vs 50% district-wide (+17 pts) — the actual schools serving this property are materially stronger than the Palm Beach average implies; a family-tenant draw the district grade alone would hide.
- Market conditions: 168 active listings in the ZIP; 32 comparable units currently listed for rent nearby; rentals at typical pace (median 25d on market — plan ~3-4 weeks tenant-placement turnaround); 3,974 units permitted in Palm Beach County in 2024 (1,012 in 5+ unit buildings).
Forward outlook
- In year one you build about $49 of equity ($2k loan paydown + $-2k appreciation (-0.7% local appreciation)).
- Palm Beach County population projected at +30% by 2050 — long-run rental-demand tailwind backs the buy-and-hold thesis.
Negotiation context
- It's been on market 45 days — a 3% lower offer ($290k) is reasonable based on typical stale-listing flexibility.
- 5 sale attempts since 2y ago; this cycle's ask is 11% above the opening price — seller raised mid-cycle; expect resistance to lowballs.
- Current owner paid $210k; 42% above their basis — modest negotiation headroom, anchor on the comps not their cost.
Risks & watch-outs
- Watch-outs: HOA is 25% of rent.
- Climate carrying-cost: severe wind risk, 99% chance of damaging wind over 30y; extreme-heat days projected 7→25/yr by 2055 (HVAC capex compounding) — expect insurance premiums to compound above CPI over the hold.
Questions for the listing agent
- It's been on market 45 days. Have you received any prior offers? Is the seller open to a 3% concession, seller financing, or rate buy-down credit?
- What does the HOA fee cover, when was the last increase, and are there any pending special assessments or reserve-fund shortfalls?
- Is there a deadline driving the sale (1031 exchange, divorce, estate, relocation)? That informs how much negotiation room exists.
- Schools are A-rated — typically a magnet for longer-tenancy family renters. What's the average tenant stay here, and is there a school-zone premium baked into asking?
- What's the average days-on-market for RENTAL listings here right now (not sales)? A rising rental-DOM trend means longer vacancies and softer asking-rent achievability than the comps imply.
- What's the recent tenant-quality profile in this submarket — average credit score on applications, eviction rate, late-payment / NSF rate, and stable-employment percentage? A property-management company in the area should have these aggregated.
- How much new for-sale + rental construction is in the pipeline within 1–3 miles? Heavy new supply typically softens prices + rents 12–24 months out; constrained supply supports both.
Investment metrics
- 1% rule
- 1.47% ✓
- Cap rate
- 6.91%
- Cash-on-cash
- 2.19%
- DSCR
- 1.10
- GRM
- 5.7
CMA / ARV
No comps found within radius.
Projected returns pro-forma
-0.67% appreciation · 3.0% rent growth · sell at horizon
- IRR
- -2.0%
- Equity multiple
- 0.91×
- Total profit
- $-7,550
- Equity at exit
- $76,866
- IRR
- 4.6%
- Equity multiple
- 1.46×
- Total profit
- $38,315
- Equity at exit
- $84,785
Cash invested: $83,720 (down + closing). Projections, not guarantees.
Landlord ↔ Tenant lean methodology
- Overall (STATE)
- 87 Strongly Landlord-Friendly
- State Florida
- 87 Strongly Landlord-Friendly · R+3
- County
- — inherits STATE
- City
- — inherits STATE
ZIP-level market 33449
- Home prices YoY
- -0.2%
- Active inventory
- 168
- Price-to-rent
- 5.7×
Monthly cashflow live
- Estimated rent
- $4,401 high interval (Pro) →
- Mortgage (P&I)
- −$1,568
- Tax from tax record
- −$545 /mo · $6,539/yr
- Insurance
- −$125
- HOA
- −$1,087
- Vacancy / Maint / Mgmt
- −$924
- Net cashflow
- $153
Break-even live
UW: 25.0% down · 7.5% · 30yr · 1.5% tax · 5.0% vac · 8.0% maint · 8.0% mgmt
Financing live
Cash to close
- Down payment
- $74,750
- Closing costs
- $8,970
- Reserves months
- —
- Total cash needed
- —
Loan-product check · same deal, 3 products live
Conventional
25% down · 7.5% · 30yr
- Down + closing
- —
- Monthly P&I
- —
- Monthly cashflow
- —
- DSCR
- —
- Eligible?
- —
Personal DTI + credit; lowest rate.
DSCR
20% down · 8.5% · 30yr
- Down + closing
- —
- Monthly P&I
- —
- Monthly cashflow
- —
- DSCR
- —
- Eligible?
- —
No personal income docs; deal must DSCR.
Hard money
10% down · 12.0% · 12mo
- Down + closing
- —
- Monthly P&I
- —
- Monthly cashflow
- —
- DSCR
- —
- Eligible?
- —
Short-term bridge; refi at stabilization.
Rent comps 32 comps
| Address | Beds | Baths | Sqft | Rent | $/sqft | DOM | Units | Dist |
|---|---|---|---|---|---|---|---|---|
| 4553 Barclay Fair Way Lake Worth, FL | 3.0 | 3.0 | 2278 | $4,000 | $1.76 | 17d | 1 | 0.22mi |
| 4553 Barclay Fair Way Lake Worth, FL | 3.0 | 3.0 | 2278 | $4,000 | $1.76 | 24d | 1 | 0.22mi |
| 10303 Andover Coach Cir Unit A1 Wellington, FL | 2.0 | 2.0 | 1420 | $5,500 | $3.87 | 24d | 1 | 0.34mi |
| 4841 Exeter Estate Ln Lake Worth, FL | 3.0 | 3.0 | 2567 | $5,000 | $1.95 | 24d | 1 | 0.35mi |
| 10173 Andover Coach Cir Unit G2 Lake Worth, FL | 3.0 | 2.0 | 1807 | $3,500 | $1.94 | 24d | 1 | 0.38mi |
| 4173 Imperial Club Ln Lake Worth, FL | 3.0 | 2.5 | 1989 | $2,995 | $1.51 | 18d | 1 | 0.54mi |
| 10640 Oak Meadow Ln Lake Worth, FL | 4.0 | 3.0 | 2727 | $7,500 | $2.75 | 17d | 1 | 0.64mi |
| 11065 Stone Creek St Wellington, FL | 4.0 | 2.5 | 2478 | $4,500 | $1.82 | 24d | 1 | 0.65mi |
| 10880 Northgreen Dr Lake Worth, FL | 3.0 | 3.5 | 2929 | $13,000 | $4.44 | 7d | 1 | 0.67mi |
| 11137 Grandview Mnr Wellington, FL | 4.0 | 3.0 | 2194 | $9,500 | $4.33 | 17d | 1 | 0.82mi |
| 10415 Saint Germain Ct Wellington, FL | 4.0 | 3.5 | 2469 | $6,500 | $2.63 | 22d | 1 | 0.88mi |
| 10415 Saint Germain Ct Wellington, FL | 4.0 | 3.5 | 2469 | $6,500 | $2.63 | 3d | 1 | 0.88mi |
| 10139 Wellington Parc Dr Lake Worth, FL | 4.0 | 3.0 | 2076 | $3,795 | $1.83 | 3d | 1 | 0.95mi |
| 4194 Bluff Harbor Way Wellington, FL | 3.0 | 2.5 | 2152 | $4,001 | $1.86 | 2d | 1 | 0.95mi |
| 10283 Wellington Parc Dr Lake Worth, FL | 4.0 | 3.0 | 2076 | $3,600 | $1.73 | 24d | 1 | 0.95mi |
| 4178 Bluff Harbor Way Wellington, FL | 3.0 | 2.0 | 1904 | $3,800 | $2.00 | 24d | 1 | 0.96mi |
| 4018 Bluff Harbor Way Wellington, FL | 4.0 | 2.5 | 2160 | $4,300 | $1.99 | 7d | 1 | 0.98mi |
| 10385 Wellington Parc Dr Lake Worth, FL | 3.0 | 2.5 | 1783 | $3,250 | $1.82 | 19d | 1 | 0.98mi |
| 3366 Harness Cir Lake Worth, FL | 3.0 | 2.0 | 2340 | $3,750 | $1.60 | 11d | 1 | 0.99mi |
| 10348 Wellington Parc Dr Lake Worth, FL | 3.0 | 2.5 | 2060 | $3,300 | $1.60 | 24d | 1 | 1.00mi |
| 10457 Wellington Parc Dr Lake Worth, FL | 3.0 | 2.5 | 1688 | $3,200 | $1.90 | 24d | 1 | 1.00mi |
| 10426 Wellington Parc Dr Unit 1 Wellington, FL | 4.0 | 2.5 | 2587 | $3,650 | $1.41 | 24d | 1 | 1.02mi |
| 10450 Wellington Parc Dr Wellington, FL | 3.0 | 2.5 | 1983 | $3,350 | $1.69 | 24d | 1 | 1.03mi |
| 9676 Eagle Point Ln Lake Worth, FL | 4.0 | 3.0 | 2815 | $5,800 | $2.06 | 24d | 1 | 1.03mi |
| 3470 Custer Ave Lake Worth, FL | 3.0 | 2.0 | 2040 | $4,500 | $2.21 | 24d | 1 | 1.15mi |
| 10567 Paso Fino Dr Lake Worth, FL | 3.0 | 2.0 | 1655 | $3,950 | $2.39 | 24d | 1 | 1.22mi |
| 10591 Paso Fino Dr Lake Worth, FL | 3.0 | 2.0 | 1764 | $3,500 | $1.98 | 5d | 1 | 1.22mi |
| 10652 Ivanhoe Ln Wellington, FL | 4.0 | 2.5 | 2746 | $6,000 | $2.18 | 24d | 1 | 1.28mi |
| 10372 Old Winston Ct Lake Worth, FL | 3.0 | 2.0 | 1798 | $3,395 | $1.89 | 7d | 1 | 1.32mi |
| 3306 Fargo Ave Lake Worth, FL | 3.0 | 2.0 | 2370 | $5,500 | $2.32 | 24d | 1 | 1.33mi |
| 10731 Ivanhoe Ln Wellington, FL | 4.0 | 2.5 | 2800 | $8,500 | $3.04 | 4d | 1 | 1.34mi |
| 4621 Windward Cove Ln Wellington, FL | 4.0 | 3.0 | 2821 | $4,000 | $1.42 | 24d | 1 | 1.37mi |
HOA detail
- Monthly dues
- $1,087 · $13,044/yr
Listing history 30 events
-
2026-06-18days on market $299,000 Active 45 DOM
-
2026-06-17days on market $299,000 Active 44 DOM
-
2026-06-16days on market $299,000 Active 43 DOM
-
2026-06-15days on market $299,000 Active 42 DOM
-
2026-06-13days on market $299,000 Active 40 DOM
-
2026-06-09days on market $299,000 Active 36 DOM
-
2026-06-08days on market $299,000 Active 35 DOM
-
2026-06-07days on market $299,000 Active 34 DOM
-
2026-06-04days on market $299,000 Active 31 DOM
-
2026-06-03days on market $299,000 Active 30 DOM
-
2026-06-02days on market $299,000 Active 29 DOM
-
2026-06-01days on market $299,000 Active 28 DOM
-
2026-05-31days on market $299,000 Active 27 DOM
-
2026-05-04price $299,000
-
2026-05-04$269,000 Active
-
2025-12-19historical
-
2025-12-17historical $8,750
-
2025-12-12price $8,750
-
2025-11-27$9,500
-
2025-11-27historical $9,500
-
2025-11-26$9,500
-
2025-09-29price $249,000
-
2025-06-05price $265,000
-
2025-05-25$305,000 Active
-
2025-04-10historical
-
2024-12-17price $324,900
-
2024-11-15price $390,000
-
2024-07-25$430,000 Active
-
1993-12-20soldstatus $210,000
-
1993-06-30soldstatus $136,000
ⓘ Source: listings_history table (triggers on properties + properties_extension) + one-shot
backfill from property_details.listing_events for pre-trigger history.
Tax reassessment forecast FL · Resets to sale price
- Current annual tax
- $6,539 · $545/mo
- Projected year-2 tax
- $6,539 · $545/mo
- Expected delta
- $0/yr ($0/mo · 0.0%)
ⓘ Screening estimate from a state-policy table — verify with the county assessor before closing.
Climate risk First Street
- Flood 1/10 Low FEMA zone X (unshaded) · 0% chance over 30 yrs
- Wildfire 1/10 Low
- Heat 9/10 Extreme 7 d/yr ≥106°F today · 25 d/yr by 30 yrs out
- Wind 10/10 Extreme 99% chance of damaging wind over 30 yrs
- Air quality 2/10 Low 0 unhealthy d/yr today · 2 by 30 yrs out
Nearby sold comps map
Loading sold comps map…
Walkable amenities ~0.75 mi
Loading nearby amenities…
Taxation est. · year 1
- Rental income
- $52,815
- − Mortgage interest
- −$16,749
- − Property taxes
- −$6,539
- − Insurance
- −$1,495
- − Repairs & maintenance
- −$4,225
- − Management
- −$4,225
- − HOA
- −$13,044
- − Depreciation
- −$8,698
- Taxable loss
- −$2,160
- Est. tax savings @ 24.0%
- +$518
- After-tax cash flow
- $2,349/yr
For passive investors: Depreciation is non-cash, so a rental often shows a tax loss while cash-flowing — sheltering income. Rental losses are passive: they offset passive income freely, and up to $25,000/yr can offset ordinary (W-2) income if you actively participate and your MAGI is under $100k (phasing out to $0 by $150k); unused losses carry forward. On sale, claimed depreciation is recaptured at up to 25%, and gains may owe capital-gains tax (a 1031 exchange can defer both). Figures are a year-1 estimate at your 24.0% rate — not tax advice; consult a CPA.
Schools (NCES district)
- District
- Palm Beach
- NCES district ID
- 1201500
- Math proficiency
- 46% ▼ -16.00%
- Reading proficiency
- 53% ▼ -4.00%
- Median HH income
- $53,943
- Composite
- 42.72/100
- National rank
- #3160
- State rank
- #34 of 73 in FL
Livability — Wellington
- Score
- 73/100
- State rank
- #294
- US rank
- #4986
Category grades
Schools grade is shown separately in the Schools card above.
Census & demographics
- City population
- 60,184
- Population (ZIP)
- 9,131
Population outlook (Palm Beach County) Hauer SSP2
- Today (2025)
- 1,637,487 people
- By 2030
- 1,743,255 · +6.5%
- By 2040
- 1,948,712 · +19.0%
- By 2050
- 2,132,979 · +30.3%
- By 2075
- 2,530,027 · +54.5%
- By 2100
- 2,706,979 · +65.3%
Race, ethnicity, and origin ACS 2023
- Neighborhood character
- Majority White (65%)
- Race & ethnicity
- White 65% Hispanic / Latino 16% Black 14% Two or more races 7% Asian 4%
- Hispanic origin (detail)
- Mexican 3% Puerto Rican 3% Cuban 3% Salvadoran 2%
- Common ancestry
- Scotch-Irish 5% Romanian 4% Hispanic 3%
- Foreign-born
- 21% · Canada, Jamaica, Vietnam
- Languages at home
- 75% English-only · Spanish 12% French/Haitian/Cajun 4% Other Indo-European 3%
Political lean MEDSL · Palm Beach
- 2024 margin
- Toss-up / Even · D 50.0% · R 49.2%
- 2008→2024 swing
- -22.1pp toward R · 2008: 22.9pp · 2024: 0.8pp
- All cycles
- 2024: D+0.8 2020: D+12.8 2016: D+15.3 2012: D+17.0 2008: D+22.9
Not yet ingested
- Civics
- —
Market trends
- HPI YoY
- ▼ -0.67%
- Current HPI
- 271.0184
- Rent YoY
- —
- Metro
- —
- State GDP YoY
- ▲ 3.28%
- F500 in state
- 36
Industry mix (Fortune 500 HQ in FL)
| Industry | F500 HQs | Revenue |
|---|---|---|
| Industrial Technology | 2 | $29B |
|
||
| Insurance | 2 | $17B |
|
||
| Retail | 1 | $60B |
|
||
| Technology Distribution | 1 | $58B |
|
||
| Homebuilding | 1 | $35B |
|
||
| Technology Manufacturing | 1 | $35B |
|
||
Price history
+119.9% since first listed17 events — show timeline
- 2026-05-04 Price Changed $299,000 Beaches MLS
- 2026-05-04 Listed $269,000 Beaches MLS
- 2025-12-19 Listing Removed — Beaches MLS
- 2025-12-17 Rental Removed $8,750 GFLMLS
- 2025-12-12 Price Changed $8,750 GFLMLS
- 2025-11-27 Listed for Rent $9,500 GFLMLS
- 2025-11-27 Rental Removed $9,500 RMLSFL
- 2025-11-26 Listed for Rent $9,500 RMLSFL
- 2025-09-29 Price Changed $249,000 Beaches MLS
- 2025-06-05 Price Changed $265,000 Beaches MLS
- 2025-05-25 Listed $305,000 Beaches MLS
- 2025-04-10 Listing Removed — Beaches MLS
- 2024-12-17 Price Changed $324,900 Beaches MLS
- 2024-11-15 Price Changed $390,000 Beaches MLS
- 2024-07-25 Listed $430,000 Beaches MLS
- 1993-12-20 Sold (Public Records) $210,000 Public Records
- 1993-06-30 Sold (Public Records) $136,000 Public Records
Property tax history
+7.0%/yrLatest (2025): $6,539 · +209.7% YoY. Source: county tax records.
Cash-flow waterfall
monthlySold comps — $/sqft
last 12 mo · ≤1 miLoading sold comps…