 14-Plex
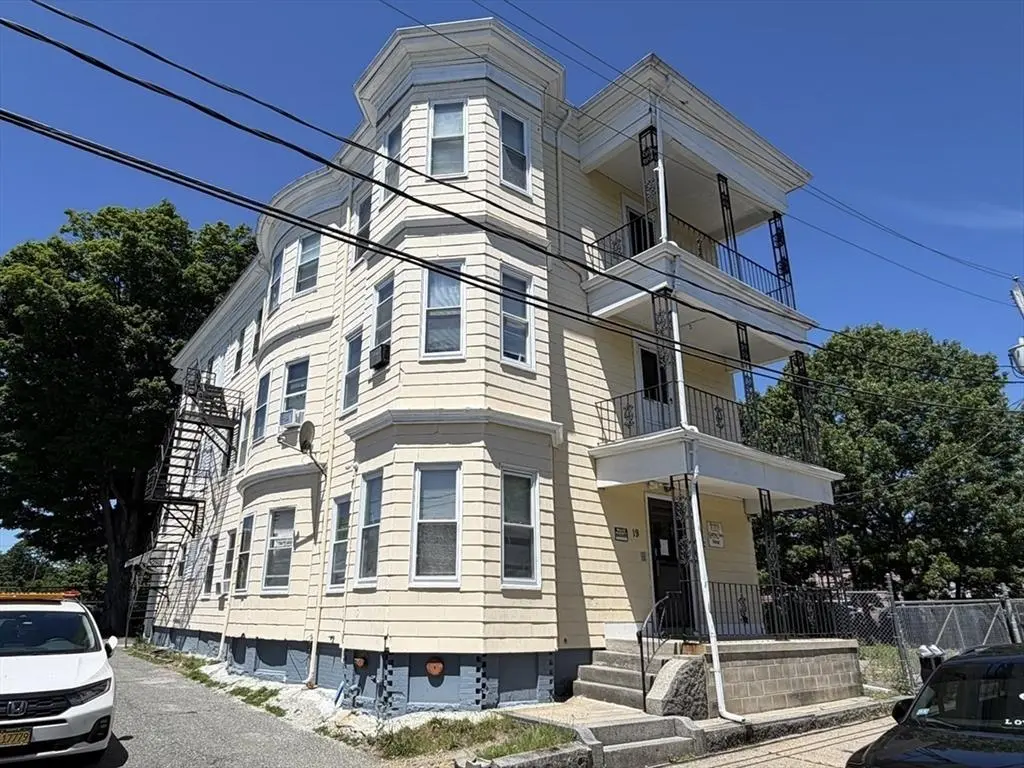
19 Clinton Ave · Brockton, MA
Flood risk 1/10 · Minimal
- FEMA flood zone
- X (unshaded)
- Chance of flooding over 30 yrs
- 0.0%
- Est. flood insurance / yr
- $473 – $860
Fire risk 1/10 · Minimal
- Est. fire insurance / yr
- $915 – $1,699
Heat risk 5/10 · Moderate
- Hot days now (above 98°F)
- 7 days/yr
- Hot days in 30 yrs
- 16 days/yr
Wind risk 6/10 · Moderate
- Chance of severe wind over 30 yrs
- 68.0%
Air-quality risk 2/10 · Minimal
- Unhealthy air days now
- 1 days/yr
- Unhealthy air days in 30 yrs
- 2 days/yr
Risk factors via First Street. Map © Google.
Why this score? — see what drove the C+ grade
The composite is a weighted blend of 9 inputs, each scored 0–100. Each bar is that input's sub-score; the figure is the points it added to the 100-point composite (weight × sub-score).
- Cash flow +30.0/30.0
- 1% rule +10.0/10.0
- DSCR +10.0/10.0
- Livability +3.7/5.0
- Rent growth +3.3/5.0
- Condition / age +2.5/5.0
- Schools +1.5/10.0
- ARV discount +0.0/15.0
- Appreciation +0.0/10.0
$1,300,000
🖨 Deal sheet 📄 Offer letter ✓ Due diligence
Multi-family units
County records classify this as Multi-Family (5+ Unit). Listing-text estimate: 14 units. confirmed
5+ unit building — per-unit beds/baths from public records are typically unavailable; the breakdown below (if shown) is an estimate from the listing text.
Listing remarks MLS
Great investment opportunity for this 14 unit building, made up of 10 single rooms and 4 apartments. A solid "cash cow" income generating property. Newer oil boiler (2016) & rubber roof. Fantastic Brockton center location, directly across from Plymouth Probate & Family court. Close proximity to restaurants, public transportation and local amenities. Property sold individually or as a portfolio package with 109 Green St. MLS# and 113 Green St. MLS # . Portfolio package is being offered for sale at a discounted rate. Additional portfolio financials available upon request. Ask agent for more details.
Key facts
- 4,674 sq ft lot
- 4 parking spots
- Built 1899
Property features AI
Finance
- HOA & community: Not a senior community
Exterior
- Parking: Open parking with 4 spaces
- Utilities: Public water; Public sewer
- Home design: 5+ family rooming house; 4 total stories; Occupies multiple units/levels
- Construction: Stone foundation; Building area approximately 5,376 (total); Year built from public records
- Exterior features: Paved driveway; Lot approximately 0.11 acres
Interior
- Bedrooms: Multiple units with single-level layouts (some units on 1 to 3 floors)
- Bathrooms: Six full bathrooms
- Interior features: Total of 18 rooms; Four stories
Neighborhood map
What this means for you Summary
Snapshot
- This is a 14 × 16-bed/6.0-bath units multifamily listed at $1.30M.
Deal economics
- At list price, monthly cash flow is $24k ($288k/yr) — positive. Per door: $2k/mo.
- The deal already cash-flows at list — no discount required.
- Meets the 1% rule at list price ($41k rent vs $1.30M).
- Cap rate 28.4% vs local median 4.1% in Brockton — top-decile yield for the area; either an underpriced asset or a hidden risk that comps aren't pricing in. Stress-test before assuming the spread holds.
Location & tenants
- Location reads 74/100 on livability (#90 in MA, #4,625 nationally) — a middle-class / working-renter tenant base. Strengths: commute A+, housing A+, health & safety A+; Watch: schools D, crime F, amenities F.
- Brockton (suburban): math 12% / reading 22% proficiency, ranked #298 of 302 in MA (top 99%) — low school quality limits family demand, transient renter base, plan for 1-2y turnover; 69% free/reduced lunch — lower-income household profile, screen leases tightly.
- Market conditions: Rents rising (+3.0%/yr); 71 active listings in the ZIP; 1,255 units permitted in Plymouth County in 2024 (411 in 5+ unit buildings).
- At $40,775/mo this rent would consume 659% of the median local household income ($74k/yr) (locally 2970% of renters already pay >50% of income on rent) — very limited rent-growth headroom before tenants either downsize or default.
Forward outlook
- Local home prices are declining (-3.0%/yr); year-one equity from $9k of loan paydown is wiped out by about $39k of value loss. Plan a longer hold.
- At projected returns (-3.0% appreciation + 3.0% rent growth), your $364k cash investment doubles in ~2 years — after that, you're playing with house money.
Negotiation context
- Only 10 days on market — expect competitive offers; lowballing is unlikely to land.
- 3 sale attempts since 6y ago with the ask held roughly flat each time — persistent listings suggest the price (not the market) is what's stuck; bring a comps-based counter.
- Current owner paid $700k; list at $1.30M implies a 86% gain — meaningful room to come down on a strong offer.
Risks & watch-outs
- Watch-outs: built in 1899 — expect roof / HVAC / electrical / plumbing capex.
- Climate carrying-cost: major wind risk, 68% chance of damaging wind over 30y; extreme-heat days projected 7→16/yr by 2055 (HVAC capex compounding) — expect insurance premiums to compound above CPI over the hold.
Questions for the listing agent
- Can we see the unit-by-unit rent roll, current vacancy, and any below-market leases? What's the average tenancy length?
- What capital expenditures (roof, boiler, parking lot, exteriors) have been made in the last 5 years, and what's planned in the next 2?
- Built in 1899 — when were the roof, HVAC, electrical panel, plumbing, and water heater last replaced?
- Is there a deadline driving the sale (1031 exchange, divorce, estate, relocation)? That informs how much negotiation room exists.
- Schools are D-rated, which usually means shorter tenancies and higher turnover. Who's the typical renter profile here, and what's been the actual vacancy rate?
- Crime grade is F in this area — have there been break-ins, vandalism, or insurance claims at this property in the last 3 years? What carrier currently insures it and at what premium?
- What's the average days-on-market for RENTAL listings here right now (not sales)? A rising rental-DOM trend means longer vacancies and softer asking-rent achievability than the comps imply.
- What's the recent tenant-quality profile in this submarket — average credit score on applications, eviction rate, late-payment / NSF rate, and stable-employment percentage? A property-management company in the area should have these aggregated.
- How much new apartment / multifamily construction is in the pipeline within 1–3 miles? Heavy new supply (>2% of stock underway) typically softens rents 12–24 months out; light construction supports rent growth.
Investment metrics
- 1% rule
- 3.14% ✓
- Cap rate
- 28.42%
- Cash-on-cash
- 79.03%
- DSCR
- 4.52
- GRM
- 2.7
CMA / ARV
- ARV (on-the-fly)
- $1,048,320
- Comps found
- 5
Show comp detail 5 sales within ~0.75 mi
| Address | Dist | Beds/Ba | Sqft | Sold | Price | $/sf | Match |
|---|---|---|---|---|---|---|---|
| 203 W Elm St | 0.28mi | 11/4.0 (+1) | 5,072 (-6%) | 4mo | $985,000 | $194 | 54 |
| 226 W Elm | 0.33mi | 10/4.5 | 4,869 (-9%) | 4mo | $950,000 | $195 | 46 |
| 24 Wall St | 0.30mi | 9/4.0 (-1) | 4,734 (-12%) | 10mo | $950,000 | $201 | 38 |
| 285 W Elm St | 0.48mi | 10/7.0 | 4,839 (-10%) | 16mo | $1,050,000 | $217 | 28 |
| 26 Allen St | 0.27mi | 10/8.0 | 4,685 (-13%) | 24mo | $830,000 | $177 | 26 |
Match score weights: distance 35% · size 25% · config 20% · recency 20%. Top-matched comps best support the ARV.
Projected returns pro-forma
-3.0% appreciation · 3.04% rent growth · sell at horizon
- IRR
- 79.2%
- Equity multiple
- 4.62×
- Total profit
- $1,318,001
- Equity at exit
- $193,834
- IRR
- 82.7%
- Equity multiple
- 9.57×
- Total profit
- $3,121,148
- Equity at exit
- $112,400
Cash invested: $364,000 (down + closing). Projections, not guarantees.
Landlord ↔ Tenant lean methodology
- Overall (STATE)
- 20 Strongly Tenant-Friendly
- State Massachusetts
- 20 Strongly Tenant-Friendly · D+15
- County
- — inherits STATE
- City
- — inherits STATE
ZIP-level market 02301
- Rents YoY
- 3.0%
- Active inventory
- 71
- Price-to-rent
- 37.2×
Monthly cashflow live
- Estimated rent
- $40,775 medium interval (Pro) →
- Mortgage (P&I)
- −$6,817
- Tax from tax record
- −$880 /mo · $10,562/yr
- Insurance
- −$542
- HOA
- −$0
- Vacancy / Maint / Mgmt
- −$8,563
- Net cashflow
- $23,973
Break-even live
14-unit breakdown (identical units grouped — click to expand)
| Units | Beds | Baths | Est. rent |
|---|---|---|---|
| 14× units | 16 | 6 | $40,768 |
| #1 | 16 | 6 | $2,912 |
| #2 | 16 | 6 | $2,912 |
| #3 | 16 | 6 | $2,912 |
| #4 | 16 | 6 | $2,912 |
| #5 | 16 | 6 | $2,912 |
| #6 | 16 | 6 | $2,912 |
| #7 | 16 | 6 | $2,912 |
| #8 | 16 | 6 | $2,912 |
| #9 | 16 | 6 | $2,912 |
| #10 | 16 | 6 | $2,912 |
| #11 | 16 | 6 | $2,912 |
| #12 | 16 | 6 | $2,912 |
| #13 | 16 | 6 | $2,912 |
| #14 | 16 | 6 | $2,912 |
| Total (14 units) | $40,775 | ||
UW: 25.0% down · 7.5% · 30yr · 1.5% tax · 5.0% vac · 8.0% maint · 8.0% mgmt
Financing live
Cash to close
- Down payment
- $325,000
- Closing costs
- $39,000
- Reserves months
- —
- Total cash needed
- —
Loan-product check · same deal, 3 products live
Conventional
25% down · 7.5% · 30yr
- Down + closing
- —
- Monthly P&I
- —
- Monthly cashflow
- —
- DSCR
- —
- Eligible?
- —
Personal DTI + credit; lowest rate.
DSCR
20% down · 8.5% · 30yr
- Down + closing
- —
- Monthly P&I
- —
- Monthly cashflow
- —
- DSCR
- —
- Eligible?
- —
No personal income docs; deal must DSCR.
Hard money
10% down · 12.0% · 12mo
- Down + closing
- —
- Monthly P&I
- —
- Monthly cashflow
- —
- DSCR
- —
- Eligible?
- —
Short-term bridge; refi at stabilization.
Listing history 7 events
-
2026-06-18days on market $1,300,000 Active 10 DOM
-
2026-06-17days on market $1,300,000 Active 9 DOM
-
2026-06-16days on market $1,300,000 Active 8 DOM
-
2026-06-15days on market $1,300,000 Active 7 DOM
-
2026-06-13statusdays on market $1,300,000 Active 5 DOM
-
2026-06-09remarks 647-char remark
-
2026-06-09$1,300,000 New 1 DOM
ⓘ Source: listings_history table (triggers on properties + properties_extension) + one-shot
backfill from property_details.listing_events for pre-trigger history.
Tax reassessment forecast MA · Partial reset (capped growth)
- Current annual tax
- $10,562 · $880/mo
- Projected year-2 tax
- $13,276 · $1,106/mo
- Expected delta
- +$2,714/yr (+$226/mo · 25.7%)
ⓘ Screening estimate from a state-policy table — verify with the county assessor before closing.
Climate risk First Street
- Flood 1/10 Low FEMA zone X (unshaded) · 0% chance over 30 yrs
- Wildfire 1/10 Low
- Heat 5/10 Major 7 d/yr ≥98°F today · 16 d/yr by 30 yrs out
- Wind 6/10 Major 68% chance of damaging wind over 30 yrs
- Air quality 2/10 Low 1 unhealthy d/yr today · 2 by 30 yrs out
Nearby sold comps map
Loading sold comps map…
Walkable amenities ~0.75 mi
Loading nearby amenities…
Taxation est. · year 1
- Rental income
- $489,300
- − Mortgage interest
- −$72,820
- − Property taxes
- −$10,562
- − Insurance
- −$6,500
- − Repairs & maintenance
- −$39,144
- − Management
- −$39,144
- − Depreciation
- −$37,818
- Taxable income
- $283,312
- Est. tax owed @ 24.0%
- −$67,995
- After-tax cash flow
- $219,682/yr
For passive investors: Depreciation is non-cash, so a rental often shows a tax loss while cash-flowing — sheltering income. Rental losses are passive: they offset passive income freely, and up to $25,000/yr can offset ordinary (W-2) income if you actively participate and your MAGI is under $100k (phasing out to $0 by $150k); unused losses carry forward. On sale, claimed depreciation is recaptured at up to 25%, and gains may owe capital-gains tax (a 1031 exchange can defer both). Figures are a year-1 estimate at your 24.0% rate — not tax advice; consult a CPA.
Schools (NCES district)
- District
- Brockton
- NCES district ID
- 2503090
- Math proficiency
- 12% ▼ -11.00%
- Reading proficiency
- 22% ▼ -6.00%
- Median HH income
- $49,822
- Composite
- 15.37/100
- National rank
- #9323
- State rank
- #298 of 302 in MA
Livability — Brockton
- Score
- 74/100
- State rank
- #90
- US rank
- #4625
Category grades
Schools grade is shown separately in the Schools card above.
Census & demographics
- Census place
- Brockton, MA
- County
- Plymouth County · 358,589 people
- City population
- 105,386
- Metro
- Boston-Cambridge-Newton, MA-NH
- Population (ZIP)
- 68,969
- Household income
- $74,214
- Rent vs Own
- Severe rent burden
- 2970.0
Population outlook (Plymouth County) Hauer SSP2
- Today (2025)
- 533,105 people
- By 2030
- 541,862 · +1.6%
- By 2040
- 549,791 · +3.1%
- By 2050
- 542,476 · +1.8%
- By 2075
- 518,429 · -2.8%
- By 2100
- 448,179 · -15.9%
Race, ethnicity, and origin ACS 2023
- Neighborhood character
- Highly diverse neighborhood (Simpson 0.78)
- Race & ethnicity
- Black 39% White 24% Two or more races 20% Hispanic / Latino 13% Asian 2%
- Hispanic origin (detail)
- Puerto Rican 5% Dominican 2%
- Common ancestry
- Hispanic 13% Russian 2% Lithuanian 2%
- Foreign-born
- 34% · Canada, China, Vietnam
- Languages at home
- 51% English-only · French/Haitian/Cajun 24% Other Indo-European 11% Spanish 11%
Political lean MEDSL · Plymouth
- 2024 margin
- Lean D (+8.8) · D 53.6% · R 44.7% · Other 1.7%
- 2008→2024 swing
- +1.3pp toward D · 2008: 7.6pp · 2024: 8.8pp
- All cycles
- 2024: D+8.8 2020: D+17.4 2016: D+7.2 2012: D+3.8 2008: D+7.6
Not yet ingested
- Civics
- —
Market trends
- HPI YoY
- ▼ -403.95%
- Current HPI
- 450.9985
- Rent YoY
- ▲ 3.04%
- Metro
- Boston-Cambridge-Newton, MA-NH
- State GDP YoY
- ▲ 2.28%
- F500 in state
- 38
Industry mix (Fortune 500 HQ in MA)
| Industry | F500 HQs | Revenue |
|---|---|---|
| Technology | 3 | $17B |
|
||
| Insurance | 2 | $84B |
|
||
| Retail | 2 | $76B |
|
||
| Life Sciences | 1 | $43B |
|
||
| Energy Technology | 1 | $31B |
|
||
| Aerospace / Defense | 1 | $18B |
|
||
Price history
+79.3% since first listed6 events — show timeline
- 2026-06-08 Listed $1,300,000 MLS PIN
- 2020-10-30 Sold (MLS) $700,000 MLS PIN
- 2020-08-28 Pending — MLS PIN
- 2020-08-17 Relisted — MLS PIN
- 2020-08-13 Contingent — MLS PIN
- 2020-07-13 Listed $725,000 MLS PIN
Property tax history
+3.3%/yrLatest (2025): $10,562 · +0.7% YoY. Source: county tax records.
Cash-flow waterfall
monthlySold comps — $/sqft
last 12 mo · ≤1 miLoading sold comps…