 12-Plex
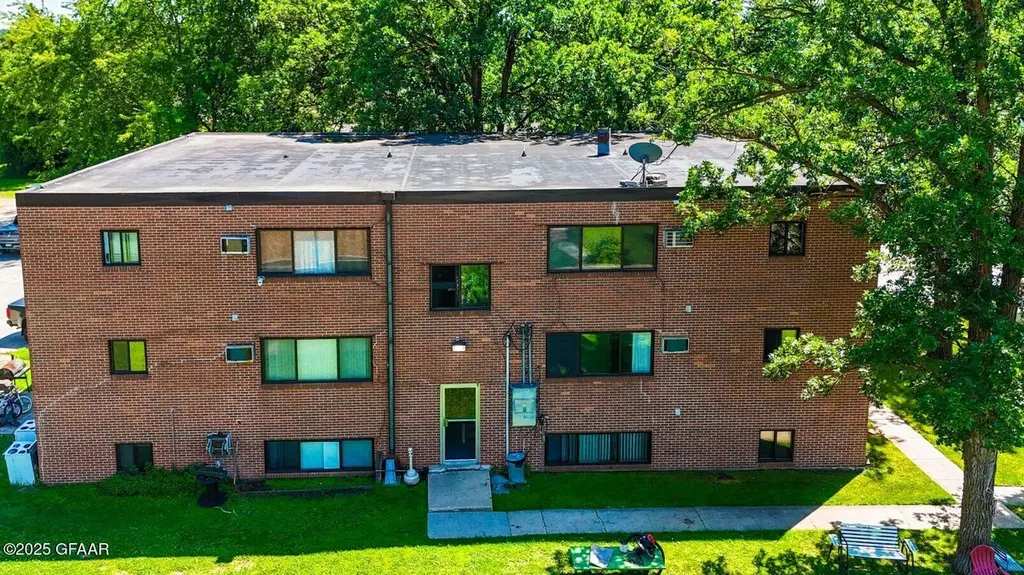
506 3rd Ave NE · Roseau, MN
Flood risk 1/10 · Minimal
- FEMA flood zone
- X (unshaded)
- Chance of flooding over 30 yrs
- 0.0%
- Est. flood insurance / yr
- $473 – $860
Fire risk 2/10 · Minimal
- Est. fire insurance / yr
- $888 – $1,650
Heat risk 1/10 · Minimal
- Hot days now (above 94°F)
- 7 days/yr
- Hot days in 30 yrs
- 12 days/yr
Wind risk 1/10 · Minimal
- Chance of severe wind over 30 yrs
- —
Air-quality risk 3/10 · Minor
- Unhealthy air days now
- 3 days/yr
- Unhealthy air days in 30 yrs
- 3 days/yr
Risk factors via First Street. Map © Google.
Why this score? — see what drove the B grade
The composite is a weighted blend of 9 inputs, each scored 0–100. Each bar is that input's sub-score; the figure is the points it added to the 100-point composite (weight × sub-score).
- Cash flow +30.0/30.0
- 1% rule +10.0/10.0
- DSCR +10.0/10.0
- ARV discount +7.5/15.0
- Schools +4.2/10.0
- Livability +4.0/5.0
- Rent growth +2.5/5.0
- Condition / age +2.2/5.0
- Appreciation +1.7/10.0
$505,000
🖨 Deal sheet 📄 Offer letter ✓ Due diligence
Multi-family units
County records classify this as Multi-Family (2-4 Unit). Listing-text estimate: 12 units. estimate disagrees with records
Listing remarks MLS
This 12-unit apartment building has a mix of five 2-bedroom units and 7 1-bedroom units. Building consists of brick construction, on site laundry, boiler heat (paid by landlord), surface parking. Rents range from $510 to $600 with tenant responsible for electric. Overall performance could increase by implementing a Ratio Utility Billing System (RUBS) program to absorb some of the heat expense.
Key facts
- 0.48 acre lot
- Built 1967
- Listed 310 days
Neighborhood map
What this means for you Summary
Snapshot
- This is a 5×2bd/1ba + 7×1bd/1ba units multifamily listed at $505k. Condition is rated fair.
Deal economics
- At list price, monthly cash flow is $5k ($60k/yr) — positive. Per door: $420/mo.
- The deal already cash-flows at list — no discount required.
- Meets the 1% rule at list price ($11k rent vs $505k).
- Recommended offer: $444k (12.0% below list) — sets the bar for market timing.
- Cap rate 18.3% vs local median 3.5% in Roseau — top-decile yield for the area; either an underpriced asset or a hidden risk that comps aren't pricing in. Stress-test before assuming the spread holds.
Location & tenants
- Location reads 80/100 on livability (#80 in MN, #1,901 nationally) — a professional / high-income tenant draw. Strengths: cost of living A+, housing A+, health & safety A+; Watch: amenities D+, commute F.
- Roseau Public School District (town): math 45% / reading 53% proficiency, ranked #125 of 301 in MN (top 42%) — families likely to look elsewhere, expect single-tenant / working-renter base with shorter leases; only 17% free/reduced lunch — higher-income household profile.
- Market conditions: 42 active listings in the ZIP; 49 units permitted in Roseau County in 2024 (15 in 5+ unit buildings).
Forward outlook
- Local home prices are declining (-3.0%/yr); year-one equity from $3k of loan paydown is wiped out by about $15k of value loss. Plan a longer hold.
- Roseau County population projected to shrink 7% by 2050 — rents likely to lag national; underwrite the cash flow, not the appreciation.
- At projected returns (-3.0% appreciation + 3.0% rent growth), your $141k cash investment doubles in ~3 years — after that, you're playing with house money.
Negotiation context
- It's been on market 311 days — a 12% lower offer ($444k) is reasonable based on typical stale-listing flexibility.
Questions for the listing agent
- It's been on market 311 days. Have you received any prior offers? Is the seller open to a 12% concession, seller financing, or rate buy-down credit?
- Can we see the unit-by-unit rent roll, current vacancy, and any below-market leases? What's the average tenancy length?
- What capital expenditures (roof, boiler, parking lot, exteriors) have been made in the last 5 years, and what's planned in the next 2?
- Have any recent inspections been done? Can we get a copy of the seller's disclosures and any deferred-maintenance estimates?
- Built in 1967 — when were the roof, HVAC, electrical panel, plumbing, and water heater last replaced?
- Why hasn't it sold? Are there any deal-killer items the seller is aware of (foundation, flood, title, zoning, code violations)?
- Is there a deadline driving the sale (1031 exchange, divorce, estate, relocation)? That informs how much negotiation room exists.
- Schools are B-rated — typically a magnet for longer-tenancy family renters. What's the average tenant stay here, and is there a school-zone premium baked into asking?
- What's the average days-on-market for RENTAL listings here right now (not sales)? A rising rental-DOM trend means longer vacancies and softer asking-rent achievability than the comps imply.
- What's the recent tenant-quality profile in this submarket — average credit score on applications, eviction rate, late-payment / NSF rate, and stable-employment percentage? A property-management company in the area should have these aggregated.
- How much new apartment / multifamily construction is in the pipeline within 1–3 miles? Heavy new supply (>2% of stock underway) typically softens rents 12–24 months out; light construction supports rent growth.
Investment metrics
- 1% rule
- 2.14% ✓
- Cap rate
- 18.26%
- Cash-on-cash
- 42.75%
- DSCR
- 2.90
- GRM
- 3.9
CMA / ARV
No comps found within radius.
Projected returns pro-forma
-3.0% appreciation · 3.0% rent growth · sell at horizon
- IRR
- 39.5%
- Equity multiple
- 2.69×
- Total profit
- $239,161
- Equity at exit
- $75,297
- IRR
- 45.9%
- Equity multiple
- 5.40×
- Total profit
- $622,038
- Equity at exit
- $43,663
Cash invested: $141,400 (down + closing). Projections, not guarantees.
Landlord ↔ Tenant lean methodology
- Overall (STATE)
- 46 Balanced
- State Minnesota
- 46 Balanced · D+2
- County
- — inherits STATE
- City
- — inherits STATE
ZIP-level market 56751
- Home prices YoY
- -3.0%
- Active inventory
- 42
- Price-to-rent
- 45.9×
Monthly cashflow live
- Estimated rent
- $10,794 medium interval (Pro) →
- Mortgage (P&I)
- −$2,648
- Tax est. 1.5%
- −$631 /mo · $7,575/yr
- Insurance
- −$210
- HOA
- −$0
- Vacancy / Maint / Mgmt
- −$2,267
- Net cashflow
- $5,037
Break-even live
12-unit breakdown (identical units grouped — click to expand)
| Units | Beds | Baths | Est. rent |
|---|---|---|---|
| 5× units | 2 | 1 | $4,585 |
| #1 | 2 | 1 | $917 |
| #2 | 2 | 1 | $917 |
| #3 | 2 | 1 | $917 |
| #4 | 2 | 1 | $917 |
| #5 | 2 | 1 | $917 |
| 7× units | 1 | 1 | $6,209 |
| #6 | 1 | 1 | $887 |
| #7 | 1 | 1 | $887 |
| #8 | 1 | 1 | $887 |
| #9 | 1 | 1 | $887 |
| #10 | 1 | 1 | $887 |
| #11 | 1 | 1 | $887 |
| #12 | 1 | 1 | $887 |
| Total (12 units) | $10,794 | ||
UW: 25.0% down · 7.5% · 30yr · 1.5% tax · 5.0% vac · 8.0% maint · 8.0% mgmt
Financing live
Cash to close
- Down payment
- $126,250
- Closing costs
- $15,150
- Reserves months
- —
- Total cash needed
- —
Loan-product check · same deal, 3 products live
Conventional
25% down · 7.5% · 30yr
- Down + closing
- —
- Monthly P&I
- —
- Monthly cashflow
- —
- DSCR
- —
- Eligible?
- —
Personal DTI + credit; lowest rate.
DSCR
20% down · 8.5% · 30yr
- Down + closing
- —
- Monthly P&I
- —
- Monthly cashflow
- —
- DSCR
- —
- Eligible?
- —
No personal income docs; deal must DSCR.
Hard money
10% down · 12.0% · 12mo
- Down + closing
- —
- Monthly P&I
- —
- Monthly cashflow
- —
- DSCR
- —
- Eligible?
- —
Short-term bridge; refi at stabilization.
Listing history 4 events
-
2026-06-01days on market $505,000 Active 311 DOM
-
2026-05-31days on market $505,000 Active 310 DOM
-
2026-05-31days on market $505,000 Active 309 DOM
-
2025-07-25$505,000 Active 396-char remark
Show marketing remark (396 chars)
This 12-unit apartment building has a mix of five 2-bedroom units and 7 1-bedroom units. Building consists of brick construction, on site laundry, boiler heat (paid by landlord), surface parking. Rents range from $510 to $600 with tenant responsible for electric. Overall performance could increase by implementing a Ratio Utility Billing System (RUBS) program to absorb some of the heat expense.
ⓘ Source: listings_history table (triggers on properties + properties_extension) + one-shot
backfill from property_details.listing_events for pre-trigger history.
Climate risk First Street
- Flood 1/10 Low FEMA zone X (unshaded) · 0% chance over 30 yrs
- Wildfire 2/10 Low
- Heat 1/10 Low 7 d/yr ≥94°F today · 12 d/yr by 30 yrs out
- Wind 1/10 Low
- Air quality 3/10 Moderate 3 unhealthy d/yr today · 3 by 30 yrs out
Nearby sold comps map
Loading sold comps map…
Walkable amenities ~0.75 mi
Loading nearby amenities…
Taxation est. · year 1
- Rental income
- $129,528
- − Mortgage interest
- −$28,288
- − Property taxes
- −$7,575
- − Insurance
- −$2,525
- − Repairs & maintenance
- −$10,362
- − Management
- −$10,362
- − Depreciation
- −$14,691
- Taxable income
- $55,725
- Est. tax owed @ 24.0%
- −$13,374
- After-tax cash flow
- $47,074/yr
For passive investors: Depreciation is non-cash, so a rental often shows a tax loss while cash-flowing — sheltering income. Rental losses are passive: they offset passive income freely, and up to $25,000/yr can offset ordinary (W-2) income if you actively participate and your MAGI is under $100k (phasing out to $0 by $150k); unused losses carry forward. On sale, claimed depreciation is recaptured at up to 25%, and gains may owe capital-gains tax (a 1031 exchange can defer both). Figures are a year-1 estimate at your 24.0% rate — not tax advice; consult a CPA.
Condition & rehab AI · 10 photos
This 12-unit apartment building requires moderate renovations to improve its condition and increase its resale and rental value.
Repairs flagged
- Minor Kitchen cabinets — Aesthetic update needed.
- Minor Kitchen countertops — Clean and freshen up appearance.
- Minor Bathroom fixtures — Update to modernize the space.
- Moderate Roof — Signs of wear, may need replacement or repair.
- Moderate Exterior paint — Discoloration and wear, may need repainting.
- Moderate Flooring — Worn carpet, may need replacement or reupholstering.
- Moderate Paint — Faded paint, may need touch-up or repainting.
- Minor Windows — Clean and freshen up appearance.
- Minor HVAC unit — Update to more energy-efficient model.
- Minor Landscaping — Improve curb appeal with landscaping and plants.
Value-add opportunities
- Both Update kitchen cabinets and countertops — Modern kitchen will attract more renters and buyers.
- Both Replace worn carpet or flooring — Fresh flooring will improve both resale and rental value.
- Both Paint interior walls and exterior — Fresh paint will improve curb appeal and interior aesthetics.
- Both Replace HVAC unit — Energy-efficient HVAC will reduce utility costs and improve comfort.
- Both Improve landscaping — Landscaping will enhance curb appeal and attract more renters and buyers.
- Both Replace worn windows — New windows will improve energy efficiency and curb appeal.
Renovation cost estimate screening
| Repair item | Severity | Est. cost |
|---|---|---|
| Kitchen cabinets · Aesthetic update needed. | Minor | $500–3,000 |
| Kitchen countertops · Clean and freshen up appearance. | Minor | $500–3,000 |
| Bathroom fixtures · Update to modernize the space. | Minor | $500–3,000 |
| Roof · Signs of wear, may need replacement or repair. | Moderate | $3,000–15,000 |
| Exterior paint · Discoloration and wear, may need repainting. | Moderate | $3,000–15,000 |
| Flooring · Worn carpet, may need replacement or reupholstering. | Moderate | $3,000–15,000 |
| Paint · Faded paint, may need touch-up or repainting. | Moderate | $3,000–15,000 |
| Windows · Clean and freshen up appearance. | Minor | $500–3,000 |
| HVAC unit · Update to more energy-efficient model. | Minor | $500–3,000 |
| Landscaping · Improve curb appeal with landscaping and plants. | Minor | $500–3,000 |
| Total estimated repair cost · 10 items | $15,000–78,000 |
Value-add ROI direction
- Both Update kitchen cabinets and countertops — Modern kitchen will attract more renters and buyers. ↑
- Both Replace worn carpet or flooring — Fresh flooring will improve both resale and rental value. ↑
- Both Paint interior walls and exterior — Fresh paint will improve curb appeal and interior aesthetics. ↑
- Both Replace HVAC unit — Energy-efficient HVAC will reduce utility costs and improve comfort. ↑
- Both Improve landscaping — Landscaping will enhance curb appeal and attract more renters and buyers. ↑
- Both Replace worn windows — New windows will improve energy efficiency and curb appeal. ↑
ⓘ Cost ranges are severity-bucket heuristics (US national rule-of-thumb). Get contractor quotes + a written scope before underwriting a rehab budget.
Schools (NCES district)
- District
- Roseau Public School District
- NCES district ID
- 2732250
- Math proficiency
- 45% ▼ -16.00%
- Reading proficiency
- 53% ▼ -12.00%
- Median HH income
- $54,940
- Composite
- 42.4/100
- National rank
- #3232
- State rank
- #125 of 301 in MN
Livability — Roseau
- Score
- 80/100
- State rank
- #80
- US rank
- #1901
Category grades
Schools grade is shown separately in the Schools card above.
Census & demographics
- Census place
- Roseau, MN
- Population (ZIP)
- 5,776
Population outlook (Roseau County) Hauer SSP2
- Today (2025)
- 15,709 people
- By 2030
- 15,559 · -1.0%
- By 2040
- 15,168 · -3.4%
- By 2050
- 14,539 · -7.4%
- By 2075
- 13,430 · -14.5%
- By 2100
- 11,713 · -25.4%
Race, ethnicity, and origin ACS 2023
- Neighborhood character
- Predominantly White (90%)
- Race & ethnicity
- White 90% Two or more races 5% Hispanic / Latino 2% Black 2%
- Common ancestry
- Portuguese 29% Lithuanian 5% Scottish 5%
- Foreign-born
- 4% · Canada, Jamaica
- Languages at home
- 96% English-only · Spanish 2%
Political lean MEDSL · Roseau
- 2024 margin
- Solid R (+49.3) · D 24.7% · R 74.0% · Other 1.3%
- 2008→2024 swing
- -31.9pp toward R · 2008: -17.4pp · 2024: -49.3pp
- All cycles
- 2024: R+49.3 2020: R+46.0 2016: R+46.3 2012: R+22.3 2008: R+17.4
Not yet ingested
- Civics
- —
Market trends
- HPI YoY
- ▼ -6.59%
- Current HPI
- 217.2504
- Rent YoY
- —
- Metro
- —
- State GDP YoY
- ▲ 2.41%
- F500 in state
- 34
Industry mix (Fortune 500 HQ in MN)
| Industry | F500 HQs | Revenue |
|---|---|---|
| Healthcare | 2 | $407B |
|
||
| Retail | 2 | $150B |
|
||
| Consumer Goods | 2 | $32B |
|
||
| Industrial Machinery | 2 | $6B |
|
||
| Agriculture | 1 | $40B |
|
||
| Healthcare / Medical Devices | 1 | $32B |
|
||
Price history
1 event — show timeline
- 2025-07-25 Listed $505,000 GFAAR
Cash-flow waterfall
monthlySold comps — $/sqft
last 12 mo · ≤1 miLoading sold comps…