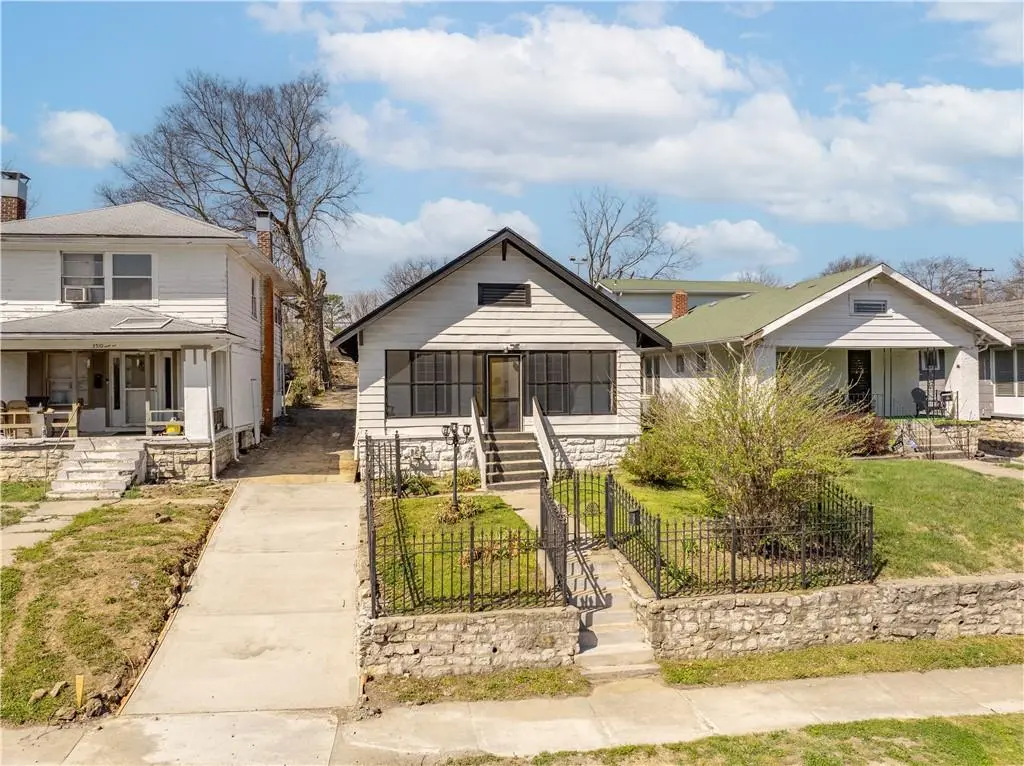
3506 Askew Ave · Kansas City, MO
Flood risk 1/10 · Minimal
- FEMA flood zone
- X (unshaded)
- Chance of flooding over 30 yrs
- 0.0%
- Est. flood insurance / yr
- $473 – $860
Fire risk 1/10 · Minimal
- Est. fire insurance / yr
- $1,054 – $1,958
Heat risk 4/10 · Minor
- Hot days now (above 107°F)
- 7 days/yr
- Hot days in 30 yrs
- 17 days/yr
Wind risk 2/10 · Minimal
- Chance of severe wind over 30 yrs
- —
Air-quality risk 3/10 · Minor
- Unhealthy air days now
- 2 days/yr
- Unhealthy air days in 30 yrs
- 3 days/yr
Risk factors via First Street. Map © Google.
Why this score? — see what drove the C- grade
The composite is a weighted blend of 9 inputs, each scored 0–100. Each bar is that input's sub-score; the figure is the points it added to the 100-point composite (weight × sub-score).
- Cash flow +19.2/30.0
- Appreciation +10.0/10.0
- DSCR +6.1/10.0
- 1% rule +3.9/10.0
- Livability +3.9/5.0
- Rent growth +3.7/5.0
- Condition / age +2.5/5.0
- Schools +1.5/10.0
- ARV discount +0.0/15.0
$148,500
🖨 Deal sheet 📄 Offer letter ✓ Due diligence
Key facts
- 4,792 sq ft lot
- Built 1922
- Listed 30 days
Property features AI
Finance
- Other: Living area reported as 1,034 (source: RPR)
- HOA & community: No association fees
Exterior
- Parking: Off-street parking
- Utilities: City/public water (verify); Public sewer
- Home design: Single-family residence; Residential property; One-story (ranch) with upper-level bedroom
- Construction: Stone exterior; Composition roof; Home is over 100 years old
- Exterior features: Not in a flood plain; Lot approximately 4,792 square feet
Interior
- Bedrooms: 3 bedrooms (two on the main level, one on the upper level)
- Bathrooms: 1 full bathroom
- Heating & cooling: Natural gas heating; Electric cooling
- Interior features: Ranch floor plan; Unfinished basement
Neighborhood map
What this means for you Summary
Snapshot
- This is a 3-bed/1.0-bath single-family listed at $148k.
Deal economics
- At list price, monthly cash flow is $160 ($2k/yr) — positive.
- The deal already cash-flows at list — no discount required.
- To meet the 1% rule (rent ≥ 1% of price), the offer needs to be $132k (10.9% below list).
- Recommended offer: $132k (10.9% below list) — sets the bar for 1% rule.
- Cap rate 7.6% vs local median 3.9% in Kansas City — top-decile yield for the area; either an underpriced asset or a hidden risk that comps aren't pricing in. Stress-test before assuming the spread holds.
Location & tenants
- Location reads 78/100 on livability (#28 in MO, #2,671 nationally) — a middle-class / working-renter tenant base. Strengths: amenities A+, commute A+, cost of living A+; Watch: schools C-, crime F.
- Kansas City 33 (urban): math 12% / reading 24% proficiency, ranked #308 of 324 in MO (top 95%) — low school quality limits family demand, transient renter base, plan for 1-2y turnover; 75% free/reduced lunch — lower-income household profile, screen leases tightly.
- Market conditions: Rents rising fast (+4.7%/yr); 86 active listings in the ZIP; 40 comparable units currently listed for rent nearby; rentals at typical pace (median 24d on market — plan ~3-4 weeks tenant-placement turnaround); 40% of comp listings sitting > 30 days — soft ceiling on asking rent; lower-income renter base — watch delinquency; 4,002 units permitted in Jackson County in 2024 (2,271 in 5+ unit buildings).
- This rent runs 44% of the median local income ($36k/yr) — at the standard rent-burdened threshold; future hikes will face affordability resistance.
Forward outlook
- In year one you build about $16k of equity ($1k loan paydown + $15k appreciation (10.0% local appreciation)).
- Jackson County population projected at +4% by 2050 — modest demand growth; plan on rents tracking national, not racing it.
- At projected returns (10.0% appreciation + 4.7% rent growth), your $42k cash investment doubles in ~3 years — after that, you're playing with house money.
- By year 3, paydown + projected appreciation supports a ~$40k cash-out refi (75% LTV) — recoverable capital for the next deal without selling this one.
Negotiation context
- It's been on market 30 days — a 2% lower offer ($146k) is reasonable based on typical stale-listing flexibility.
- 2 sale attempts with the ask held roughly flat each time — persistent listings suggest the price (not the market) is what's stuck; bring a comps-based counter.
Risks & watch-outs
- Watch-outs: built in 1922 — expect roof / HVAC / electrical / plumbing capex.
Questions for the listing agent
- Built in 1922 — when were the roof, HVAC, electrical panel, plumbing, and water heater last replaced?
- Is there a deadline driving the sale (1031 exchange, divorce, estate, relocation)? That informs how much negotiation room exists.
- Crime grade is F in this area — have there been break-ins, vandalism, or insurance claims at this property in the last 3 years? What carrier currently insures it and at what premium?
- What's the average days-on-market for RENTAL listings here right now (not sales)? A rising rental-DOM trend means longer vacancies and softer asking-rent achievability than the comps imply.
- What's the recent tenant-quality profile in this submarket — average credit score on applications, eviction rate, late-payment / NSF rate, and stable-employment percentage? A property-management company in the area should have these aggregated.
- How much new for-sale + rental construction is in the pipeline within 1–3 miles? Heavy new supply typically softens prices + rents 12–24 months out; constrained supply supports both.
Investment metrics
- 1% rule
- 0.89% ✗
- Cap rate
- 7.59%
- Cash-on-cash
- 4.63%
- DSCR
- 1.21
- GRM
- 9.4
CMA / ARV
- ARV (median comp)
- $99,151
- List price
- $148,500
- Delta
- 51.28%
- Verdict
- OVERPRICED
- Comps
- 20 within 1.0 mi
Show comp detail 12 sales within ~0.75 mi
| Address | Dist | Beds/Ba | Sqft | Sold | Price | $/sf | Match |
|---|---|---|---|---|---|---|---|
| 3304 Askew Ave | 0.26mi | 3/1.0 | 1,066 (+3%) | 3mo | $45,000 | $42 | 80 |
| 3711 Bellefontaine Ave | 0.38mi | 3/1.0 | 1,007 (-3%) | 4mo | $120,000 | $119 | 74 |
| 4015 E Linwood Blvd | 0.48mi | 2/1.0 (-1) | 1,036 (+0%) | 4mo | $79,000 | $76 | 69 |
| 3838 S Benton Ave | 0.62mi | 3/1.0 | 1,066 (+3%) | 3mo | $90,000 | $84 | 64 |
| 3316 Cypress Ave | 0.60mi | 3/1.0 | 1,100 (+6%) | 3mo | $90,000 | $82 | 59 |
| 3640 Cleveland Ave | 0.23mi | 2/2.0 (-1) | 900 (-13%) | 4mo | $105,000 | $117 | 55 |
| 3920 Spruce Ave | 0.70mi | 2/1.0 (-1) | 968 (-6%) | 4mo | $105,000 | $108 | 49 |
| 3630 Jackson Ave | 0.41mi | 2/1.0 (-1) | 888 (-14%) | 4mo | $59,000 | $66 | 49 |
| 3031 Askew Ave | 0.57mi | 2/1.0 (-1) | 928 (-10%) | 3mo | $40,000 | $43 | 48 |
| 3025 Walrond Ave | 0.63mi | 3/2.0 | 1,172 (+13%) | 4mo | $216,500 | $185 | 41 |
| 3942 Myrtle Ave | 0.63mi | 2/1.0 (-1) | 890 (-14%) | 3mo | $85,000 | $96 | 40 |
| 3920 S Benton Ave | 0.68mi | 2/1.5 (-1) | 1,160 (+12%) | 5mo | $65,000 | $56 | 37 |
Match score weights: distance 35% · size 25% · config 20% · recency 20%. Top-matched comps best support the ARV.
Projected returns pro-forma
10.0% appreciation · 4.65% rent growth · sell at horizon
- IRR
- 28.2%
- Equity multiple
- 3.24×
- Total profit
- $93,250
- Equity at exit
- $133,781
- IRR
- 25.0%
- Equity multiple
- 7.52×
- Total profit
- $271,288
- Equity at exit
- $288,503
Cash invested: $41,580 (down + closing). Projections, not guarantees.
Landlord ↔ Tenant lean methodology
- Overall (STATE)
- 81 Strongly Landlord-Friendly
- State Missouri
- 81 Strongly Landlord-Friendly · R+10
- County
- — inherits STATE
- City
- — inherits STATE
ZIP-level market 64128
- Home prices YoY
- 21.6%
- Rents YoY
- 4.7%
- Active inventory
- 86
- Price-to-rent
- 9.4×
Monthly cashflow live
- Estimated rent
- $1,323 high interval (Pro) →
- Mortgage (P&I)
- −$779
- Tax from tax record
- −$44 /mo · $527/yr
- Insurance
- −$62
- HOA
- −$0
- Vacancy / Maint / Mgmt
- −$278
- Net cashflow
- $160
Break-even live
UW: 25.0% down · 7.5% · 30yr · 1.5% tax · 5.0% vac · 8.0% maint · 8.0% mgmt
Financing live
Cash to close
- Down payment
- $37,125
- Closing costs
- $4,455
- Reserves months
- —
- Total cash needed
- —
Loan-product check · same deal, 3 products live
Conventional
25% down · 7.5% · 30yr
- Down + closing
- —
- Monthly P&I
- —
- Monthly cashflow
- —
- DSCR
- —
- Eligible?
- —
Personal DTI + credit; lowest rate.
DSCR
20% down · 8.5% · 30yr
- Down + closing
- —
- Monthly P&I
- —
- Monthly cashflow
- —
- DSCR
- —
- Eligible?
- —
No personal income docs; deal must DSCR.
Hard money
10% down · 12.0% · 12mo
- Down + closing
- —
- Monthly P&I
- —
- Monthly cashflow
- —
- DSCR
- —
- Eligible?
- —
Short-term bridge; refi at stabilization.
Rent comps 40 comps
| Address | Beds | Baths | Sqft | Rent | $/sqft | DOM | Units | Dist |
|---|---|---|---|---|---|---|---|---|
| 3305 Askew Ave Kansas City, MO | 3.0 | 1.5 | 1428 | $1,450 | $1.02 | 23d | 1 | 0.26mi |
| 3310 College Ave Kansas City, MO | 3.0 | 1.0 | 874 | $995 | $1.14 | 43d | 1 | 0.30mi |
| 3713 Cleveland Ave Kansas City, MO | 4.0 | 1.0 | 1256 | $1,250 | $1.00 | 16d | 1 | 0.31mi |
| 3524 Bellefontaine Ave Kansas City, MO | 3.0 | 1.0 | 1228 | $1,350 | $1.10 | 43d | 1 | 0.32mi |
| 3739 Bales Ave Kansas City, MO | 3.0 | 2.0 | 1400 | $1,575 | $1.12 | 23d | 1 | 0.34mi |
| 3332 Norton Ave Kansas City, MO | 3.0 | 1.0 | 1272 | $1,350 | $1.06 | 43d | 1 | 0.36mi |
| 3346 Agnes Ave Kansas City, MO | 3.0 | 1.0 | 1400 | $1,200 | $0.86 | 7d | 1 | 0.40mi |
| 3437 Jackson Ave Kansas City, MO | 2.0 | 1.0 | 700 | $1,150 | $1.64 | 16d | 1 | 0.40mi |
| 3630 Agnes Ave Kansas City, MO | 3.0 | 2.0 | 1448 | $1,500 | $1.04 | 10d | 1 | 0.42mi |
| 3330 Agnes Ave Kansas City, MO | 3.0 | 1.0 | 1000 | $1,410 | $1.41 | 43d | 1 | 0.42mi |
| 3818 Indiana Ave Kansas City, MO | 3.0 | 1.5 | 1223 | $1,147 | $0.94 | 43d | 1 | 0.42mi |
| 3304 Agnes Ave Unit Downstairs Kansas City, MO | 3.0 | 1.0 | 1150 | $1,095 | $0.95 | 43d | 1 | 0.45mi |
| 3840 Bellefontaine Ave Kansas City, MO | 3.0 | 1.0 | 1500 | $1,500 | $1.00 | 16d | 1 | 0.56mi |
| 3817 S Benton Ave Kansas City, MO | 4.0 | 1.5 | 1380 | $1,650 | $1.20 | 23d | 1 | 0.57mi |
| 4005 Bales Ave Kansas City, MO | 2.0 | 1.0 | 792 | $1,050 | $1.33 | 43d | 1 | 0.62mi |
| 3414 Elmwood Ave Kansas City, MO | 4.0 | 1.0 | 1109 | $1,300 | $1.17 | 16d | 1 | 0.63mi |
| 3736 Cypress Ave Kansas City, MO | 3.0 | 1.0 | 1100 | $1,200 | $1.09 | 7d | 1 | 0.65mi |
| 3220 E 30th St Unit 1A Kansas City, MO | 2.0 | 1.0 | 1214 | $950 | $0.78 | 43d | 1 | 0.69mi |
| 3710 Wabash Ave Unit 2S Kansas City, MO | 2.0 | 1.0 | 875 | $850 | $0.97 | 23d | 1 | 0.71mi |
| 4028 Myrtle Ave Kansas City, MO | 3.0 | 1.0 | 1100 | $1,490 | $1.35 | 43d | 1 | 0.73mi |
| 3233 Park Ave Unit 1 Kansas City, MO | 2.0 | 1.0 | 950 | $1,075 | $1.13 | 43d | 1 | 0.83mi |
| 3233 Park Ave Unit 2 Kansas City, MO | 2.0 | 1.0 | 950 | $1,000 | $1.05 | 23d | 1 | 0.83mi |
| 4116 Bellefontaine Ave Kansas City, MO | 3.0 | 1.0 | 1234 | $1,000 | $0.81 | 23d | 1 | 0.83mi |
| 3032 Elmwood Ave Kansas City, MO | 3.0 | 1.0 | 1027 | $1,275 | $1.24 | 7d | 1 | 0.84mi |
| 3902 Wabash Ave Kansas City, MO | 4.0 | 2.0 | 1400 | $1,850 | $1.32 | 43d | 1 | 0.84mi |
| 3841 Olive St Kansas City, MO | 2.0 | 1.0 | 792 | $985 | $1.24 | 14d | 1 | 0.84mi |
| 4144 College Ave Kansas City, MO | 3.0 | 1.0 | 1108 | $1,095 | $0.99 | 23d | 1 | 0.86mi |
| 2637 E 29th St Unit 3 Kansas City, MO | 2.0 | 1.0 | 954 | $1,050 | $1.10 | 43d | 1 | 0.87mi |
| 3118 Chelsea Ave Kansas City, MO | 2.0 | 1.0 | 864 | $980 | $1.13 | 43d | 1 | 0.87mi |
| 4216 Cleveland Ave Kansas City, MO | 2.0 | 1.0 | 780 | $1,125 | $1.44 | 16d | 1 | 0.90mi |
| 4902 E 39th St Kansas City, MO | 2.0 | 1.0 | 820 | $1,300 | $1.59 | 16d | 1 | 0.92mi |
| 2002 E 35th St Kansas City, MO | 3.0 | 2.0 | 1426 | $1,295 | $0.91 | 7d | 1 | 0.96mi |
| 2120 Linwood Blvd Kansas City, MO | 3.0 | 1.0 | 1326 | $1,400 | $1.06 | 43d | 1 | 0.97mi |
| 4309 College Ave Kansas City, MO | 3.0 | 2.0 | 1040 | $1,550 | $1.49 | 16d | 1 | 1.02mi |
| 4014 Park Ave Kansas City, MO | 3.0 | 2.0 | 1271 | $1,273 | $1.00 | 43d | 1 | 1.03mi |
| 4107 Olive St Kansas City, MO | 3.0 | 1.5 | 1271 | $1,578 | $1.24 | 7d | 1 | 1.03mi |
| 2305 E 41st St Kansas City, MO | 2.0 | 1.0 | 750 | $1,000 | $1.33 | 7d | 1 | 1.07mi |
| 2701 Benton Blvd Unit 2703-2 Kansas City, MO | 2.0 | 1.0 | 800 | $1,200 | $1.50 | 1d | 1 | 1.08mi |
| 2701 Benton Blvd Unit 2705-3 Kansas City, MO | 2.0 | 1.0 | 800 | $1,200 | $1.50 | 7d | 1 | 1.08mi |
| 3009 Garfield Ave Kansas City, MO | 3.0 | 1.5 | 1334 | $1,425 | $1.07 | 43d | 1 | 1.09mi |
Listing history 20 events
-
2026-06-18days on market $148,500 Active 30 DOM
-
2026-06-17days on market $148,500 Active 29 DOM
-
2026-06-16days on market $148,500 Active 28 DOM
-
2026-06-15days on market $148,500 Active 27 DOM
-
2026-06-13days on market $148,500 Active 25 DOM
-
2026-06-09days on market $148,500 Active 21 DOM
-
2026-06-08days on market $148,500 Active 20 DOM
-
2026-06-07days on market $148,500 Active 19 DOM
-
2026-06-05days on market $148,500 Active 16 DOM
-
2026-06-03days on market $148,500 Active 15 DOM
-
2026-06-02days on market $148,500 Active 14 DOM
-
2026-06-01days on market $148,500 Active 13 DOM
-
2026-05-31days on market $148,500 Active 12 DOM
-
2026-05-19$148,500 Active
-
2026-05-17historical
-
2026-05-11price $148,500
-
2026-04-02$150,000 Active
-
2026-03-23historical
-
2024-09-03soldstatus
-
2024-07-18soldstatus
ⓘ Source: listings_history table (triggers on properties + properties_extension) + one-shot
backfill from property_details.listing_events for pre-trigger history.
Tax reassessment forecast MO · Resets to sale price
- Current annual tax
- $527 · $44/mo
- Projected year-2 tax
- $1,440 · $120/mo
- Expected delta
- +$914/yr (+$76/mo · 173.4%)
ⓘ Screening estimate from a state-policy table — verify with the county assessor before closing.
Climate risk First Street
- Flood 1/10 Low FEMA zone X (unshaded) · 0% chance over 30 yrs
- Wildfire 1/10 Low
- Heat 4/10 Moderate 7 d/yr ≥107°F today · 17 d/yr by 30 yrs out
- Wind 2/10 Low
- Air quality 3/10 Moderate 2 unhealthy d/yr today · 3 by 30 yrs out
Nearby sold comps map
Loading sold comps map…
Walkable amenities ~0.75 mi
Loading nearby amenities…
Taxation est. · year 1
- Rental income
- $15,871
- − Mortgage interest
- −$8,318
- − Property taxes
- −$527
- − Insurance
- −$742
- − Repairs & maintenance
- −$1,270
- − Management
- −$1,270
- − Depreciation
- −$4,320
- Taxable loss
- −$576
- Est. tax savings @ 24.0%
- +$138
- After-tax cash flow
- $2,062/yr
For passive investors: Depreciation is non-cash, so a rental often shows a tax loss while cash-flowing — sheltering income. Rental losses are passive: they offset passive income freely, and up to $25,000/yr can offset ordinary (W-2) income if you actively participate and your MAGI is under $100k (phasing out to $0 by $150k); unused losses carry forward. On sale, claimed depreciation is recaptured at up to 25%, and gains may owe capital-gains tax (a 1031 exchange can defer both). Figures are a year-1 estimate at your 24.0% rate — not tax advice; consult a CPA.
Schools (NCES district)
- District
- Kansas City 33
- NCES district ID
- 2916400
- Math proficiency
- 12% ▼ -8.00%
- Reading proficiency
- 24% ▬ 0.00%
- Median HH income
- $35,227
- Composite
- 14.8/100
- National rank
- #9387
- State rank
- #308 of 324 in MO
Livability — Kansas City
- Score
- 78/100
- State rank
- #28
- US rank
- #2671
Category grades
Schools grade is shown separately in the Schools card above.
Census & demographics
- Census place
- Kansas City, MO
- County
- Jackson County · 687,798 people
- City population
- 439,467
- Metro
- Kansas City, MO-KS
- Population (ZIP)
- 11,912
- Household income
- $36,088
- Rent vs Own
- Severe rent burden
- 946.0
Population outlook (Jackson County) Hauer SSP2
- Today (2025)
- 719,589 people
- By 2030
- 731,456 · +1.6%
- By 2040
- 746,689 · +3.8%
- By 2050
- 749,289 · +4.1%
- By 2075
- 736,227 · +2.3%
- By 2100
- 668,210 · -7.1%
Race, ethnicity, and origin ACS 2023
- Neighborhood character
- Predominantly Black (79%)
- Race & ethnicity
- Black 79% Hispanic / Latino 9% White 8% Two or more races 7%
- Hispanic origin (detail)
- Mexican 6%
- Common ancestry
- Swedish 1% Hispanic 1%
- Foreign-born
- 7% · Canada
- Languages at home
- 88% English-only · Spanish 7% French/Haitian/Cajun 2%
Political lean MEDSL · Jackson
- 2024 margin
- D (+19.3) · D 58.9% · R 39.5% · Other 1.6%
- 2008→2024 swing
- -6.1pp toward R · 2008: 25.4pp · 2024: 19.3pp
- All cycles
- 2024: D+19.3 2020: D+22.0 2016: D+16.6 2012: D+19.0 2008: D+25.4
Not yet ingested
- Civics
- —
Market trends
- HPI YoY
- ▲ 73.41%
- Current HPI
- 412.6862
- Rent YoY
- ▲ 4.65%
- Metro
- Kansas City, MO-KS
- State GDP YoY
- ▲ 1.84%
- F500 in state
- 20
Industry mix (Fortune 500 HQ in MO)
| Industry | F500 HQs | Revenue |
|---|---|---|
| Healthcare | 1 | $163B |
|
||
| Insurance | 1 | $21B |
|
||
| Industrial Technology | 1 | $17B |
|
||
| Retail | 1 | $16B |
|
||
| Industrial Distribution | 1 | $10B |
|
||
| Utilities | 1 | $9B |
|
||
Price history
-1.0% since first listed7 events — show timeline
- 2026-05-19 Listed $148,500 Heartland MLS as Distributed by MLS Grid
- 2026-05-17 Listing Removed — Heartland MLS as Distributed by MLS Grid
- 2026-05-11 Price Changed $148,500 Heartland MLS as Distributed by MLS Grid
- 2026-04-02 Listed $150,000 Heartland MLS as Distributed by MLS Grid
- 2026-03-23 Coming Soon — Heartland MLS as Distributed by MLS Grid
- 2024-09-03 Sold (Public Records) — Public Records
- 2024-07-18 Sold (Public Records) — Public Records
Property tax history
+4.4%/yrLatest (2025): $527 · +7.8% YoY. Source: county tax records.
Cash-flow waterfall
monthlySold comps — $/sqft
last 12 mo · ≤1 miLoading sold comps…