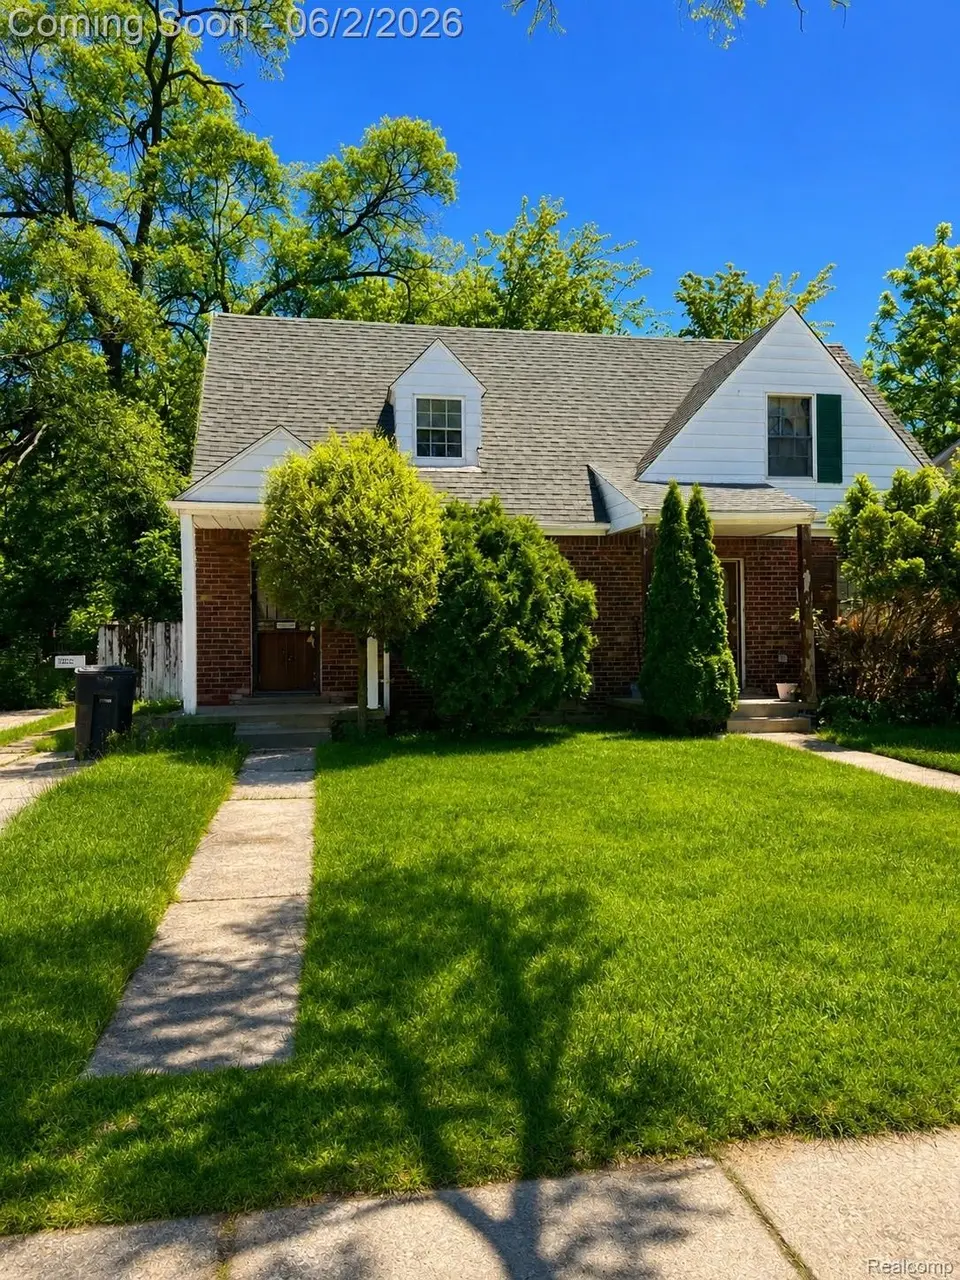
12664 Kelly Rd · Detroit, MI
Flood risk 1/10 · Minimal
- FEMA flood zone
- X (unshaded)
- Chance of flooding over 30 yrs
- 0.0%
- Est. flood insurance / yr
- $473 – $860
Fire risk 1/10 · Minimal
- Est. fire insurance / yr
- $784 – $1,456
Heat risk 3/10 · Minor
- Hot days now (above 95°F)
- 7 days/yr
- Hot days in 30 yrs
- 15 days/yr
Wind risk 2/10 · Minimal
- Chance of severe wind over 30 yrs
- —
Air-quality risk 3/10 · Minor
- Unhealthy air days now
- 2 days/yr
- Unhealthy air days in 30 yrs
- 5 days/yr
Risk factors via First Street. Map © Google.
Why this score? — see what drove the B- grade
The composite is a weighted blend of 9 inputs, each scored 0–100. Each bar is that input's sub-score; the figure is the points it added to the 100-point composite (weight × sub-score).
- Cash flow +30.0/30.0
- 1% rule +10.0/10.0
- DSCR +10.0/10.0
- ARV discount +7.9/15.0
- Livability +3.7/5.0
- Rent growth +2.7/5.0
- Condition / age +2.5/5.0
- Schools +1.3/10.0
- Appreciation +0.0/10.0
$35,000
🖨 Deal sheet 📄 Offer letter ✓ Due diligence
Listing remarks MLS
Investor special with serious upside in Detroit's east side corridor. This brick townhouse-style property has been held by the same owner/family for decades and is a prime opportunity for a savvy rental investor or rehabber looking to add value and build long-term cash flow. Featuring solid bones, classic character, and strong rental potential, this property is ready for transformation. Located near major commuter routes, schools, and neighborhood amenities, the area continues to see investor activity and redevelopment momentum. Whether you're looking for your next BRRRR project, Section 8 rental, or affordable addition to your portfolio, this is the kind of deal investors chase, low entry point with room to force appreciation and maximize returns. Bring your vision and unlock the potential. Opportunities at this price point are getting harder to find. Sold as-is. Buyer to verify all information.
Key facts
- 3,920 sq ft lot
- Built 1944
- Listed 16 days
Property features AI
Exterior
- Parking: No garage
- Utilities: Public water; Public sewer
- Home design: Single-family residence; Residential property; Brick construction; Entry on ground level; Two-story
- Construction: Brick exterior; Block foundation
- Exterior features: Paved road access; Lot approximately 0.09 acres (30 x 131)
Interior
- Bathrooms: 1 full bathroom
- Heating & cooling: Forced air heating (natural gas); No cooling
- Interior features: Unfinished basement; Two levels; Ground-level entry with steps; Total of 2 rooms
Neighborhood map
What this means for you Summary
Snapshot
- This is a 2-bed/1.0-bath single-family listed at $35k.
Deal economics
- At list price, monthly cash flow is $707 ($8k/yr) — positive.
- The deal already cash-flows at list — no discount required.
- Meets the 1% rule at list price ($1k rent vs $35k).
- Recommended offer: $34k (1.5% below list) — sets the bar for market timing.
- Cap rate 30.5% vs local median 10.2% in Detroit — top-decile yield for the area; either an underpriced asset or a hidden risk that comps aren't pricing in. Stress-test before assuming the spread holds.
Location & tenants
- Location reads 73/100 on livability (#218 in MI) — a middle-class / working-renter tenant base. Strengths: amenities A+, commute A+, cost of living A+; Watch: schools F, crime F, employment F.
- Detroit Public Schools Community District (urban): math 10% / reading 24% proficiency, ranked #499 of 540 in MI (top 92%) — low school quality limits family demand, transient renter base, plan for 1-2y turnover; 90% free/reduced lunch — lower-income household profile, screen leases tightly.
- Market conditions: Rents flat; 484 active listings in the ZIP; 40 comparable units currently listed for rent nearby; rentals at typical pace (median 25d on market — plan ~3-4 weeks tenant-placement turnaround); 45% of comp listings sitting > 30 days — soft ceiling on asking rent; lower-income renter base — watch delinquency; 2,639 units permitted in Wayne County in 2024 (1,216 in 5+ unit buildings).
- This rent runs 32% of the median local income ($45k/yr) — at the standard rent-burdened threshold; future hikes will face affordability resistance.
Forward outlook
- Local home prices are declining (-3.0%/yr); year-one equity from $242 of loan paydown is wiped out by about $1k of value loss. Plan a longer hold.
- Wayne County population projected at -17% by 2050 — secular population decline; favor cash flow + early exit over multi-decade hold.
- At projected returns (-3.0% appreciation + 0.7% rent growth), your $10k cash investment doubles in ~2 years — after that, you're playing with house money.
Negotiation context
- It's been on market 17 days — a 2% lower offer ($34k) is reasonable based on typical stale-listing flexibility.
- 2 sale attempts; this cycle's ask has dropped $5k (12%) from the opening price — seller is motivated, your offer sets the floor, not the list.
- Current owner paid $10k; list at $35k implies a 268% gain — meaningful room to come down on a strong offer.
Risks & watch-outs
- Watch-outs: built in 1944 — expect roof / HVAC / electrical / plumbing capex.
Questions for the listing agent
- Built in 1944 — when were the roof, HVAC, electrical panel, plumbing, and water heater last replaced?
- Is there a deadline driving the sale (1031 exchange, divorce, estate, relocation)? That informs how much negotiation room exists.
- Schools are F-rated, which usually means shorter tenancies and higher turnover. Who's the typical renter profile here, and what's been the actual vacancy rate?
- Crime grade is F in this area — have there been break-ins, vandalism, or insurance claims at this property in the last 3 years? What carrier currently insures it and at what premium?
- What's the average days-on-market for RENTAL listings here right now (not sales)? A rising rental-DOM trend means longer vacancies and softer asking-rent achievability than the comps imply.
- What's the recent tenant-quality profile in this submarket — average credit score on applications, eviction rate, late-payment / NSF rate, and stable-employment percentage? A property-management company in the area should have these aggregated.
- How much new for-sale + rental construction is in the pipeline within 1–3 miles? Heavy new supply typically softens prices + rents 12–24 months out; constrained supply supports both.
Investment metrics
- 1% rule
- 3.43% ✓
- Cap rate
- 30.55%
- Cash-on-cash
- 86.63%
- DSCR
- 4.85
- GRM
- 2.4
CMA / ARV
- ARV (on-the-fly)
- $35,280
- Comps found
- 12
Show comp detail 12 sales within ~0.75 mi
| Address | Dist | Beds/Ba | Sqft | Sold | Price | $/sf | Match |
|---|---|---|---|---|---|---|---|
| 12641 Kelly Rd | 0.04mi | 2/1.0 | 840 (0%) | 4mo | $15,000 | $18 | 94 |
| 14981 Flanders St | 0.35mi | 2/1.0 | 755 (-10%) | 1mo | $30,005 | $40 | 66 |
| 15001 Flanders St | 0.34mi | 2/1.0 | 769 (-8%) | 6mo | $80,000 | $104 | 65 |
| 11974 Duchess St | 0.24mi | 2/1.0 | 724 (-14%) | 5mo | $37,000 | $51 | 62 |
| 10670 Nottingham Rd | 0.73mi | 2/1.0 | 827 (-2%) | 5mo | $35,000 | $42 | 60 |
| 12056 Duchess St | 0.29mi | 3/1.0 (+1) | 950 (+13%) | 3mo | $30,000 | $32 | 57 |
| 11624 Wayburn St | 0.51mi | 3/1.0 (+1) | 756 (-10%) | 3mo | $17,000 | $22 | 53 |
| 15260 Faircrest St | 0.61mi | 2/1.0 | 942 (+12%) | 1mo | $35,000 | $37 | 51 |
| 15596 Eastwood St | 0.68mi | 3/1.0 (+1) | 886 (+6%) | 6mo | $60,000 | $68 | 49 |
| 11475 Lakepointe St | 0.61mi | 2/1.0 | 953 (+14%) | 3mo | $95,000 | $100 | 46 |
| 12505 Laing St | 0.69mi | 3/1.0 (+1) | 752 (-10%) | 3mo | $54,600 | $73 | 42 |
| 12843 Payton St | 0.70mi | 3/1.0 (+1) | 934 (+11%) | 4mo | $38,000 | $41 | 40 |
Match score weights: distance 35% · size 25% · config 20% · recency 20%. Top-matched comps best support the ARV.
Projected returns pro-forma
-3.0% appreciation · 0.73% rent growth · sell at horizon
- IRR
- 84.6%
- Equity multiple
- 4.75×
- Total profit
- $36,721
- Equity at exit
- $5,219
- IRR
- 87.2%
- Equity multiple
- 9.12×
- Total profit
- $79,548
- Equity at exit
- $3,026
Cash invested: $9,800 (down + closing). Projections, not guarantees.
Landlord ↔ Tenant lean methodology
- Overall (STATE)
- 62 Landlord-Friendly
- State Michigan
- 62 Landlord-Friendly · EVEN
- County
- — inherits STATE
- City
- — inherits STATE
ZIP-level market 48224
- Rents YoY
- 0.7%
- Active inventory
- 484
- Price-to-rent
- 2.4×
Monthly cashflow live
- Estimated rent
- $1,202 high interval (Pro) →
- Mortgage (P&I)
- −$184
- Tax from tax record
- −$44 /mo · $524/yr
- Insurance
- −$15
- HOA
- −$0
- Vacancy / Maint / Mgmt
- −$252
- Net cashflow
- $707
Break-even live
UW: 25.0% down · 7.5% · 30yr · 1.5% tax · 5.0% vac · 8.0% maint · 8.0% mgmt
Financing live
Cash to close
- Down payment
- $8,750
- Closing costs
- $1,050
- Reserves months
- —
- Total cash needed
- —
Loan-product check · same deal, 3 products live
Conventional
25% down · 7.5% · 30yr
- Down + closing
- —
- Monthly P&I
- —
- Monthly cashflow
- —
- DSCR
- —
- Eligible?
- —
Personal DTI + credit; lowest rate.
DSCR
20% down · 8.5% · 30yr
- Down + closing
- —
- Monthly P&I
- —
- Monthly cashflow
- —
- DSCR
- —
- Eligible?
- —
No personal income docs; deal must DSCR.
Hard money
10% down · 12.0% · 12mo
- Down + closing
- —
- Monthly P&I
- —
- Monthly cashflow
- —
- DSCR
- —
- Eligible?
- —
Short-term bridge; refi at stabilization.
Rent comps 40 comps
| Address | Beds | Baths | Sqft | Rent | $/sqft | DOM | Units | Dist |
|---|---|---|---|---|---|---|---|---|
| 15010 Cedargrove St Detroit, MI | 3.0 | 1.5 | 1018 | $1,350 | $1.33 | 44d | 1 | 0.34mi |
| 15494 Mapleridge St Detroit, MI | 3.0 | 1.0 | 937 | $1,275 | $1.36 | 44d | 1 | 0.34mi |
| 12201 Morang Ave Unit 8 Detroit, MI | 2.0 | 1.0 | 610 | $875 | $1.43 | 44d | 1 | 0.44mi |
| 11235 Roxbury St Detroit, MI | 3.0 | 1.0 | 1062 | $1,325 | $1.25 | 17d | 1 | 0.62mi |
| 10644 Stratman St Detroit, MI | 2.0 | 1.0 | 1000 | $1,200 | $1.20 | 17d | 1 | 0.63mi |
| 11611 Morang Ave Detroit, MI | 1.0–2.0 | 1.0 | 709 | $1,040 | $1.47 | 44d | 1 | 0.64mi |
| 12716 Riad St Detroit, MI | 3.0 | 1.0 | 974 | $1,275 | $1.31 | 17d | 1 | 0.67mi |
| 11776 Rossiter St Detroit, MI | 3.0 | 1.0 | 964 | $1,150 | $1.19 | 11d | 1 | 0.70mi |
| 11529 Roxbury St Detroit, MI | 2.0 | 1.0 | 720 | $1,200 | $1.67 | 12d | 1 | 0.74mi |
| 10404 Somerset Ave Detroit, MI | 3.0 | 1.0 | 1108 | $1,475 | $1.33 | 3d | 1 | 0.80mi |
| 10141 Roxbury St Detroit, MI | 3.0 | 1.0 | 1115 | $1,000 | $0.90 | 44d | 1 | 0.83mi |
| 12075 Rossiter St Detroit, MI | 3.0 | 1.0 | 1100 | $1,245 | $1.13 | 15d | 1 | 0.86mi |
| 12075 Rossiter St Detroit, MI | 3.0 | 1.0 | 1100 | $1,245 | $1.13 | 44d | 1 | 0.86mi |
| 19144 Moross Rd Detroit, MI | 2.0 | 1.0 | 900 | $1,050 | $1.17 | 44d | 1 | 0.91mi |
| 15909 Maddelein St Detroit, MI | 3.0 | 1.0 | 894 | $1,266 | $1.42 | 44d | 1 | 0.91mi |
| 9927 Beaconsfield St Detroit, MI | 3.0 | 1.0 | 942 | $1,375 | $1.46 | 15d | 1 | 0.92mi |
| 16241 Seven Mile E Unit 4 Detroit, MI | 1.0 | 1.0 | 650 | $650 | $1.00 | 44d | 1 | 0.93mi |
| 9516 Wayburn St Detroit, MI | 2.0 | 1.0 | 800 | $950 | $1.19 | 17d | 1 | 0.94mi |
| 16212 Maddelein St Detroit, MI | 2.0 | 1.0 | 800 | $1,200 | $1.50 | 12d | 1 | 0.95mi |
| 14103 Rochelle Ave Unit 3 Detroit, MI | 1.0 | 1.0 | 700 | $800 | $1.14 | 44d | 1 | 0.95mi |
| 10177 Boleyn St Detroit, MI | 3.0 | 1.0 | 767 | $1,250 | $1.63 | 44d | 1 | 0.98mi |
| 9747 Somerset Ave Detroit, MI | 2.0 | 1.0 | 797 | $1,100 | $1.38 | 44d | 1 | 0.99mi |
| 10400 Britain St Detroit, MI | 3.0 | 1.0 | 890 | $1,100 | $1.24 | 44d | 1 | 1.00mi |
| 10037 Grayton St Detroit, MI | 3.0 | 1.0 | 1000 | $1,400 | $1.40 | 3d | 1 | 1.02mi |
| 10370 Britain St Detroit, MI | 3.0 | 1.0 | 1100 | $1,100 | $1.00 | 44d | 1 | 1.02mi |
| 10692 Meuse St Detroit, MI | 3.0 | 1.0 | 955 | $1,250 | $1.31 | 12d | 1 | 1.03mi |
| 19639 Moross Rd Unit 1 Detroit, MI | 2.0 | 1.0 | 900 | $1,100 | $1.22 | 44d | 1 | 1.12mi |
| 14461 Lappin St Detroit, MI | 3.0 | 1.5 | 989 | $1,150 | $1.16 | 17d | 1 | 1.13mi |
| 19442 Kingsville St Harper Woods, MI | 3.0 | 1.0 | 1000 | $1,500 | $1.50 | 17d | 1 | 1.13mi |
| 9140 Whittier Ave Unit 1 Detroit, MI | 1.0 | 1.0 | 550 | $700 | $1.27 | 44d | 1 | 1.14mi |
| 13400 Longview St Detroit, MI | 3.0 | 1.5 | 1000 | $1,400 | $1.40 | 44d | 1 | 1.14mi |
| 9190 Hayes St Unit 1 Detroit, MI | 2.0 | 1.0 | 750 | $850 | $1.13 | 15d | 1 | 1.18mi |
| 10985 Peerless St Detroit, MI | 3.0 | 1.0 | 1000 | $1,364 | $1.36 | 5d | 1 | 1.24mi |
| 13137 Elmdale St Detroit, MI | 3.0 | 1.0 | 1115 | $1,400 | $1.26 | 24d | 1 | 1.27mi |
| 13503 E McNichols Rd Unit 7 Detroit, MI | 1.0 | 1.0 | 750 | $800 | $1.07 | 18d | 1 | 1.28mi |
| 19152 Woodside St Harper Woods, MI | 3.0 | 1.0 | 916 | $1,500 | $1.64 | 17d | 1 | 1.29mi |
| 19982 McCormick St Detroit, MI | 3.0 | 1.0 | 866 | $1,200 | $1.39 | 3d | 1 | 1.29mi |
| 19661 Kenosha St Harper Woods, MI | 3.0 | 2.0 | 1000 | $1,400 | $1.40 | 24d | 1 | 1.31mi |
| 12740 August St Detroit, MI | 2.0 | 1.0 | 900 | $1,300 | $1.44 | 5d | 1 | 1.34mi |
| 15030 Rossini Dr Unit 2 Detroit, MI | 1.0 | 1.0 | 720 | $800 | $1.11 | 44d | 1 | 1.37mi |
Listing history 12 events
-
2026-06-18days on market $35,000 Active 17 DOM
-
2026-06-17days on market $35,000 Active 16 DOM
-
2026-06-15days on market $35,000 Active 14 DOM
-
2026-06-13days on market $35,000 Active 12 DOM
-
2026-06-13pricedays on market $35,000 Active 11 DOM
-
2026-06-09days on market $40,000 Active 8 DOM
-
2026-06-08days on market $40,000 Active 7 DOM
-
2026-06-07days on market $40,000 Active 6 DOM
-
2026-06-04days on market $40,000 Active 3 DOM
-
2026-06-03days on market $40,000 Active 2 DOM
-
2026-06-02remarks 687-char remark
Show marketing remark (909 chars)
Investor special with serious upside in Detroit's east side corridor. This brick townhouse-style property has been held by the same owner/family for decades and is a prime opportunity for a savvy rental investor or rehabber looking to add value and build long-term cash flow. Featuring solid bones, classic character, and strong rental potential, this property is ready for transformation. Located near major commuter routes, schools, and neighborhood amenities, the area continues to see investor activity and redevelopment momentum. Whether you're looking for your next BRRRR project, Section 8 rental, or affordable addition to your portfolio, this is the kind of deal investors chase, low entry point with room to force appreciation and maximize returns. Bring your vision and unlock the potential. Opportunities at this price point are getting harder to find. Sold as-is. Buyer to verify all information.
-
2026-06-02$40,000 Active 1 DOM
Show marketing remark (909 chars)
Investor special with serious upside in Detroit's east side corridor. This brick townhouse-style property has been held by the same owner/family for decades and is a prime opportunity for a savvy rental investor or rehabber looking to add value and build long-term cash flow. Featuring solid bones, classic character, and strong rental potential, this property is ready for transformation. Located near major commuter routes, schools, and neighborhood amenities, the area continues to see investor activity and redevelopment momentum. Whether you're looking for your next BRRRR project, Section 8 rental, or affordable addition to your portfolio, this is the kind of deal investors chase, low entry point with room to force appreciation and maximize returns. Bring your vision and unlock the potential. Opportunities at this price point are getting harder to find. Sold as-is. Buyer to verify all information.
ⓘ Source: listings_history table (triggers on properties + properties_extension) + one-shot
backfill from property_details.listing_events for pre-trigger history.
Tax reassessment forecast MI · Partial reset (capped growth)
- Current annual tax
- $524 · $44/mo
- Projected year-2 tax
- $531 · $44/mo
- Expected delta
- +$8/yr (+$1/mo · 1.5%)
ⓘ Screening estimate from a state-policy table — verify with the county assessor before closing.
Climate risk First Street
- Flood 1/10 Low FEMA zone X (unshaded) · 0% chance over 30 yrs
- Wildfire 1/10 Low
- Heat 3/10 Moderate 7 d/yr ≥95°F today · 15 d/yr by 30 yrs out
- Wind 2/10 Low
- Air quality 3/10 Moderate 2 unhealthy d/yr today · 5 by 30 yrs out
Nearby sold comps map
Loading sold comps map…
Walkable amenities ~0.75 mi
Loading nearby amenities…
Taxation est. · year 1
- Rental income
- $14,419
- − Mortgage interest
- −$1,961
- − Property taxes
- −$524
- − Insurance
- −$175
- − Repairs & maintenance
- −$1,153
- − Management
- −$1,153
- − Depreciation
- −$1,018
- Taxable income
- $8,434
- Est. tax owed @ 24.0%
- −$2,024
- After-tax cash flow
- $6,465/yr
For passive investors: Depreciation is non-cash, so a rental often shows a tax loss while cash-flowing — sheltering income. Rental losses are passive: they offset passive income freely, and up to $25,000/yr can offset ordinary (W-2) income if you actively participate and your MAGI is under $100k (phasing out to $0 by $150k); unused losses carry forward. On sale, claimed depreciation is recaptured at up to 25%, and gains may owe capital-gains tax (a 1031 exchange can defer both). Figures are a year-1 estimate at your 24.0% rate — not tax advice; consult a CPA.
Schools (NCES district)
- District
- Detroit Public Schools Community District
- NCES district ID
- 2601103
- Math proficiency
- 10% ▼ -2.00%
- Reading proficiency
- 24% ▲ 6.00%
- Median HH income
- $25,815
- Composite
- 13.06/100
- National rank
- #9564
- State rank
- #499 of 540 in MI
Livability — Detroit
- Score
- 73/100
- State rank
- #218
- US rank
- #5427
Category grades
Schools grade is shown separately in the Schools card above.
Census & demographics
- Census place
- Detroit, MI
- County
- Wayne County · 1,562,939 people
- City population
- 572,865
- Metro
- Detroit-Warren-Dearborn, MI
- Population (ZIP)
- 39,668
- Household income
- $44,856
- Rent vs Own
- Severe rent burden
- 2515.0
Population outlook (Wayne County) Hauer SSP2
- Today (2025)
- 1,675,273 people
- By 2030
- 1,620,300 · -3.3%
- By 2040
- 1,502,341 · -10.3%
- By 2050
- 1,384,039 · -17.4%
- By 2075
- 1,124,592 · -32.9%
- By 2100
- 881,193 · -47.4%
Race, ethnicity, and origin ACS 2023
- Neighborhood character
- Predominantly Black (88%)
- Race & ethnicity
- Black 88% White 8% Two or more races 3% Hispanic / Latino 1%
- Common ancestry
- Iranian 1% Romanian 1% Lithuanian 1%
- Foreign-born
- 1%
- Languages at home
- 97% English-only · Spanish 2%
Political lean MEDSL · Wayne
- 2024 margin
- Strong D (+29.0) · D 62.7% · R 33.7% · Other 3.6%
- 2008→2024 swing
- -20.5pp toward R · 2008: 49.5pp · 2024: 29.0pp
- All cycles
- 2024: D+29.0 2020: D+38.1 2016: D+37.3 2012: D+46.9 2008: D+49.5
Not yet ingested
- Civics
- —
Market trends
- HPI YoY
- ▼ -226.38%
- Current HPI
- 161.886
- Rent YoY
- ▲ 0.73%
- Metro
- Detroit-Warren-Dearborn, MI
- State GDP YoY
- ▲ 1.37%
- F500 in state
- 28
Industry mix (Fortune 500 HQ in MI)
| Industry | F500 HQs | Revenue |
|---|---|---|
| Automotive Parts | 3 | $48B |
|
||
| Automotive | 2 | $372B |
|
||
| Chemicals | 1 | $45B |
|
||
| Automotive Retail | 1 | $29B |
|
||
| Healthcare / Medical Devices | 1 | $23B |
|
||
| Automotive Technology | 1 | $20B |
|
||
Price history
+321.1% since first listed4 events — show timeline
- 2026-06-02 Listed $40,000 MiRealSource-MiMLS
- 2026-06-02 Listed $40,000 REALCOMP
- 2026-06-01 Coming Soon $40,000 MiRealSource-MiMLS
- 1996-01-23 Sold (Public Records) $9,500 Public Records
Property tax history
-1.9%/yrLatest (2025): $524 · -34.9% YoY. Source: county tax records.
Cash-flow waterfall
monthlySold comps — $/sqft
last 12 mo · ≤1 miLoading sold comps…