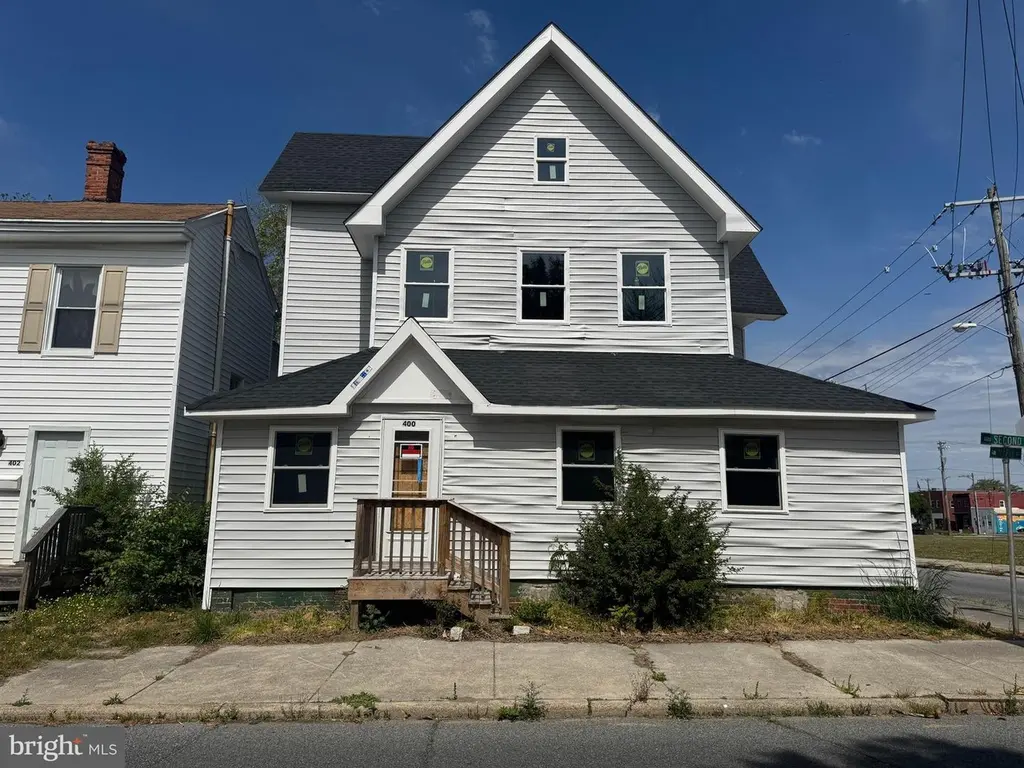
400 2nd St · Pocomoke City, MD
Flood risk 1/10 · Minimal
- FEMA flood zone
- X (unshaded)
- Chance of flooding over 30 yrs
- 0.0%
- Est. flood insurance / yr
- $507 – $1,088
Fire risk 3/10 · Minor
- Est. fire insurance / yr
- $755 – $1,403
Heat risk 8/10 · Major
- Hot days now (above 102°F)
- 7 days/yr
- Hot days in 30 yrs
- 18 days/yr
Wind risk 8/10 · Major
- Chance of severe wind over 30 yrs
- 80.0%
Air-quality risk 2/10 · Minimal
- Unhealthy air days now
- 1 days/yr
- Unhealthy air days in 30 yrs
- 1 days/yr
Risk factors via First Street. Map © Google.
Why this score? — see what drove the B+ grade
The composite is a weighted blend of 9 inputs, each scored 0–100. Each bar is that input's sub-score; the figure is the points it added to the 100-point composite (weight × sub-score).
- Cash flow +30.0/30.0
- ARV discount +15.0/15.0
- 1% rule +10.0/10.0
- DSCR +10.0/10.0
- Livability +3.6/5.0
- Schools +3.3/10.0
- Rent growth +2.5/5.0
- Condition / age +2.5/5.0
- Appreciation +0.0/10.0
$79,900
🖨 Deal sheet 📄 Offer letter ✓ Due diligence
Listing remarks MLS
3 Bedroom 2 Bath with 1 car garage near downtown and Pocomoke River. There are 2 sheds connected to the detached garage. This house has good bones but needs major renovation. Owners are selling AS/IS and all furniture and contents of the house and sheds are staying. The house was winterized and power is on. Property is located across from the Old Armory/police station. Town is in process of razing building.
Key facts
- Corner location
- Framing updates
- Rear deck
Tags
Property features AI
Exterior
- Parking: Driveway
- Utilities: Public water; Public sewer
- Home design: Detached property; Frame/Stick built with vinyl siding
- Construction: Crawl space foundation
- Exterior features: Corner lot; Not in a federal flood zone; Above grade and below grade other structures
Interior
- Bedrooms: Three bedrooms on the upper level
- Bathrooms: Two full bathrooms (one on main level, one on the upper level)
- Interior features: Major rehab needed; No basement
Neighborhood map
What this means for you Summary
Snapshot
- This is a 3-bed/2.0-bath single-family listed at $80k.
Deal economics
- At list price, monthly cash flow is $830 ($10k/yr) — positive.
- The deal already cash-flows at list — no discount required.
- Meets the 1% rule at list price ($2k rent vs $80k).
- Recommended offer: $78k (3.0% below list) — sets the bar for market timing.
- Cap rate 18.8% vs local median 5.6% in Pocomoke City — top-decile yield for the area; either an underpriced asset or a hidden risk that comps aren't pricing in. Stress-test before assuming the spread holds.
Location & tenants
- Location reads 71/100 on livability (#157 in MD) — a middle-class / working-renter tenant base. Strengths: cost of living A+, health & safety A+, housing A-; Watch: employment D+, crime F, amenities F.
- Worcester County Public Schools (town): math 30% / reading 44% proficiency, ranked #6 of 24 in MD (top 25%) — families likely to look elsewhere, expect single-tenant / working-renter base with shorter leases.
- Zoned schools: Pocomoke Elementary (math 17% / reading 17%, grade F, #408 of 860 statewide, top 50%, 443 students, 76% FRL); Pocomoke Middle (math 22% / reading 29%, grade F, #97 of 225 statewide, top 46%, 448 students, 72% FRL); Pocomoke High (math 32% / reading 67%, grade D, #108 of 222 statewide, top 49%, 352 students, 70% FRL) — zoned schools average 73% FRL vs 39% district-wide (34 pts higher); higher-poverty schools than district average — tighter screening recommended.
- Market conditions: 69 active listings in the ZIP; 5 comparable units currently listed for rent nearby; rentals leasing fast (median 13d on market — plan ~1-2 weeks tenant-placement turnaround); 354 units permitted in Worcester County in 2024 (6 in 5+ unit buildings).
Forward outlook
- Local home prices are declining (-3.0%/yr); year-one equity from $552 of loan paydown is wiped out by about $2k of value loss. Plan a longer hold.
- Worcester County population projected to shrink 4% by 2050 — rents likely to lag national; underwrite the cash flow, not the appreciation.
- At projected returns (-3.0% appreciation + 3.0% rent growth), your $22k cash investment doubles in ~3 years — after that, you're playing with house money.
Negotiation context
- It's been on market 35 days — a 3% lower offer ($78k) is reasonable based on typical stale-listing flexibility.
- 3 sale attempts since 31y ago; this cycle's ask has dropped $10k (11%) from the opening price — seller is motivated, your offer sets the floor, not the list.
- Current owner paid $60k; 33% above their basis — modest negotiation headroom, anchor on the comps not their cost.
Risks & watch-outs
- Watch-outs: property tax is 3.7% of price; built in 1930 — expect roof / HVAC / electrical / plumbing capex.
- Climate carrying-cost: severe wind risk, 80% chance of damaging wind over 30y; extreme-heat days projected 7→18/yr by 2055 (HVAC capex compounding) — expect insurance premiums to compound above CPI over the hold.
Questions for the listing agent
- It's been on market 35 days. Have you received any prior offers? Is the seller open to a 3% concession, seller financing, or rate buy-down credit?
- Built in 1930 — when were the roof, HVAC, electrical panel, plumbing, and water heater last replaced?
- Property tax is high relative to price — has the assessment been appealed recently, and will the sale trigger a re-assessment?
- Is there a deadline driving the sale (1031 exchange, divorce, estate, relocation)? That informs how much negotiation room exists.
- Crime grade is F in this area — have there been break-ins, vandalism, or insurance claims at this property in the last 3 years? What carrier currently insures it and at what premium?
- What's the average days-on-market for RENTAL listings here right now (not sales)? A rising rental-DOM trend means longer vacancies and softer asking-rent achievability than the comps imply.
- What's the recent tenant-quality profile in this submarket — average credit score on applications, eviction rate, late-payment / NSF rate, and stable-employment percentage? A property-management company in the area should have these aggregated.
- How much new for-sale + rental construction is in the pipeline within 1–3 miles? Heavy new supply typically softens prices + rents 12–24 months out; constrained supply supports both.
Investment metrics
- 1% rule
- 2.42% ✓
- Cap rate
- 18.75%
- Cash-on-cash
- 44.50%
- DSCR
- 2.98
- GRM
- 3.4
CMA / ARV
- ARV (median comp)
- $152,917
- List price
- $79,900
- Delta
- -47.75%
- Verdict
- UNDERPRICED
- Comps
- 20 within 1.0 mi
Show comp detail 12 sales within ~0.75 mi
| Address | Dist | Beds/Ba | Sqft | Sold | Price | $/sf | Match |
|---|---|---|---|---|---|---|---|
| 610 Clarke Ave | 0.13mi | 3/1.5 | 1,799 (-5%) | 5mo | $127,000 | $71 | 79 |
| 615 Walnut St | 0.38mi | 3/2.0 | 1,862 (-2%) | 10mo | $205,000 | $110 | 71 |
| 618 Walnut St | 0.41mi | 3/3.0 | 1,952 (+3%) | 5mo | $260,000 | $133 | 68 |
| 8 2nd St | 0.19mi | 3/2.5 | 2,108 (+11%) | 8mo | $299,500 | $142 | 64 |
| 18 Greenway Ave | 0.52mi | 3/2.0 | 1,783 (-6%) | 4mo | $290,000 | $163 | 63 |
| 604 Clarke Ave | 0.11mi | 4/3.5 (+1) | 2,100 (+11%) | 6mo | $245,000 | $117 | 61 |
| 907 2nd | 0.46mi | 4/2.5 (+1) | 1,848 (-2%) | 13mo | $211,500 | $114 | 56 |
| 324 Winter Quarters Dr | 0.67mi | 4/2.5 (+1) | 1,890 (-0%) | 12mo | $287,000 | $152 | 51 |
| 1005 Market St | 0.74mi | 3/3.5 | 1,893 (-0%) | 12mo | $321,000 | $170 | 49 |
| 604 Market St | 0.34mi | 4/2.0 (+1) | 2,144 (+13%) | 11mo | $250,000 | $117 | 48 |
| 709 Walnut St | 0.47mi | 4/2.0 (+1) | 1,624 (-14%) | 12mo | $196,000 | $121 | 39 |
| 909 Market St | 0.67mi | 3/2.0 | 2,176 (+15%) | 10mo | $270,000 | $124 | 36 |
Match score weights: distance 35% · size 25% · config 20% · recency 20%. Top-matched comps best support the ARV.
Projected returns pro-forma
-3.0% appreciation · 3.0% rent growth · sell at horizon
- IRR
- 41.6%
- Equity multiple
- 2.79×
- Total profit
- $40,007
- Equity at exit
- $11,913
- IRR
- 47.8%
- Equity multiple
- 5.62×
- Total profit
- $103,351
- Equity at exit
- $6,908
Cash invested: $22,372 (down + closing). Projections, not guarantees.
Landlord ↔ Tenant lean methodology
- Overall (STATE)
- 27 Tenant-Leaning
- State Maryland
- 27 Tenant-Leaning · D+14
- County
- — inherits STATE
- City
- — inherits STATE
ZIP-level market 21851
- Home prices YoY
- -4.0%
- Active inventory
- 69
- Price-to-rent
- 3.4×
Monthly cashflow live
- Estimated rent
- $1,931 high interval (Pro) →
- Mortgage (P&I)
- −$419
- Tax from tax record
- −$244 /mo · $2,925/yr
- Insurance
- −$33
- HOA
- −$0
- Vacancy / Maint / Mgmt
- −$406
- Net cashflow
- $830
Break-even live
UW: 25.0% down · 7.5% · 30yr · 1.5% tax · 5.0% vac · 8.0% maint · 8.0% mgmt
Financing live
Cash to close
- Down payment
- $19,975
- Closing costs
- $2,397
- Reserves months
- —
- Total cash needed
- —
Loan-product check · same deal, 3 products live
Conventional
25% down · 7.5% · 30yr
- Down + closing
- —
- Monthly P&I
- —
- Monthly cashflow
- —
- DSCR
- —
- Eligible?
- —
Personal DTI + credit; lowest rate.
DSCR
20% down · 8.5% · 30yr
- Down + closing
- —
- Monthly P&I
- —
- Monthly cashflow
- —
- DSCR
- —
- Eligible?
- —
No personal income docs; deal must DSCR.
Hard money
10% down · 12.0% · 12mo
- Down + closing
- —
- Monthly P&I
- —
- Monthly cashflow
- —
- DSCR
- —
- Eligible?
- —
Short-term bridge; refi at stabilization.
Rent comps 5 comps
| Address | Beds | Baths | Sqft | Rent | $/sqft | DOM | Units | Dist |
|---|---|---|---|---|---|---|---|---|
| 621 Cedar St Pocomoke City, MD | 3.0 | 2.5 | 1352 | $2,195 | $1.62 | 13d | 1 | 0.40mi |
| 242 Morgans Ct Pocomoke City, MD | 3.0 | 2.5 | 1304 | $1,795 | $1.38 | 13d | 1 | 0.76mi |
| 241 Morgans Ct Pocomoke City, MD | 3.0 | 2.5 | 1304 | $1,795 | $1.38 | 13d | 1 | 0.77mi |
| 202 Carsons Ct Pocomoke City, MD | 3.0 | 2.0 | 1472 | $1,695 | $1.15 | 13d | 1 | 0.78mi |
| 1513 Princess Anne Ln Pocomoke City, MD | 3.0 | 2.0 | 1542 | $1,950 | $1.26 | 43d | 1 | 1.20mi |
Listing history 23 events
-
2026-06-18days on market $79,900 Active 35 DOM
-
2026-06-17days on market $79,900 Active 34 DOM
-
2026-06-16days on market $79,900 Active 33 DOM
-
2026-06-15days on market $79,900 Active 32 DOM
-
2026-06-14days on market $79,900 Active 30 DOM
-
2026-06-13pricedays on market $79,900 Active 29 DOM
-
2026-06-10days on market $89,900 Active 27 DOM
-
2026-06-09days on market $89,900 Active 26 DOM
-
2026-06-08days on market $89,900 Active 25 DOM
-
2026-06-07days on market $89,900 Active 24 DOM
-
2026-06-02days on market $89,900 Active 19 DOM
-
2026-06-01days on market $89,900 Active 18 DOM
-
2026-05-31days on market $89,900 Active 17 DOM
-
2026-05-30days on market $89,900 Active 16 DOM
-
2026-05-14$89,900 Active 423-char remark
-
2023-09-07soldstatus $59,900
-
2023-08-29soldstatus $59,900 Closed 410-char remark
Show marketing remark (410 chars)
3 Bedroom 2 Bath with 1 car garage near downtown and Pocomoke River. There are 2 sheds connected to the detached garage. This house has good bones but needs major renovation. Owners are selling AS/IS and all furniture and contents of the house and sheds are staying. The house was winterized and power is on. Property is located across from the Old Armory/police station. Town is in process of razing building.
-
2023-07-03status Pending 410-char remark
Show marketing remark (410 chars)
3 Bedroom 2 Bath with 1 car garage near downtown and Pocomoke River. There are 2 sheds connected to the detached garage. This house has good bones but needs major renovation. Owners are selling AS/IS and all furniture and contents of the house and sheds are staying. The house was winterized and power is on. Property is located across from the Old Armory/police station. Town is in process of razing building.
-
2023-06-28$59,900 Active 410-char remark
Show marketing remark (410 chars)
3 Bedroom 2 Bath with 1 car garage near downtown and Pocomoke River. There are 2 sheds connected to the detached garage. This house has good bones but needs major renovation. Owners are selling AS/IS and all furniture and contents of the house and sheds are staying. The house was winterized and power is on. Property is located across from the Old Armory/police station. Town is in process of razing building.
-
1995-07-31soldstatus $34,900
-
1995-07-29soldstatus $34,900
Show marketing remark (204 chars)
HANDY MANS SPECIAL!!! LOOKING FOR THAT SUMMER PROJECT TO MAKE MONEY THIS IS IT! BOILER IS NEW. BRING ALL OFFERS! SELLER NEEDS TO SELL CALL LISTING AGENT FOR DETAILS. NEXT TO THE POLICE STATION SOLD AS IS.
-
1995-04-05$34,900
Show marketing remark (204 chars)
HANDY MANS SPECIAL!!! LOOKING FOR THAT SUMMER PROJECT TO MAKE MONEY THIS IS IT! BOILER IS NEW. BRING ALL OFFERS! SELLER NEEDS TO SELL CALL LISTING AGENT FOR DETAILS. NEXT TO THE POLICE STATION SOLD AS IS.
-
1986-05-23soldstatus $39,500
ⓘ Source: listings_history table (triggers on properties + properties_extension) + one-shot
backfill from property_details.listing_events for pre-trigger history.
Tax reassessment forecast MD · Partial reset (capped growth)
- Current annual tax
- $2,925 · $244/mo
- Projected year-2 tax
- $2,925 · $244/mo
- Expected delta
- $0/yr ($0/mo · 0.0%)
ⓘ Screening estimate from a state-policy table — verify with the county assessor before closing.
Climate risk First Street
- Flood 1/10 Low FEMA zone X (unshaded) · 0% chance over 30 yrs
- Wildfire 3/10 Moderate
- Heat 8/10 Severe 7 d/yr ≥102°F today · 18 d/yr by 30 yrs out
- Wind 8/10 Severe 80% chance of damaging wind over 30 yrs
- Air quality 2/10 Low 1 unhealthy d/yr today · 1 by 30 yrs out
Nearby sold comps map
Loading sold comps map…
Walkable amenities ~0.75 mi
Loading nearby amenities…
Taxation est. · year 1
- Rental income
- $23,174
- − Mortgage interest
- −$4,476
- − Property taxes
- −$2,925
- − Insurance
- −$400
- − Repairs & maintenance
- −$1,854
- − Management
- −$1,854
- − Depreciation
- −$2,324
- Taxable income
- $9,342
- Est. tax owed @ 24.0%
- −$2,242
- After-tax cash flow
- $7,713/yr
For passive investors: Depreciation is non-cash, so a rental often shows a tax loss while cash-flowing — sheltering income. Rental losses are passive: they offset passive income freely, and up to $25,000/yr can offset ordinary (W-2) income if you actively participate and your MAGI is under $100k (phasing out to $0 by $150k); unused losses carry forward. On sale, claimed depreciation is recaptured at up to 25%, and gains may owe capital-gains tax (a 1031 exchange can defer both). Figures are a year-1 estimate at your 24.0% rate — not tax advice; consult a CPA.
Schools (NCES district)
- District
- Worcester County Public Schools
- NCES district ID
- 2400720
- Math proficiency
- 30% ▼ -25.00%
- Reading proficiency
- 44% ▼ -20.00%
- Median HH income
- $56,748
- Composite
- 32.6/100
- National rank
- #5672
- State rank
- #6 of 24 in MD
Livability — Pocomoke City
- Score
- 71/100
- State rank
- #157
- US rank
- #7066
Category grades
Schools grade is shown separately in the Schools card above.
Census & demographics
- Census place
- Pocomoke City, MD
- Population (ZIP)
- 7,252
Population outlook (Worcester County) Hauer SSP2
- Today (2025)
- 51,363 people
- By 2030
- 51,191 · -0.3%
- By 2040
- 50,459 · -1.8%
- By 2050
- 49,451 · -3.7%
- By 2075
- 48,533 · -5.5%
- By 2100
- 44,223 · -13.9%
Race, ethnicity, and origin ACS 2023
- Neighborhood character
- Diverse neighborhood (Simpson 0.58)
- Race & ethnicity
- White 54% Black 37% Two or more races 5% Asian 2% Hispanic / Latino 2%
- Common ancestry
- Scandinavian 2% Romanian 2% Scotch-Irish 2%
- Foreign-born
- 5% · Canada, Dominican Republic, Mexico
- Languages at home
- 93% English-only · Other Asian/Pacific 1% Spanish 1% Vietnamese 1%
Political lean MEDSL · Worcester
- 2024 margin
- Strong R (+22.0) · D 38.0% · R 60.0% · Other 2.0%
- 2008→2024 swing
- -6.5pp toward R · 2008: -15.5pp · 2024: -22.0pp
- All cycles
- 2024: R+22.0 2020: R+19.0 2016: R+27.9 2012: R+18.3 2008: R+15.5
Not yet ingested
- Civics
- —
Market trends
- HPI YoY
- ▼ -10.03%
- Current HPI
- 243.2329
- Rent YoY
- —
- Metro
- —
- State GDP YoY
- ▲ 2.97%
- F500 in state
- 12
Industry mix (Fortune 500 HQ in MD)
| Industry | F500 HQs | Revenue |
|---|---|---|
| Aerospace / Defense | 1 | $71B |
|
||
| Utilities | 1 | $25B |
|
||
| Hotels | 1 | $24B |
|
||
| Consumer Goods | 1 | $7B |
|
||
| Real Estate | 1 | $6B |
|
||
| Chemicals | 1 | $2B |
|
||
Price history
+102.3% since first listed10 events — show timeline
- 2026-06-10 Price Changed $79,900 BRIGHT MLS
- 2026-05-14 Listed $89,900 BRIGHT MLS
- 2023-09-07 Sold (Public Records) $59,900 Public Records
- 2023-08-29 Sold (MLS) $59,900 BRIGHT MLS
- 2023-07-03 Pending — BRIGHT MLS
- 2023-06-28 Listed $59,900 BRIGHT MLS
- 1995-07-31 Sold (Public Records) $34,900 Public Records
- 1995-07-29 Sold (MLS) $34,900 BRIGHT MLS
- 1995-04-05 Listed $34,900 BRIGHT MLS
- 1986-05-23 Sold (Public Records) $39,500 Public Records
Property tax history
+7.3%/yrLatest (2025): $2,925 · +23.0% YoY. Source: county tax records.
Cash-flow waterfall
monthlySold comps — $/sqft
last 12 mo · ≤1 miLoading sold comps…