 Multi-family
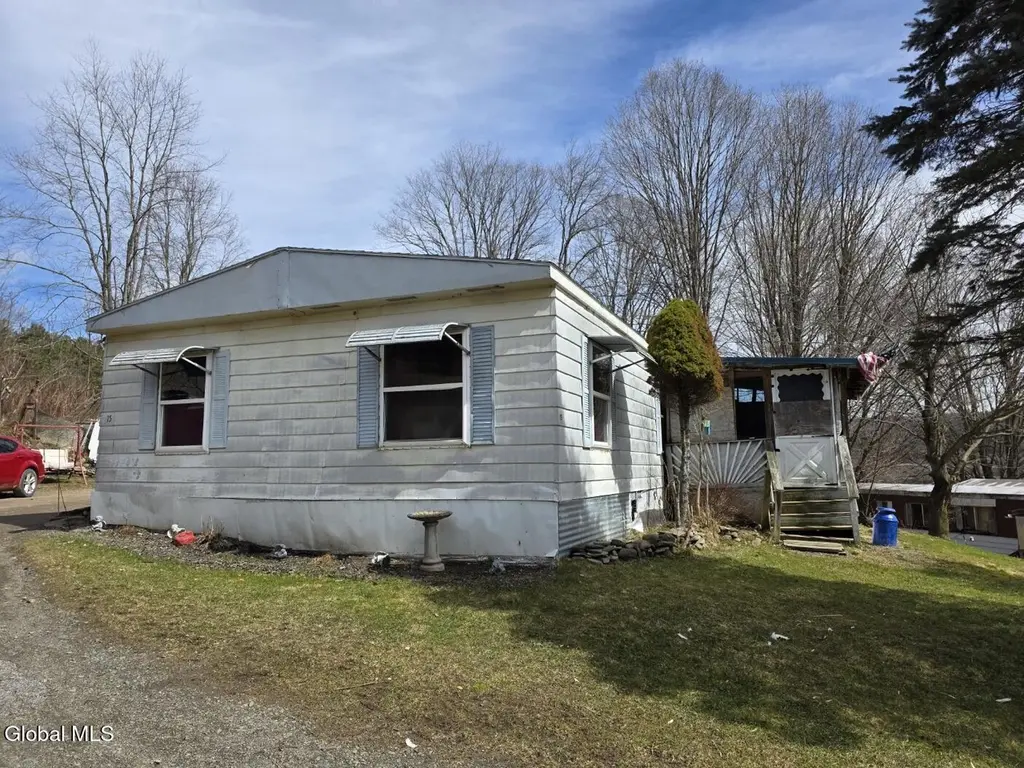
5-38 Alcott Ln #38 · Davenport Center, NY
Flood risk 7/10 · Major
- FEMA flood zone
- X (unshaded)
- Chance of flooding over 30 yrs
- 0.76%
- Est. flood insurance / yr
- $507 – $1,088
Fire risk 2/10 · Minimal
- Est. fire insurance / yr
- $691 – $1,283
Heat risk 2/10 · Minimal
- Hot days now (above 90°F)
- 7 days/yr
- Hot days in 30 yrs
- 17 days/yr
Wind risk 2/10 · Minimal
- Chance of severe wind over 30 yrs
- 1.0%
Air-quality risk 1/10 · Minimal
- Unhealthy air days now
- 0 days/yr
- Unhealthy air days in 30 yrs
- 0 days/yr
Risk factors via First Street. Map © Google.
Why this score? — see what drove the C- grade
The composite is a weighted blend of 9 inputs, each scored 0–100. Each bar is that input's sub-score; the figure is the points it added to the 100-point composite (weight × sub-score).
- Cash flow +15.0/30.0
- Appreciation +9.0/10.0
- ARV discount +7.5/15.0
- 1% rule +5.0/10.0
- DSCR +5.0/10.0
- Schools +3.7/10.0
- Livability +2.9/5.0
- Rent growth +2.5/5.0
- Condition / age +2.5/5.0
$75,000
🖨 Deal sheet 📄 Offer letter ✓ Due diligence
Multi-family units
County records classify this as Multi-Family (5+ Unit). Listing-text estimate: 1 unit. estimate disagrees with records
5+ unit building — per-unit beds/baths from public records are typically unavailable; the breakdown below (if shown) is an estimate from the listing text.
Listing remarks MLS
Trailer Park Sites for 5 trailers, 4 trailers on side. One lot vacant. Currently Doublewide is occupied by owner. 2 singlewide trailers owned by seller. One is being used by family. Other is gutted, in need of complete remodel. Each trailer has it's own septic tank. Trailer 4 is privately owned. A fifth lot could be rented. Barn. Motivated seller.
Key facts
- 1.5 acre lot
- 10 parking spots
- Built 1969
Neighborhood map
What this means for you Summary
Snapshot
- This is a 6-bed/3.0-bath multifamily listed at $75k.
Deal economics
- At list price, monthly cash flow is $4k ($47k/yr) — positive.
- The deal already cash-flows at list — no discount required.
- Meets the 1% rule at list price ($6k rent vs $75k).
- Recommended offer: $70k (6.0% below list) — sets the bar for market timing.
Location & tenants
- Location reads 58/100 on livability (#1,049 in NY) — a working-class tenant base; expect higher turnover. Strengths: cost of living A+, housing A; Watch: employment C-, health & safety C-, schools F.
- Charlotte Valley Central School District (rural): math 35% / reading 45% proficiency, ranked #640 of 755 in NY (top 85%) — families likely to look elsewhere, expect single-tenant / working-renter base with shorter leases.
- Market conditions: 10 active listings in the ZIP; 66 units permitted in Delaware County in 2024 (0 in 5+ unit buildings).
Forward outlook
- In year one you build about $6k of equity ($519 loan paydown + $6k appreciation (8.0% local appreciation)).
- Delaware County population projected at -27% by 2050 — secular population decline; favor cash flow + early exit over multi-decade hold.
- At projected returns (8.0% appreciation + 3.0% rent growth), your $21k cash investment doubles in ~1 year — after that, you're playing with house money.
- By year 6, paydown + projected appreciation supports a ~$37k cash-out refi (75% LTV) — recoverable capital for the next deal without selling this one.
Negotiation context
- It's been on market 76 days — a 6% lower offer ($70k) is reasonable based on typical stale-listing flexibility.
Risks & watch-outs
- Watch-outs: flood insurance adds $66/mo.
- Climate carrying-cost: major flood risk — expect insurance premiums to compound above CPI over the hold.
Questions for the listing agent
- It's been on market 76 days. Have you received any prior offers? Is the seller open to a 6% concession, seller financing, or rate buy-down credit?
- Built in 1969 — when were the roof, HVAC, electrical panel, plumbing, and water heater last replaced?
- What's the actual annual flood-insurance premium (NFIP or private), and is the property in a SFHA with mandatory coverage?
- Why hasn't it sold? Are there any deal-killer items the seller is aware of (foundation, flood, title, zoning, code violations)?
- Is there a deadline driving the sale (1031 exchange, divorce, estate, relocation)? That informs how much negotiation room exists.
- Schools are F-rated, which usually means shorter tenancies and higher turnover. Who's the typical renter profile here, and what's been the actual vacancy rate?
- Crime grade is F in this area — have there been break-ins, vandalism, or insurance claims at this property in the last 3 years? What carrier currently insures it and at what premium?
- What's the average days-on-market for RENTAL listings here right now (not sales)? A rising rental-DOM trend means longer vacancies and softer asking-rent achievability than the comps imply.
- What's the recent tenant-quality profile in this submarket — average credit score on applications, eviction rate, late-payment / NSF rate, and stable-employment percentage? A property-management company in the area should have these aggregated.
- How much new apartment / multifamily construction is in the pipeline within 1–3 miles? Heavy new supply (>2% of stock underway) typically softens rents 12–24 months out; light construction supports rent growth.
Investment metrics
- 1% rule
- 7.64% ✓
- Cap rate
- 70.41%
- Cash-on-cash
- 229.01%
- DSCR
- 11.19
- GRM
- 1.1
CMA / ARV
No comps found within radius.
Projected returns pro-forma
7.95% appreciation · 3.0% rent growth · sell at horizon
- IRR
- —
- Equity multiple
- 14.42×
- Total profit
- $281,815
- Equity at exit
- $56,744
- IRR
- —
- Equity multiple
- 31.07×
- Total profit
- $631,415
- Equity at exit
- $112,412
Cash invested: $21,000 (down + closing). Projections, not guarantees.
Landlord ↔ Tenant lean methodology
- Overall (STATE)
- 15 Strongly Tenant-Friendly
- State New York
- 15 Strongly Tenant-Friendly · D+10
- County
- — inherits STATE
- City
- — inherits STATE
ZIP-level market 13750
- Home prices YoY
- 2.2%
- Active inventory
- 10
- Price-to-rent
- 7.6×
Monthly cashflow live
- Estimated rent
- $5,729 medium interval (Pro) →
- Mortgage (P&I)
- −$393
- Tax est. 1.5%
- −$94 /mo · $1,125/yr
- Insurance
- −$31
- Flood insurance flood zone
- −$66 /mo · $798/yr
- HOA
- −$0
- Vacancy / Maint / Mgmt
- −$1,203
- Net cashflow
- $3,941
Break-even live
7-unit breakdown (identical units grouped — click to expand)
| Units | Beds | Baths | Est. rent |
|---|---|---|---|
| 7× units | 2 | 1 | $5,726 |
| #1 | 2 | 1 | $818 |
| #2 | 2 | 1 | $818 |
| #3 | 2 | 1 | $818 |
| #4 | 2 | 1 | $818 |
| #5 | 2 | 1 | $818 |
| #6 | 2 | 1 | $818 |
| #7 | 2 | 1 | $818 |
| Total (7 units) | $5,729 | ||
UW: 25.0% down · 7.5% · 30yr · 1.5% tax · 5.0% vac · 8.0% maint · 8.0% mgmt
Financing live
Cash to close
- Down payment
- $18,750
- Closing costs
- $2,250
- Reserves months
- —
- Total cash needed
- —
Loan-product check · same deal, 3 products live
Conventional
25% down · 7.5% · 30yr
- Down + closing
- —
- Monthly P&I
- —
- Monthly cashflow
- —
- DSCR
- —
- Eligible?
- —
Personal DTI + credit; lowest rate.
DSCR
20% down · 8.5% · 30yr
- Down + closing
- —
- Monthly P&I
- —
- Monthly cashflow
- —
- DSCR
- —
- Eligible?
- —
No personal income docs; deal must DSCR.
Hard money
10% down · 12.0% · 12mo
- Down + closing
- —
- Monthly P&I
- —
- Monthly cashflow
- —
- DSCR
- —
- Eligible?
- —
Short-term bridge; refi at stabilization.
Listing history 17 events
-
2026-06-19days on market $75,000 Active 76 DOM
-
2026-06-18days on market $75,000 Active 75 DOM
-
2026-06-17days on market $75,000 Active 74 DOM
-
2026-06-16days on market $75,000 Active 73 DOM
-
2026-06-15days on market $75,000 Active 72 DOM
-
2026-06-14days on market $75,000 Active 70 DOM
-
2026-06-12days on market $75,000 Active 69 DOM
-
2026-06-09days on market $75,000 Active 66 DOM
-
2026-06-08days on market $75,000 Active 65 DOM
-
2026-06-07days on market $75,000 Active 64 DOM
-
2026-06-07days on market $75,000 Active 63 DOM
-
2026-06-03days on market $75,000 Active 60 DOM
-
2026-06-02days on market $75,000 Active 59 DOM
-
2026-06-01days on market $75,000 Active 58 DOM
-
2026-05-31days on market $75,000 Active 57 DOM
-
2026-05-31days on market $75,000 Active 56 DOM
-
2026-04-01$75,000 Active 351-char remark
Show marketing remark (351 chars)
Trailer Park Sites for 5 trailers, 4 trailers on side. One lot vacant. Currently Doublewide is occupied by owner. 2 singlewide trailers owned by seller. One is being used by family. Other is gutted, in need of complete remodel. Each trailer has it's own septic tank. Trailer 4 is privately owned. A fifth lot could be rented. Barn. Motivated seller.
ⓘ Source: listings_history table (triggers on properties + properties_extension) + one-shot
backfill from property_details.listing_events for pre-trigger history.
Climate risk First Street
- Flood 7/10 Severe FEMA zone X (unshaded) · 76% chance over 30 yrs
- Wildfire 2/10 Low
- Heat 2/10 Low 7 d/yr ≥90°F today · 17 d/yr by 30 yrs out
- Wind 2/10 Low 100% chance of damaging wind over 30 yrs
- Air quality 1/10 Low 0 unhealthy d/yr today · 0 by 30 yrs out
Nearby sold comps map
Loading sold comps map…
Walkable amenities ~0.75 mi
Loading nearby amenities…
Taxation est. · year 1
- Rental income
- $68,748
- − Mortgage interest
- −$4,201
- − Property taxes
- −$1,125
- − Insurance
- −$1,172
- − Repairs & maintenance
- −$5,500
- − Management
- −$5,500
- − Depreciation
- −$2,182
- Taxable income
- $49,068
- Est. tax owed @ 24.0%
- −$11,776
- After-tax cash flow
- $35,517/yr
For passive investors: Depreciation is non-cash, so a rental often shows a tax loss while cash-flowing — sheltering income. Rental losses are passive: they offset passive income freely, and up to $25,000/yr can offset ordinary (W-2) income if you actively participate and your MAGI is under $100k (phasing out to $0 by $150k); unused losses carry forward. On sale, claimed depreciation is recaptured at up to 25%, and gains may owe capital-gains tax (a 1031 exchange can defer both). Figures are a year-1 estimate at your 24.0% rate — not tax advice; consult a CPA.
Schools (NCES district)
- District
- Charlotte Valley Central School District
- NCES district ID
- 3607050
- Math proficiency
- 35% ▲ 5.00%
- Reading proficiency
- 45% ▲ 10.00%
- Median HH income
- $47,579
- Composite
- 36.67/100
- National rank
- #9236
- State rank
- #640 of 755 in NY
Livability — Davenport Center
- Score
- 58/100
- State rank
- #1049
- US rank
- #20806
Category grades
Schools grade is shown separately in the Schools card above.
Census & demographics
- Population (ZIP)
- 588
Population outlook (Delaware County) Hauer SSP2
- Today (2025)
- 42,668 people
- By 2030
- 40,337 · -5.5%
- By 2040
- 35,514 · -16.8%
- By 2050
- 31,265 · -26.7%
- By 2075
- 24,455 · -42.7%
- By 2100
- 19,529 · -54.2%
Race, ethnicity, and origin ACS 2023
- Neighborhood character
- Predominantly White (98%)
- Race & ethnicity
- White 98% Two or more races 2%
- Common ancestry
- Iranian 3% Scottish 3% Italian 2%
- Foreign-born
- 2%
- Languages at home
- 96% English-only · Other Indo-European 4%
Political lean MEDSL · Delaware
- 2024 margin
- R (+19.8) · D 40.1% · R 59.9%
- 2008→2024 swing
- -14.6pp toward R · 2008: -5.2pp · 2024: -19.8pp
- All cycles
- 2024: R+19.8 2020: R+18.4 2016: R+29.2 2012: R+9.6 2008: R+5.2
Not yet ingested
- Civics
- —
Market trends
- HPI YoY
- ▲ 7.95%
- Current HPI
- 371.933
- Rent YoY
- —
- Metro
- —
- State GDP YoY
- ▲ 2.60%
- F500 in state
- 92
Industry mix (Fortune 500 HQ in NY)
| Industry | F500 HQs | Revenue |
|---|---|---|
| Financial Services | 10 | $950B |
|
||
| Consumer Goods | 9 | $162B |
|
||
| Insurance | 4 | $225B |
|
||
| Telecommunications | 2 | $144B |
|
||
| Pharmaceuticals | 2 | $112B |
|
||
| Media / Entertainment | 2 | $69B |
|
||
Price history
1 event — show timeline
- 2026-04-01 Listed $75,000 Global MLS
Cash-flow waterfall
monthlySold comps — $/sqft
last 12 mo · ≤1 miLoading sold comps…