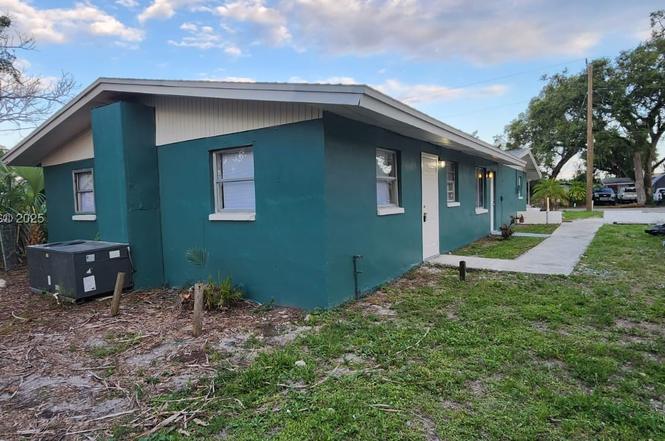
 Duplex
3147 Economy · Fort Myers, FL
Flood risk 1/10 · Minimal
- FEMA flood zone
- X (unshaded)
- Chance of flooding over 30 yrs
- 0.0%
- Est. flood insurance / yr
- $507 – $1,088
Fire risk 1/10 · Minimal
- Est. fire insurance / yr
- $947 – $1,759
Heat risk 10/10 · Severe
- Hot days now (above 107°F)
- 7 days/yr
- Hot days in 30 yrs
- 30 days/yr
Wind risk 10/10 · Severe
- Chance of severe wind over 30 yrs
- 99.0%
Air-quality risk 2/10 · Minimal
- Unhealthy air days now
- 1 days/yr
- Unhealthy air days in 30 yrs
- 1 days/yr
Risk factors via First Street. Map © Google.
Why this score? — see what drove the D grade
The composite is a weighted blend of 9 inputs, each scored 0–100. Each bar is that input's sub-score; the figure is the points it added to the 100-point composite (weight × sub-score).
- Cash flow +13.9/30.0
- ARV discount +7.5/15.0
- Livability +4.3/5.0
- DSCR +4.2/10.0
- Schools +4.1/10.0
- 1% rule +3.9/10.0
- Condition / age +2.5/5.0
- Rent growth +1.4/5.0
- Appreciation +0.0/10.0
$360,000
🖨 Deal sheet (PDF) 📄 Offer letter ✓ Due diligence
Multi-family units
County records classify this as Multi-Family (2-4 Unit). Listing-text estimate: 2 units. confirmed
Listing remarks
Located in a prime Fort Myers workforce housing area, this fully leased duplex offers immediate income and growth potential. Minutes from Downtown, with access to major employers, shopping, dining, and transit. Each unit is 2BR/1BA and occupied by reliable tenants, producing approx. 7% CAP. Strong rental demand and low vacancy risk. Highlights: Fully leased with stable tenants Approx. 7% CAP rate Close to employment hubs and amenities Motivated seller This is a solid opportunity to secure an income-producing property in a high-demand Fort Myers rental market, ideal for seasoned or first-time investors
Key facts
- Growth potential
- Strong rental demand
- Low vacancy risk
Tags
Property features AI
Finance
- Financial info: Rent includes gardener (for rental units)
Exterior
- Parking: Two total parking spaces; Open parking
- Utilities: Public sewer; Cable not available
- Home design: Single-story building
- Construction: Block construction; Shingle roof; Resale property (previously owned)
- Exterior features: Lot smaller than a quarter acre; Zoned RM-12
Interior
- Bedrooms: Two-bedroom units (2 units total)
- Flooring: Ceramic tile
- Bathrooms: One full bathroom per unit
- Heating & cooling: Central heating; Central air
- Interior features: Ceramic tile floors; Central heating and central air conditioning
Neighborhood map
What this means for you Summary
Snapshot
- This is a 2 × 2.0-bed/1.0-bath units multifamily listed at $360k.
Deal economics
- At list price, monthly cash flow is $40 ($481/yr) — positive. Per door: $20/mo.
- The deal already cash-flows at list — no discount required.
- To meet the 1% rule (rent ≥ 1% of price), the offer needs to be $320k (11.1% below list).
- Recommended offer: $317k (12.0% below list) — sets the bar for market timing.
- Cap rate 6.4% vs local median 3.0% in Fort Myers — top-decile yield for the area; either an underpriced asset or a hidden risk that comps aren't pricing in. Stress-test before assuming the spread holds.
Location & tenants
- Location reads 86/100 on livability (#14 in FL, #383 nationally) — a professional / high-income tenant draw. Strengths: amenities A+, commute A+, housing A+.
- Lee (suburban): math 47% / reading 50% proficiency, ranked #42 of 73 in FL (top 58%) — families likely to look elsewhere, expect single-tenant / working-renter base with shorter leases.
- Market conditions: Rents falling (-4.3%/yr); 267 active listings in the ZIP; 40 comparable units currently listed for rent nearby; rentals at typical pace (median 25d on market — plan ~3-4 weeks tenant-placement turnaround); 15,411 units permitted in Lee County in 2024 (4,686 in 5+ unit buildings).
- At $3,200/mo this rent would consume 73% of the median local household income ($53k/yr) (locally 2324% of renters already pay >50% of income on rent) — very limited rent-growth headroom before tenants either downsize or default.
Forward outlook
- Local home prices are declining (-3.0%/yr); year-one equity from $2k of loan paydown is wiped out by about $11k of value loss. Plan a longer hold.
- Lee County population projected at +44% by 2050 — long-run rental-demand tailwind backs the buy-and-hold thesis.
Negotiation context
- It's been on market 311 days — a 12% lower offer ($317k) is reasonable based on typical stale-listing flexibility.
Risks & watch-outs
- Watch-outs: built in 1959 — expect roof / HVAC / electrical / plumbing capex.
- Climate carrying-cost: severe wind risk, 99% chance of damaging wind over 30y; extreme-heat days projected 7→30/yr by 2055 (HVAC capex compounding) — expect insurance premiums to compound above CPI over the hold.
Questions for the listing agent
- It's been on market 311 days. Have you received any prior offers? Is the seller open to a 12% concession, seller financing, or rate buy-down credit?
- Can we see the unit-by-unit rent roll, current vacancy, and any below-market leases? What's the average tenancy length?
- What capital expenditures (roof, boiler, parking lot, exteriors) have been made in the last 5 years, and what's planned in the next 2?
- Built in 1959 — when were the roof, HVAC, electrical panel, plumbing, and water heater last replaced?
- Why hasn't it sold? Are there any deal-killer items the seller is aware of (foundation, flood, title, zoning, code violations)?
- Is there a deadline driving the sale (1031 exchange, divorce, estate, relocation)? That informs how much negotiation room exists.
- The area grade is low — what's the realistic commute time and amenity access for the typical tenant pool here? Any planned neighborhood developments (good or bad) we should know about?
- What's the average days-on-market for RENTAL listings here right now (not sales)? A rising rental-DOM trend means longer vacancies and softer asking-rent achievability than the comps imply.
- What's the recent tenant-quality profile in this submarket — average credit score on applications, eviction rate, late-payment / NSF rate, and stable-employment percentage? A property-management company in the area should have these aggregated.
- How much new apartment / multifamily construction is in the pipeline within 1–3 miles? Heavy new supply (>2% of stock underway) typically softens rents 12–24 months out; light construction supports rent growth.
Investment metrics
- 1% rule
- 0.89% ✗
- Cap rate
- 6.43%
- Cash-on-cash
- 0.48%
- DSCR
- 1.02
- GRM
- 9.4
CMA / ARV
No comps found within radius.
Show comp detail 2 sales within ~0.75 mi
| Address | Dist | Beds/Ba | Sqft | Sold | Price | $/sf | Match |
|---|---|---|---|---|---|---|---|
| 3137-3139-3139 Lincoln Blvd | 0.36mi | 4/2.0 | 1,126 | 14mo | $255,000 | $226 | 59 |
| 2668-2674 Michigan Ave | 0.66mi | 4/2.0 | 1,800 | 12mo | $399,000 | $222 | 47 |
Match score weights: distance 35% · size 25% · config 20% · recency 20%. Top-matched comps best support the ARV.
Projected returns pro-forma
-3.0% appreciation · 0.0% rent growth · sell at horizon
- IRR
- -19.0%
- Equity multiple
- 0.35×
- Total profit
- $-65,110
- Equity at exit
- $53,677
- IRR
- -19.2%
- Equity multiple
- 0.11×
- Total profit
- $-89,452
- Equity at exit
- $31,126
Cash invested: $100,800 (down + closing). Projections, not guarantees.
Landlord ↔ Tenant lean methodology
- Overall (STATE)
- 87 Strongly Landlord-Friendly
- State Florida
- 87 Strongly Landlord-Friendly · R+3
- County
- — inherits STATE
- City
- — inherits STATE
ZIP-level market 33916
- Home prices YoY
- -28.2%
- Rents YoY
- -4.3%
- Active inventory
- 267
- Price-to-rent
- 18.8×
Monthly cashflow live
- Estimated rent
- $3,200 high interval (Pro) →
- Mortgage (P&I)
- −$1,888
- Tax est. 1.5%
- −$450 /mo · $5,400/yr
- Insurance
- −$150
- HOA
- −$0
- Vacancy / Maint / Mgmt
- −$672
- Net cashflow
- $40
Break-even live
Sensitivity live
| Price | -10% $289 | -5% $165 | +0% $40 | +5% $-84 | +10% $-209 |
|---|---|---|---|---|---|
| Rent | -10% $-213 | -5% $-86 | +0% $40 | +5% $167 | +10% $293 |
| Rate | -1.0pp $221 | -0.5pp $132 | base $40 | +0.5pp $-53 | +1.0pp $-148 |
2-unit breakdown (identical units grouped — click to expand)
| Units | Beds | Baths | Est. rent |
|---|---|---|---|
| 2× units | 2.0 | 1 | $3,200 |
| #1 | 2.0 | 1 | $1,600 |
| #2 | 2.0 | 1 | $1,600 |
| Total (2 units) | $3,200 | ||
UW: 25.0% down · 7.5% · 30yr · 1.5% tax · 5.0% vac · 8.0% maint · 8.0% mgmt
Financing live
Cash to close
- Down payment
- $90,000
- Closing costs
- $10,800
- Reserves months
- —
- Total cash needed
- —
Loan-product check · same deal, 3 products live
Conventional
25% down · 7.5% · 30yr
- Down + closing
- —
- Monthly P&I
- —
- Monthly cashflow
- —
- DSCR
- —
- Eligible?
- —
Personal DTI + credit; lowest rate.
DSCR
20% down · 8.5% · 30yr
- Down + closing
- —
- Monthly P&I
- —
- Monthly cashflow
- —
- DSCR
- —
- Eligible?
- —
No personal income docs; deal must DSCR.
Hard money
10% down · 12.0% · 12mo
- Down + closing
- —
- Monthly P&I
- —
- Monthly cashflow
- —
- DSCR
- —
- Eligible?
- —
Short-term bridge; refi at stabilization.
Rent comps 40 comps
| Address | Beds | Baths | Sqft | Rent | $/sqft | DOM | Units | Dist |
|---|---|---|---|---|---|---|---|---|
| 3034 Price Ave Fort Myers, FL | 3.0 | 2.0 | 1367 | $2,100 | $1.54 | 4d | 1 | 0.33mi |
| 2103 French St Fort Myers, FL | 3.0 | 2.0 | 1100 | $1,900 | $1.73 | 24d | 1 | 0.38mi |
| 2103 French St Fort Myers, FL | 3.0 | 2.0 | 1100 | $1,800 | $1.64 | 2d | 1 | 0.38mi |
| 2103 French St Fort Myers, FL | 3.0 | 2.0 | 1100 | $1,800 | $1.64 | 2d | 1 | 0.38mi |
| 2103 French St Unit 2 Fort Myers, FL | 3.0 | 2.0 | 1100 | $1,800 | $1.64 | 24d | 1 | 0.38mi |
| 3323 Michigan Ave Fort Myers, FL | 3.0 | 2.0 | 1029 | $1,600 | $1.55 | 22d | 1 | 0.40mi |
| 4051 Regata Way Fort Myers, FL | 1.0–3.0 | 1.0–2.0 | 987 | $2,021 | $2.05 | 3d | 34 | 0.42mi |
| 2225 Carver Ave Fort Myers, FL | 3.0 | 2.0 | 1193 | $2,200 | $1.84 | 24d | 1 | 0.42mi |
| 2218 Quality Life Center Way Fort Myers, FL | 4.0 | 2.0 | 1257 | $2,250 | $1.79 | 24d | 1 | 0.45mi |
| 2955 Dunbar St Unit A Fort Myers, FL | 3.0 | 2.0 | 1285 | $2,300 | $1.79 | 16d | 1 | 0.46mi |
| 2955 Dunbar St Unit A Fort Myers, FL | 3.0 | 2.0 | 1111 | $2,300 | $2.07 | 4d | 1 | 0.46mi |
| 2147 Pauldo St Fort Myers, FL | 3.0 | 2.0 | 1088 | $1,395 | $1.28 | 24d | 1 | 0.46mi |
| 2987 Thomas St Fort Myers, FL | 3.0 | 2.0 | 1200 | $2,100 | $1.75 | 22d | 1 | 0.48mi |
| 3461 Michigan Ave Fort Myers, FL | 3.0 | 2.0 | — | $2,400 | — | 24d | 1 | 0.52mi |
| 3306 Bassie Ct Fort Myers, FL | 4.0 | 2.0 | 1257 | $2,100 | $1.67 | 24d | 1 | 0.60mi |
| 2656 Lime St Fort Myers, FL | 4.0 | 2.0 | 1232 | $1,700 | $1.38 | 4d | 1 | 0.62mi |
| 1270 Allen St Unit B Fort Myers, FL | 3.0 | 2.0 | 1085 | $1,700 | $1.57 | 24d | 1 | 0.62mi |
| 3141 Edison Ave Fort Myers, FL | 4.0 | 1.0 | 1136 | $1,500 | $1.32 | 24d | 1 | 0.69mi |
| 2132 Barker Blvd Fort Myers, FL | 4.0 | 2.0 | 1367 | $2,600 | $1.90 | 24d | 1 | 0.74mi |
| 2132 Barker Blvd Fort Myers, FL | 4.0 | 2.0 | 1979 | $2,600 | $1.31 | 4d | 1 | 0.74mi |
| 2825 Palm Beach Blvd Fort Myers, FL | 1.0–3.0 | 1.5–2.5 | 990 | $2,200 | $2.22 | 11d | 7 | 0.75mi |
| 2579 Second St Fort Myers, FL | 3.0 | 2.0 | 1404 | $2,500 | $1.78 | 16d | 1 | 0.76mi |
| 2188 Barker Blvd Fort Myers, FL | 4.0 | 2.0 | 1367 | $2,600 | $1.90 | 24d | 1 | 0.77mi |
| 3000 Oasis Grand Blvd #401 Fort Myers, FL | 3.0 | 2.5 | 1854 | $3,000 | $1.62 | 24d | 1 | 0.78mi |
| 3000 Oasis Grand Blvd #2004 Fort Myers, FL | 3.0 | 2.5 | 1708 | $2,995 | $1.75 | 12d | 1 | 0.78mi |
| 3000 Oasis Grand Blvd #2004 Fort Myers, FL | 3.0 | 2.5 | 1708 | $2,995 | $1.75 | 24d | 1 | 0.78mi |
| 3000 Oasis Grand Blvd #801 Fort Myers, FL | 3.0 | 2.5 | 1854 | $4,000 | $2.16 | 24d | 1 | 0.78mi |
| 3000 Oasis Grand Blvd Unit LPH1 Fort Myers, FL | 3.0 | 2.5 | 1584 | $5,000 | $3.16 | 16d | 1 | 0.78mi |
| 2649 Market St Unit 2651 Fort Myers, FL | 3.0 | 2.0 | 1184 | $1,250 | $1.06 | 20d | 1 | 0.79mi |
| 2651 Market St Fort Myers, FL | 3.0 | 2.0 | 1184 | $1,295 | $1.09 | 24d | 1 | 0.79mi |
| 3341 Willard St Fort Myers, FL | 4.0 | 2.0 | 1257 | $2,500 | $1.99 | 16d | 1 | 0.79mi |
| 3341 Willard St Fort Myers, FL | 4.0 | 2.0 | 1619 | $2,500 | $1.54 | 20d | 1 | 0.79mi |
| 2743 First St Unit 605 Fort Myers, FL | 3.0 | 2.0 | 1721 | $2,750 | $1.60 | 24d | 1 | 0.80mi |
| 2743 1st St #2206 Fort Myers, FL | 3.0 | 2.0 | 1756 | $2,600 | $1.48 | 24d | 1 | 0.80mi |
| 2743 1st St #2102 Fort Myers, FL | 3.0 | 2.0 | 1656 | $2,800 | $1.69 | 24d | 1 | 0.80mi |
| 2743 1st St #803 Fort Myers, FL | 3.0 | 2.0 | 1571 | $5,500 | $3.50 | 24d | 1 | 0.80mi |
| 2743 1st St #304 Fort Myers, FL | 3.0 | 2.0 | 1341 | $2,300 | $1.72 | 24d | 1 | 0.80mi |
| 2743 1st St #506 Fort Myers, FL | 3.0 | 2.0 | 1663 | $2,200 | $1.32 | 24d | 1 | 0.80mi |
| 2743 1st St #405 Fort Myers, FL | 3.0 | 2.0 | 1721 | $2,500 | $1.45 | 24d | 1 | 0.80mi |
| 2797 1st St #1602 Fort Myers, FL | 3.0 | 2.0 | 1459 | $2,495 | $1.71 | 24d | 1 | 0.81mi |
Listing history 10 events
-
2026-06-17days on market $360,000 Active 311 DOM
-
2026-06-16days on market $360,000 Active 310 DOM
-
2026-06-16days on market $360,000 Active 309 DOM
-
2026-06-13days on market $360,000 Active 307 DOM
-
2026-06-09days on market $360,000 Active 303 DOM
-
2026-06-07days on market $360,000 Active 301 DOM
-
2026-06-02days on market $360,000 Active 296 DOM
-
2026-06-01days on market $360,000 Active 295 DOM
-
2026-06-01days on market $360,000 Active 294 DOM
-
2025-08-08$360,000 Active
ⓘ Source: listings_history table (triggers on properties + properties_extension) + one-shot
backfill from property_details.listing_events for pre-trigger history.
Climate risk First Street
- Flood 1/10 Low FEMA zone X (unshaded) · 0% chance over 30 yrs
- Wildfire 1/10 Low
- Heat 10/10 Extreme 7 d/yr ≥107°F today · 30 d/yr by 30 yrs out
- Wind 10/10 Extreme 99% chance of damaging wind over 30 yrs
- Air quality 2/10 Low 1 unhealthy d/yr today · 1 by 30 yrs out
Nearby sold comps map
Loading sold comps map…
Walkable amenities ~0.75 mi
Loading nearby amenities…
Taxation est. · year 1
- Rental income
- $38,400
- − Mortgage interest
- −$20,166
- − Property taxes
- −$5,400
- − Insurance
- −$1,800
- − Repairs & maintenance
- −$3,072
- − Management
- −$3,072
- − Depreciation
- −$10,473
- Taxable loss
- −$5,582
- Est. tax savings @ 24.0%
- +$1,340
- After-tax cash flow
- $1,821/yr
For passive investors: Depreciation is non-cash, so a rental often shows a tax loss while cash-flowing — sheltering income. Rental losses are passive: they offset passive income freely, and up to $25,000/yr can offset ordinary (W-2) income if you actively participate and your MAGI is under $100k (phasing out to $0 by $150k); unused losses carry forward. On sale, claimed depreciation is recaptured at up to 25%, and gains may owe capital-gains tax (a 1031 exchange can defer both). Figures are a year-1 estimate at your 24.0% rate — not tax advice; consult a CPA.
Schools (NCES district)
- District
- Lee
- NCES district ID
- 1201080
- Math proficiency
- 47% ▼ -11.00%
- Reading proficiency
- 50% ▼ -4.00%
- Median HH income
- $49,518
- Composite
- 41.49/100
- National rank
- #3458
- State rank
- #42 of 73 in FL
Livability — Fort Myers
- Score
- 86/100
- State rank
- #14
- US rank
- #383
Category grades
Schools grade is shown separately in the Schools card above.
Census & demographics
- Census place
- Fort Myers, FL
- County
- Lee County · 788,662 people
- City population
- 278,598
- Metro
- Cape Coral-Fort Myers, FL
- Population (ZIP)
- 27,943
- Household income
- $52,586
- Rent vs Own
- Severe rent burden
- 2324.0
Population outlook (Lee County) Hauer SSP2
- Today (2025)
- 871,946 people
- By 2030
- 955,468 · +9.6%
- By 2040
- 1,113,587 · +27.7%
- By 2050
- 1,256,891 · +44.1%
- By 2075
- 1,560,270 · +78.9%
- By 2100
- 1,726,848 · +98.0%
Race, ethnicity, and origin ACS 2023
- Neighborhood character
- Highly diverse neighborhood (Simpson 0.71)
- Race & ethnicity
- Black 34% Hispanic / Latino 30% White 28% Two or more races 21% Asian 2%
- Hispanic origin (detail)
- Mexican 5% Puerto Rican 6% Cuban 7% Dominican 1%
- Common ancestry
- Estonian 3% Hispanic 1% Romanian 1%
- Foreign-born
- 22% · Canada, Vietnam, China
- Languages at home
- 69% English-only · Spanish 24% Other Indo-European 4% French/Haitian/Cajun 1%
Political lean MEDSL · Lee
- 2024 margin
- Strong R (+28.4) · D 35.5% · R 63.9%
- 2008→2024 swing
- -18.0pp toward R · 2008: -10.4pp · 2024: -28.4pp
- All cycles
- 2024: R+28.4 2020: R+19.2 2016: R+20.4 2012: R+16.6 2008: R+10.4
Not yet ingested
- Civics
- —
Market trends
- HPI YoY
- ▼ -95.73%
- Current HPI
- 243.2657
- Rent YoY
- ▼ -4.30%
- Metro
- Cape Coral-Fort Myers, FL
- State GDP YoY
- ▲ 3.28%
- F500 in state
- 36
Industry mix (Fortune 500 HQ in FL)
| Industry | F500 HQs | Revenue |
|---|---|---|
| Industrial Technology | 2 | $29B |
|
||
| Insurance | 2 | $17B |
|
||
| Retail | 1 | $60B |
|
||
| Technology Distribution | 1 | $58B |
|
||
| Homebuilding | 1 | $35B |
|
||
| Technology Manufacturing | 1 | $35B |
|
||
Price history
1 event — show timeline
- 2025-08-08 Listed $360,000 MARMLS
Cash-flow waterfall
monthlySold comps — $/sqft
last 12 mo · ≤1 miLoading sold comps…