803 Prospect Ave · Carthage, MO
Flood risk 1/10 · Minimal
- FEMA flood zone
- X (unshaded)
- Chance of flooding over 30 yrs
- 0.0%
- Est. flood insurance / yr
- $473 – $860
Fire risk 4/10 · Minor
- Est. fire insurance / yr
- $1,054 – $1,958
Heat risk 5/10 · Moderate
- Hot days now (above 107°F)
- 7 days/yr
- Hot days in 30 yrs
- 20 days/yr
Wind risk 2/10 · Minimal
- Chance of severe wind over 30 yrs
- 2.0%
Air-quality risk 2/10 · Minimal
- Unhealthy air days now
- 1 days/yr
- Unhealthy air days in 30 yrs
- 1 days/yr
Risk factors via First Street. Map © Google.
Why this score? — see what drove the C grade
The composite is a weighted blend of 9 inputs, each scored 0–100. Each bar is that input's sub-score; the figure is the points it added to the 100-point composite (weight × sub-score).
- Cash flow +23.7/30.0
- DSCR +7.6/10.0
- ARV discount +7.5/15.0
- 1% rule +5.4/10.0
- Livability +3.5/5.0
- Schools +3.2/10.0
- Rent growth +2.5/5.0
- Condition / age +2.5/5.0
- Appreciation +0.0/10.0
$127,500
🖨 Deal sheet 📄 Offer letter ✓ Due diligence
Listing remarks MLS
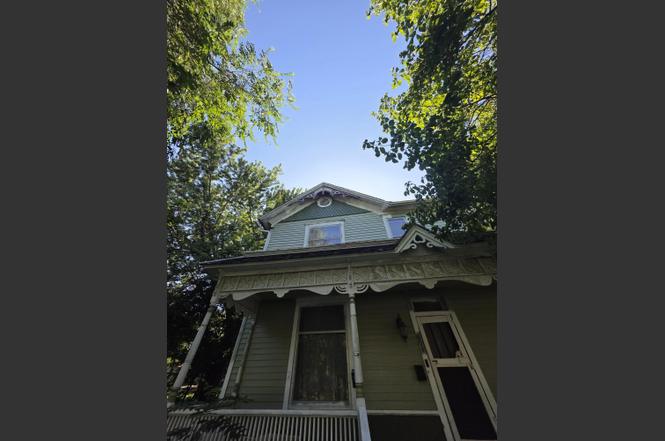
Step into the charm and character of this beautifully preserved Victorian home, built in 1895 and located in the heart of Carthage's Historic District. Featuring over 2,000 square feet of living space, this 3-bedroom, 2-bath home offers timeless architectural details, a spacious wraparound porch, and the unique craftsmanship that only a historic home can provide. This home has undergone extensive updates, including new plumbing, new electrical, new HVAC, and comes complete with all appliances, allowing the next owner to enjoy modern conveniences while preserving its historic character. Situated on a large corner lot directly across from a park, the property offers both charm and convenience with easy access to downtown Carthage, local shops, restaurants, and community events. Whether you're an investor looking for a value-add opportunity or a buyer who has always dreamed of owning a Victorian home without paying a premium price, this property deserves a look. Much of the major work has already been completed, leaving an excellent opportunity to add your finishing touches and build equity in a one-of-a-kind historic home. Don't miss your chance to own a piece of Carthage history at an affordable price.
Key facts
- Large corner lot
- Victorian home
- Across from a park
Tags
Property features AI
Exterior
- Parking: Detached 1-car garage; Additional 1-car detached garage/parking noted
- Utilities: Public sewer
- Home design: Single-family residence (freestanding); Residential property
- Construction: Stone foundation
- Exterior features: Wrap-around porch; Cleared, level lot; Composition roof
Interior
- Kitchen: Gas range; Microwave; Refrigerator; Dishwasher not listed
- Bedrooms: 7 total rooms (bedroom count not specified)
- Flooring: Laminate flooring
- Bathrooms: 2 full bathrooms
- Heating & cooling: Central heating; Forced air heating; Wall cooling units
- Interior features: Gas range, microwave, refrigerator, washer and dryer included; No fireplace
- Laundry & utility: Washer and dryer included
Neighborhood map
What this means for you Summary
Snapshot
- This is a 3-bed/2.0-bath other listed at $128k.
Deal economics
- At list price, monthly cash flow is $243 ($3k/yr) — positive.
- The deal already cash-flows at list — no discount required.
- Meets the 1% rule at list price ($1k rent vs $128k).
Location & tenants
- Location reads 70/100 on livability (#131 in MO) — a middle-class / working-renter tenant base. Strengths: cost of living A+, housing A+, health & safety A; Watch: amenities F, commute F, employment F.
- Carthage R-IX (town): math 37% / reading 39% proficiency, ranked #183 of 324 in MO (top 56%) — families likely to look elsewhere, expect single-tenant / working-renter base with shorter leases.
- Zoned schools: Carthage Intermediate Center (math 32% / reading 37%, grade F, #676 of 1,115 statewide, top 66%, 772 students, 72% FRL); Carthage Jr. High (math 38% / reading 41%, grade F, #189 of 391 statewide, top 51%, 752 students, 64% FRL).
- Market conditions: 195 active listings in the ZIP; 602 units permitted in Jasper County in 2024 (0 in 5+ unit buildings).
Forward outlook
- Local home prices are declining (-3.0%/yr); year-one equity from $882 of loan paydown is wiped out by about $4k of value loss. Plan a longer hold.
Negotiation context
- Only 1 days on market — expect competitive offers; lowballing is unlikely to land.
- 9 sale attempts since 9y ago with the ask held roughly flat each time — persistent listings suggest the price (not the market) is what's stuck; bring a comps-based counter.
Risks & watch-outs
- Watch-outs: built in 1895 — expect roof / HVAC / electrical / plumbing capex.
- Climate carrying-cost: extreme-heat days projected 7→20/yr by 2055 (HVAC capex compounding) — expect insurance premiums to compound above CPI over the hold.
Questions for the listing agent
- Built in 1895 — when were the roof, HVAC, electrical panel, plumbing, and water heater last replaced?
- Is there a deadline driving the sale (1031 exchange, divorce, estate, relocation)? That informs how much negotiation room exists.
- Schools are D-rated, which usually means shorter tenancies and higher turnover. Who's the typical renter profile here, and what's been the actual vacancy rate?
- What's the average days-on-market for RENTAL listings here right now (not sales)? A rising rental-DOM trend means longer vacancies and softer asking-rent achievability than the comps imply.
- What's the recent tenant-quality profile in this submarket — average credit score on applications, eviction rate, late-payment / NSF rate, and stable-employment percentage? A property-management company in the area should have these aggregated.
- How much new for-sale + rental construction is in the pipeline within 1–3 miles? Heavy new supply typically softens prices + rents 12–24 months out; constrained supply supports both.
Investment metrics
- 1% rule
- 1.04% ✓
- Cap rate
- 8.58%
- Cash-on-cash
- 8.15%
- DSCR
- 1.36
- GRM
- 8.0
CMA / ARV
No comps found within radius.
Projected returns pro-forma
-3.0% appreciation · 3.0% rent growth · sell at horizon
- IRR
- -3.9%
- Equity multiple
- 0.85×
- Total profit
- $-5,244
- Equity at exit
- $19,011
- IRR
- 5.7%
- Equity multiple
- 1.43×
- Total profit
- $15,205
- Equity at exit
- $11,024
Cash invested: $35,700 (down + closing). Projections, not guarantees.
Landlord ↔ Tenant lean methodology
- Overall (STATE)
- 81 Strongly Landlord-Friendly
- State Missouri
- 81 Strongly Landlord-Friendly · R+10
- County
- — inherits STATE
- City
- — inherits STATE
ZIP-level market 64836
- Home prices YoY
- -18.2%
- Active inventory
- 195
- Price-to-rent
- 8.0×
Monthly cashflow live
- Estimated rent
- $1,322 medium interval (Pro) →
- Mortgage (P&I)
- −$669
- Tax from tax record
- −$80 /mo · $959/yr
- Insurance
- −$53
- HOA
- −$0
- Vacancy / Maint / Mgmt
- −$278
- Net cashflow
- $243
Break-even live
UW: 25.0% down · 7.5% · 30yr · 1.5% tax · 5.0% vac · 8.0% maint · 8.0% mgmt
Financing live
Cash to close
- Down payment
- $31,875
- Closing costs
- $3,825
- Reserves months
- —
- Total cash needed
- —
Loan-product check · same deal, 3 products live
Conventional
25% down · 7.5% · 30yr
- Down + closing
- —
- Monthly P&I
- —
- Monthly cashflow
- —
- DSCR
- —
- Eligible?
- —
Personal DTI + credit; lowest rate.
DSCR
20% down · 8.5% · 30yr
- Down + closing
- —
- Monthly P&I
- —
- Monthly cashflow
- —
- DSCR
- —
- Eligible?
- —
No personal income docs; deal must DSCR.
Hard money
10% down · 12.0% · 12mo
- Down + closing
- —
- Monthly P&I
- —
- Monthly cashflow
- —
- DSCR
- —
- Eligible?
- —
Short-term bridge; refi at stabilization.
Listing history 3 events
-
2026-06-17status $127,500 Pending 1 DOM
-
2026-06-17remarks 699-char remark
-
2026-06-17$127,500 Active 1 DOM
ⓘ Source: listings_history table (triggers on properties + properties_extension) + one-shot
backfill from property_details.listing_events for pre-trigger history.
Tax reassessment forecast MO · Resets to sale price
- Current annual tax
- $959 · $80/mo
- Projected year-2 tax
- $1,237 · $103/mo
- Expected delta
- +$278/yr (+$23/mo · 29.0%)
ⓘ Screening estimate from a state-policy table — verify with the county assessor before closing.
Climate risk First Street
- Flood 1/10 Low FEMA zone X (unshaded) · 0% chance over 30 yrs
- Wildfire 4/10 Moderate
- Heat 5/10 Major 7 d/yr ≥107°F today · 20 d/yr by 30 yrs out
- Wind 2/10 Low 2% chance of damaging wind over 30 yrs
- Air quality 2/10 Low 1 unhealthy d/yr today · 1 by 30 yrs out
Nearby sold comps map
Loading sold comps map…
Walkable amenities ~0.75 mi
Loading nearby amenities…
Taxation est. · year 1
- Rental income
- $15,861
- − Mortgage interest
- −$7,142
- − Property taxes
- −$959
- − Insurance
- −$638
- − Repairs & maintenance
- −$1,269
- − Management
- −$1,269
- − Depreciation
- −$3,709
- Taxable income
- $876
- Est. tax owed @ 24.0%
- −$210
- After-tax cash flow
- $2,700/yr
For passive investors: Depreciation is non-cash, so a rental often shows a tax loss while cash-flowing — sheltering income. Rental losses are passive: they offset passive income freely, and up to $25,000/yr can offset ordinary (W-2) income if you actively participate and your MAGI is under $100k (phasing out to $0 by $150k); unused losses carry forward. On sale, claimed depreciation is recaptured at up to 25%, and gains may owe capital-gains tax (a 1031 exchange can defer both). Figures are a year-1 estimate at your 24.0% rate — not tax advice; consult a CPA.
Schools (NCES district)
- District
- Carthage R-IX
- NCES district ID
- 2907460
- Math proficiency
- 37% ▲ 3.00%
- Reading proficiency
- 39% ▲ 1.00%
- Median HH income
- $39,696
- Composite
- 31.85/100
- National rank
- #5874
- State rank
- #183 of 324 in MO
Livability — Carthage
- Score
- 70/100
- State rank
- #131
- US rank
- #7646
Category grades
Schools grade is shown separately in the Schools card above.
Census & demographics
- Census place
- Carthage, MO
- County
- Jasper County · 79,035 people
- City population
- 26,562
- Metro
- Joplin, MO
- Population (ZIP)
- 26,562
- Household income
- $61,335
- Rent vs Own
- Severe rent burden
- 800.0
Population outlook (Jasper County) Hauer SSP2
- Today (2025)
- 120,033 people
- By 2030
- 120,091 · +0.0%
- By 2040
- 119,297 · -0.6%
- By 2050
- 117,705 · -1.9%
- By 2075
- 110,402 · -8.0%
- By 2100
- 99,719 · -16.9%
Race, ethnicity, and origin ACS 2023
- Neighborhood character
- Predominantly White (68%)
- Race & ethnicity
- White 68% Hispanic / Latino 25% Two or more races 10% Black 1%
- Hispanic origin (detail)
- Mexican 7%
- Common ancestry
- Slovak 2% Serbian 1% Lithuanian 1%
- Foreign-born
- 10% · Canada
- Languages at home
- 82% English-only · Spanish 18%
Political lean MEDSL · Jasper
- 2024 margin
- Solid R (+46.8) · D 25.9% · R 72.7% · Other 1.4%
- 2008→2024 swing
- -13.6pp toward R · 2008: -33.2pp · 2024: -46.8pp
- All cycles
- 2024: R+46.8 2020: R+46.2 2016: R+50.8 2012: R+41.0 2008: R+33.2
Not yet ingested
- Civics
- —
Market trends
- HPI YoY
- ▼ -55.61%
- Current HPI
- 250.499
- Rent YoY
- —
- Metro
- Joplin, MO
- State GDP YoY
- ▲ 1.84%
- F500 in state
- 20
Industry mix (Fortune 500 HQ in MO)
| Industry | F500 HQs | Revenue |
|---|---|---|
| Healthcare | 1 | $163B |
|
||
| Insurance | 1 | $21B |
|
||
| Industrial Technology | 1 | $17B |
|
||
| Retail | 1 | $16B |
|
||
| Industrial Distribution | 1 | $10B |
|
||
| Utilities | 1 | $9B |
|
||
Price history
+51.0% since first listed26 events — show timeline
- 2026-06-16 Listed $127,500 SOMO
- 2026-06-16 Listed $127,500 OGAR
- 2023-11-30 Sold (Public Records) — Public Records
- 2023-11-28 Sold (MLS) — SOMO
- 2023-11-28 Sold (MLS) — OGAR
- 2023-10-25 Pending — SOMO
- 2023-10-25 Relisted — SOMO
- 2023-10-19 Pending — SOMO
- 2023-10-19 Pending — OGAR
- 2023-08-17 Relisted — OGAR
- 2023-08-17 Relisted — SOMO
- 2023-08-02 Delisted — OGAR
- 2023-08-01 Delisted — SOMO
- 2023-07-20 Pending — SOMO
- 2023-07-20 Pending — OGAR
- 2023-06-14 Price Changed $93,000 SOMO
- 2023-06-14 Price Changed $93,000 OGAR
- 2023-04-25 Price Changed $99,000 SOMO
- 2023-04-25 Price Changed $99,000 OGAR
- 2023-04-14 Listed $120,000 SOMO
- 2023-04-14 Listed $120,000 OGAR
- 2017-05-31 Sold (MLS) — OGAR
- 2017-05-31 Sold (MLS) — SOMO
- 2017-02-01 Listed $84,463 OGAR
- 2017-02-01 Listed $84,463 SOMO
- 2005-09-29 Sold (Public Records) — Public Records
Property tax history
+3.7%/yrLatest (2025): $959 · +24.5% YoY. Source: county tax records.
Cash-flow waterfall
monthlySold comps — $/sqft
last 12 mo · ≤1 miLoading sold comps…