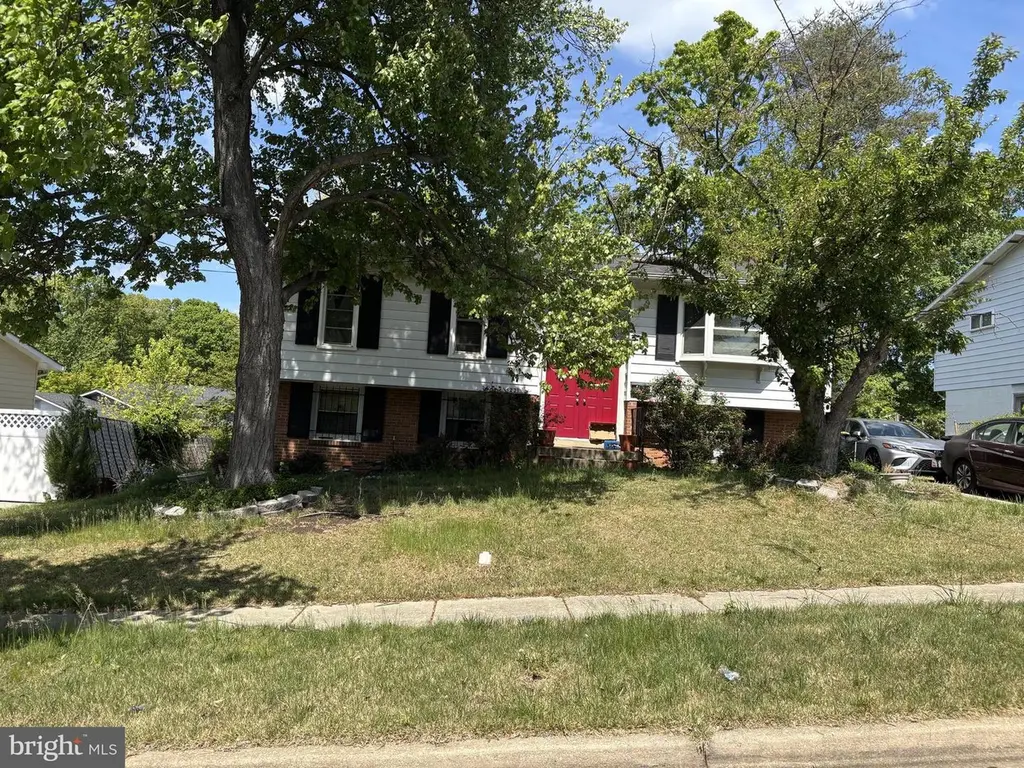
4231 Kinmount Rd · Lanham, MD
Flood risk 1/10 · Minimal
- FEMA flood zone
- X (unshaded)
- Chance of flooding over 30 yrs
- 0.0%
- Est. flood insurance / yr
- $473 – $860
Fire risk 1/10 · Minimal
- Est. fire insurance / yr
- $755 – $1,403
Heat risk 7/10 · Major
- Hot days now (above 104°F)
- 7 days/yr
- Hot days in 30 yrs
- 15 days/yr
Wind risk 4/10 · Minor
- Chance of severe wind over 30 yrs
- 21.0%
Air-quality risk 4/10 · Minor
- Unhealthy air days now
- 4 days/yr
- Unhealthy air days in 30 yrs
- 5 days/yr
Risk factors via First Street. Map © Google.
Why this score? — see what drove the C+ grade
The composite is a weighted blend of 9 inputs, each scored 0–100. Each bar is that input's sub-score; the figure is the points it added to the 100-point composite (weight × sub-score).
- Cash flow +27.1/30.0
- DSCR +9.4/10.0
- 1% rule +7.9/10.0
- ARV discount +7.5/15.0
- Livability +3.3/5.0
- Condition / age +2.5/5.0
- Rent growth +2.0/5.0
- Schools +1.7/10.0
- Appreciation +0.0/10.0
$200,000
🖨 Deal sheet 📄 Offer letter ✓ Due diligence
Listing remarks
ONLINE AUCTION: This auction takes place on the Ashland Auction Group Website Bidding Platform. Bidding begins 6/18/2026 @ 10:00 AM. Bidding ends 6/22/2026 @ 1:00 PM. List Price is Suggested Opening Bid. Deposit: $20,000. To increase to 10% of the total purchase price within 48 hours of the auction ending. Single-Family Home located in the Lanham area of Prince George’s County, Maryland. Located near the New Carrollton, Seabrook, and Glenn Dale areas. JUST MINUTES to NASA Goddard Space Flight Center, Seabrook MARC Station, Greenbelt Park, and Woodmore Towne Centre. Easy access to Annapolis Rd (MD-450), Martin Luther King Jr. Hwy (MD-704), I-495 Capital Beltway, and the Baltimore-Washi
Key facts
- Greenbelt park
- Single-family home
- 6,586 sq ft lot
Tags
Property features AI
Exterior
- Parking: Driveway parking; Driveway fits 2 cars; Total of 2 garage/parking spaces
- Utilities: Public water; Public sewer
- Home design: Detached property; Fee simple ownership; Year built (source): Assessor
- Construction: Frame construction; Other foundation
- Exterior features: Detached structure; Above-grade and below-grade other structures; Tidal water: No; Ground rent paid annually
Interior
- Bedrooms: 3 bedrooms on main level
- Bathrooms: 2 full bathrooms; 1 half bathroom
- Heating & cooling: Other heating; Other cooling; Other hot water
- Interior features: One fireplace; Finished above-grade living area per assessor
Neighborhood map
What this means for you Summary
Snapshot
- This is a 3-bed/2.5-bath single-family listed at $200k.
Deal economics
- At list price, monthly cash flow is $565 ($7k/yr) — positive.
- The deal already cash-flows at list — no discount required.
- Meets the 1% rule at list price ($3k rent vs $200k).
- Recommended offer: $197k (1.5% below list) — sets the bar for market timing.
- Cap rate 9.7% vs local median 4.2% in Lanham — top-decile yield for the area; either an underpriced asset or a hidden risk that comps aren't pricing in. Stress-test before assuming the spread holds.
Location & tenants
- Location reads 66/100 on livability (#244 in MD) — a middle-class / working-renter tenant base. Strengths: employment A+, housing A+; Watch: health & safety C-, crime D, schools D-.
- Prince George'S County Public Schools (suburban): math 8% / reading 24% proficiency, ranked #21 of 24 in MD (top 88%) — low school quality limits family demand, transient renter base, plan for 1-2y turnover.
- Market conditions: Rents soft (-1.9%/yr); 124 active listings in the ZIP; 9 comparable units currently listed for rent nearby; rentals leasing fast (median 10d on market — plan ~1-2 weeks tenant-placement turnaround); solid renter incomes; 1,481 units permitted in Prince George's County in 2024 (0 in 5+ unit buildings).
Forward outlook
- Local home prices are declining (-3.0%/yr); year-one equity from $1k of loan paydown is wiped out by about $6k of value loss. Plan a longer hold.
- Prince George's County population projected at +18% by 2050 — long-run rental-demand tailwind backs the buy-and-hold thesis.
Negotiation context
- It's been on market 28 days — a 2% lower offer ($197k) is reasonable based on typical stale-listing flexibility.
Risks & watch-outs
- Climate carrying-cost: extreme-heat days projected 7→15/yr by 2055 (HVAC capex compounding) — expect insurance premiums to compound above CPI over the hold.
Questions for the listing agent
- Built in 1968 — when were the roof, HVAC, electrical panel, plumbing, and water heater last replaced?
- Is there a deadline driving the sale (1031 exchange, divorce, estate, relocation)? That informs how much negotiation room exists.
- Schools are D-rated, which usually means shorter tenancies and higher turnover. Who's the typical renter profile here, and what's been the actual vacancy rate?
- Crime grade is D in this area — have there been break-ins, vandalism, or insurance claims at this property in the last 3 years? What carrier currently insures it and at what premium?
- What's the average days-on-market for RENTAL listings here right now (not sales)? A rising rental-DOM trend means longer vacancies and softer asking-rent achievability than the comps imply.
- What's the recent tenant-quality profile in this submarket — average credit score on applications, eviction rate, late-payment / NSF rate, and stable-employment percentage? A property-management company in the area should have these aggregated.
- How much new for-sale + rental construction is in the pipeline within 1–3 miles? Heavy new supply typically softens prices + rents 12–24 months out; constrained supply supports both.
Investment metrics
- 1% rule
- 1.29% ✓
- Cap rate
- 9.69%
- Cash-on-cash
- 12.12%
- DSCR
- 1.54
- GRM
- 6.4
CMA / ARV
- ARV (on-the-fly)
- $451,878
- Comps found
- 10
Show comp detail 10 sales within ~0.75 mi
| Address | Dist | Beds/Ba | Sqft | Sold | Price | $/sf | Match |
|---|---|---|---|---|---|---|---|
| 4029 92nd | 0.40mi | 3/2.0 | 1,202 (-1%) | 11mo | $475,000 | $395 | 68 |
| 9004 Varnum St | 0.30mi | 4/3.0 (+1) | 1,236 (+2%) | 19mo | $460,000 | $372 | 61 |
| 9007 Varnum St | 0.32mi | 3/1.0 | 1,376 (+13%) | 5mo | $325,000 | $236 | 53 |
| 9106 Hobart St | 0.59mi | 3/2.5 | 1,262 (+4%) | 21mo | $385,000 | $305 | 49 |
| 3815 Asquith Ct | 0.69mi | 3/4.0 | 1,212 (-0%) | 22mo | $470,000 | $388 | 43 |
| 9213 Rolling View Dr | 0.46mi | 3/2.0 | 1,050 (-14%) | 18mo | $435,000 | $414 | 38 |
| 4001 91st Ave | 0.59mi | 3/2.0 | 1,367 (+12%) | 18mo | $400,000 | $293 | 35 |
| 5411 Arnold Dr | 0.46mi | 3/1.0 | 1,050 (-14%) | 20mo | $390,000 | $371 | 33 |
| 9021 Taylor St | 0.67mi | 4/2.0 (+1) | 1,360 (+12%) | 13mo | $287,000 | $211 | 31 |
| 5513 Cordona St | 0.72mi | 4/2.0 (+1) | 1,040 (-15%) | 4mo | $360,000 | $346 | 31 |
Match score weights: distance 35% · size 25% · config 20% · recency 20%. Top-matched comps best support the ARV.
Projected returns pro-forma
-3.0% appreciation · 0.0% rent growth · sell at horizon
- IRR
- -1.9%
- Equity multiple
- 0.93×
- Total profit
- $-3,873
- Equity at exit
- $29,821
- IRR
- 4.0%
- Equity multiple
- 1.25×
- Total profit
- $14,124
- Equity at exit
- $17,292
Cash invested: $56,000 (down + closing). Projections, not guarantees.
Landlord ↔ Tenant lean methodology
- Overall (STATE)
- 27 Tenant-Leaning
- State Maryland
- 27 Tenant-Leaning · D+14
- County
- — inherits STATE
- City
- — inherits STATE
ZIP-level market 20706
- Rents YoY
- -1.9%
- Active inventory
- 124
- Price-to-rent
- 6.4×
Monthly cashflow live
- Estimated rent
- $2,584 high interval (Pro) →
- Mortgage (P&I)
- −$1,049
- Tax from tax record
- −$344 /mo · $4,128/yr
- Insurance
- −$83
- HOA
- −$0
- Vacancy / Maint / Mgmt
- −$543
- Net cashflow
- $565
Break-even live
UW: 25.0% down · 7.5% · 30yr · 1.5% tax · 5.0% vac · 8.0% maint · 8.0% mgmt
Financing live
Cash to close
- Down payment
- $50,000
- Closing costs
- $6,000
- Reserves months
- —
- Total cash needed
- —
Loan-product check · same deal, 3 products live
Conventional
25% down · 7.5% · 30yr
- Down + closing
- —
- Monthly P&I
- —
- Monthly cashflow
- —
- DSCR
- —
- Eligible?
- —
Personal DTI + credit; lowest rate.
DSCR
20% down · 8.5% · 30yr
- Down + closing
- —
- Monthly P&I
- —
- Monthly cashflow
- —
- DSCR
- —
- Eligible?
- —
No personal income docs; deal must DSCR.
Hard money
10% down · 12.0% · 12mo
- Down + closing
- —
- Monthly P&I
- —
- Monthly cashflow
- —
- DSCR
- —
- Eligible?
- —
Short-term bridge; refi at stabilization.
Rent comps 9 comps
| Address | Beds | Baths | Sqft | Rent | $/sqft | DOM | Units | Dist |
|---|---|---|---|---|---|---|---|---|
| 8806 Braeside Dr Lanham, MD | 2.0 | 1.0 | 1498 | $1,800 | $1.20 | 10d | 1 | 0.23mi |
| 5345 85th Ave New Carrollton, MD | 1.0–3.0 | 1.0–2.0 | 979 | $2,149 | $2.19 | 1d | 18 | 1.00mi |
| 5618 Whitfield Chapel Rd Lanham, MD | 1.0–2.0 | 1.0 | 743 | $1,922 | $2.59 | 10d | 1 | 1.06mi |
| 4050 Garden City Dr Hyattsville, MD | 3.0 | 1.0–3.0 | 757 | $2,908 | $3.84 | 1d | 28 | 1.08mi |
| 5414 85th Ave #201 New Carrollton, MD | 3.0 | 2.0 | 1187 | $2,800 | $2.36 | 43d | 1 | 1.08mi |
| 3950 Garden City Dr Hyattsville, MD | 1.0–2.0 | 1.0–2.0 | 819 | $2,716 | $3.32 | 43d | 13 | 1.16mi |
| 1509 4th St Glenarden, MD | 2.0 | 1.0 | 768 | $2,050 | $2.67 | 18d | 1 | 1.18mi |
| 7730 Harkins Rd Lanham, MD | 2.0 | 1.0–2.0 | 810 | $2,802 | $3.46 | 1d | 66 | 1.23mi |
| 4851 Ellin Rd Hyattsville, MD | 1.0–2.0 | 1.0–2.0 | 916 | $3,152 | $3.44 | 1d | 109 | 1.26mi |
Listing history 15 events
-
2026-06-18days on market $200,000 Active 28 DOM
-
2026-06-17days on market $200,000 Active 27 DOM
-
2026-06-16days on market $200,000 Active 26 DOM
-
2026-06-15days on market $200,000 Active 25 DOM
-
2026-06-13remarks 693-char remark
-
2026-06-13days on market $200,000 Active 23 DOM
-
2026-06-10days on market $200,000 Active 19 DOM
-
2026-06-08days on market $200,000 Active 18 DOM
-
2026-06-07days on market $200,000 Active 17 DOM
-
2026-06-04days on market $200,000 Active 14 DOM
-
2026-06-03days on market $200,000 Active 13 DOM
-
2026-06-02days on market $200,000 Active 12 DOM
-
2026-06-01days on market $200,000 Active 11 DOM
-
2026-05-31days on market $200,000 Active 10 DOM
-
2026-05-21$200,000 Active
ⓘ Source: listings_history table (triggers on properties + properties_extension) + one-shot
backfill from property_details.listing_events for pre-trigger history.
Tax reassessment forecast MD · Partial reset (capped growth)
- Current annual tax
- $4,128 · $344/mo
- Projected year-2 tax
- $4,128 · $344/mo
- Expected delta
- $0/yr ($0/mo · 0.0%)
ⓘ Screening estimate from a state-policy table — verify with the county assessor before closing.
Climate risk First Street
- Flood 1/10 Low FEMA zone X (unshaded) · 0% chance over 30 yrs
- Wildfire 1/10 Low
- Heat 7/10 Severe 7 d/yr ≥104°F today · 15 d/yr by 30 yrs out
- Wind 4/10 Moderate 21% chance of damaging wind over 30 yrs
- Air quality 4/10 Moderate 4 unhealthy d/yr today · 5 by 30 yrs out
Nearby sold comps map
Loading sold comps map…
Walkable amenities ~0.75 mi
Loading nearby amenities…
Taxation est. · year 1
- Rental income
- $31,012
- − Mortgage interest
- −$11,203
- − Property taxes
- −$4,128
- − Insurance
- −$1,000
- − Repairs & maintenance
- −$2,481
- − Management
- −$2,481
- − Depreciation
- −$5,818
- Taxable income
- $3,900
- Est. tax owed @ 24.0%
- −$936
- After-tax cash flow
- $5,849/yr
For passive investors: Depreciation is non-cash, so a rental often shows a tax loss while cash-flowing — sheltering income. Rental losses are passive: they offset passive income freely, and up to $25,000/yr can offset ordinary (W-2) income if you actively participate and your MAGI is under $100k (phasing out to $0 by $150k); unused losses carry forward. On sale, claimed depreciation is recaptured at up to 25%, and gains may owe capital-gains tax (a 1031 exchange can defer both). Figures are a year-1 estimate at your 24.0% rate — not tax advice; consult a CPA.
Schools (NCES district)
- District
- Prince George'S County Public Schools
- NCES district ID
- 2400510
- Math proficiency
- 8% ▼ -11.00%
- Reading proficiency
- 24% ▼ -9.00%
- Median HH income
- $73,967
- Composite
- 16.82/100
- National rank
- #9151
- State rank
- #21 of 24 in MD
Livability — Lanham
- Score
- 66/100
- State rank
- #244
- US rank
- #12106
Category grades
Schools grade is shown separately in the Schools card above.
Census & demographics
- Census place
- Lanham, MD
- County
- Prince Georges County · 919,866 people
- City population
- 43,225
- Metro
- Washington-Arlington-Alexandria, DC-VA-MD-WV
- Population (ZIP)
- 42,612
- Household income
- $104,523
- Rent vs Own
- Severe rent burden
- 641.0
Population outlook (Prince George's County) Hauer SSP2
- Today (2025)
- 1,005,426 people
- By 2030
- 1,048,416 · +4.3%
- By 2040
- 1,123,425 · +11.7%
- By 2050
- 1,183,220 · +17.7%
- By 2075
- 1,306,202 · +29.9%
- By 2100
- 1,408,179 · +40.1%
Race, ethnicity, and origin ACS 2023
- Neighborhood character
- Diverse neighborhood (Simpson 0.58)
- Race & ethnicity
- Black 59% Hispanic / Latino 26% Two or more races 10% White 7% Asian 5%
- Hispanic origin (detail)
- Mexican 9% Dominican 2%
- Common ancestry
- Hispanic 1% Swiss 1%
- Foreign-born
- 37% · Canada, United Kingdom, Vietnam
- Languages at home
- 60% English-only · Spanish 23% French/Haitian/Cajun 4% Other Indo-European 3%
Political lean MEDSL · Prince George's
- 2024 margin
- Solid D (+75.2) · D 86.3% · R 11.2% · Other 2.5%
- 2008→2024 swing
- -3.3pp toward R · 2008: 78.5pp · 2024: 75.2pp
- All cycles
- 2024: D+75.2 2020: D+80.5 2016: D+81.0 2012: D+80.9 2008: D+78.5
Not yet ingested
- Civics
- —
Market trends
- HPI YoY
- ▼ -279.37%
- Current HPI
- 284.8481
- Rent YoY
- ▼ -1.85%
- Metro
- Washington-Arlington-Alexandria, DC-VA-MD-WV
- State GDP YoY
- ▲ 2.97%
- F500 in state
- 12
Industry mix (Fortune 500 HQ in MD)
| Industry | F500 HQs | Revenue |
|---|---|---|
| Aerospace / Defense | 1 | $71B |
|
||
| Utilities | 1 | $25B |
|
||
| Hotels | 1 | $24B |
|
||
| Consumer Goods | 1 | $7B |
|
||
| Real Estate | 1 | $6B |
|
||
| Chemicals | 1 | $2B |
|
||
Price history
1 event — show timeline
- 2026-05-21 Listed $200,000 BRIGHT MLS
Property tax history
+5.3%/yrLatest (2025): $4,128 · +3.9% YoY. Source: county tax records.
Cash-flow waterfall
monthlySold comps — $/sqft
last 12 mo · ≤1 miLoading sold comps…