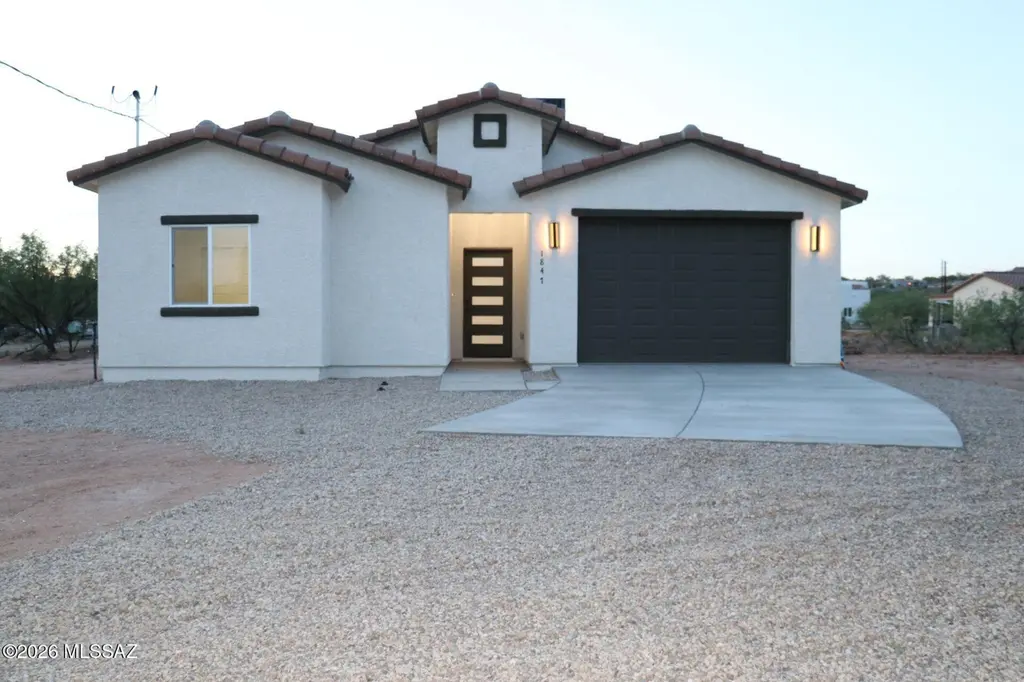
1803 Salvador Ct · Rio Rico, AZ
Flood risk 3/10 · Minor
- FEMA flood zone
- X (unshaded)
- Chance of flooding over 30 yrs
- 0.2%
- Est. flood insurance / yr
- $507 – $1,088
Fire risk 7/10 · Major
- Est. fire insurance / yr
- $610 – $1,132
Heat risk 7/10 · Major
- Hot days now (above 99°F)
- 7 days/yr
- Hot days in 30 yrs
- 20 days/yr
Wind risk 1/10 · Minimal
- Chance of severe wind over 30 yrs
- —
Air-quality risk 1/10 · Minimal
- Unhealthy air days now
- 0 days/yr
- Unhealthy air days in 30 yrs
- 0 days/yr
Risk factors via First Street. Map © Google.
Why this score? — see what drove the D grade
The composite is a weighted blend of 9 inputs, each scored 0–100. Each bar is that input's sub-score; the figure is the points it added to the 100-point composite (weight × sub-score).
- Appreciation +10.0/10.0
- ARV discount +8.3/15.0
- Cash flow +7.8/30.0
- Livability +3.2/5.0
- Rent growth +2.5/5.0
- Condition / age +2.5/5.0
- 1% rule +2.3/10.0
- DSCR +1.9/10.0
- Schools +1.7/10.0
$248,000
🖨 Deal sheet (PDF) 📄 Offer letter ✓ Due diligence
Listing remarks
Brand-new 2026 construction tucked away on a spacious . 27-acre cul-de-sac lot with NO HOA! This stunning 3 bedroom, 2 bathroom home offers 1,380 sq ft of thoughtfully designed living space featuring an open-concept layout, abundant natural light, and an oversized kitchen island ideal for entertaining, meal prep, and everyday living. Go under contract early and personalize the home with your choice of fixtures, finishes, and colors to truly make it your own. Enjoy the freedom of extra outdoor space with room to relax, play, or create your dream backyard. Eligible buyers may also qualify for 0% down USDA financing. * Photos are from a model home and are used to showcase the floor plan and de
Key facts
- 0.27 acre lot
- Garage
- Built 2026
Property features AI
Finance
- Other: Zoned SCC - R-3
Exterior
- Parking: Attached 1-car garage; 1 covered parking space
- Security: Smoke detector(s)
- Utilities: Water from a water company; Sewer connected
- Home design: Single-family home; One story; Irregular lot shape
- Construction: Frame with stucco exterior; Tile roof; Built area approximately 1,380 (living area)
- Exterior features: Decorative gravel landscaping; Located on a cul-de-sac; Paved road access; Road maintenance by county
Interior
- Kitchen: Dishwasher; Electric range; Electric oven; Microwave
- Flooring: Ceramic tile
- Bathrooms: 2 full bathrooms
- Heating & cooling: Electric heating; Central air; Ceiling fans
- Interior features: Kitchen island
- Laundry & utility: Laundry closet
Neighborhood map
What this means for you Summary
Snapshot
- This is a 3-bed/2.0-bath land listed at $248k.
Deal economics
- At list price, monthly cash flow is $-275 ($-3k/yr) — negative.
- To cash-flow at today's rent, offer at most $208k (16.0% below list).
- To meet the 1% rule (rent ≥ 1% of price), the offer needs to be $182k (26.5% below list).
- Recommended offer: $182k (26.5% below list) — sets the bar for 1% rule.
- Cap rate 5.0% vs local median 4.1% in Rio Rico — meaningfully above typical; check what's discounted (condition, days-on-market, listing class) to confirm the premium yield is real.
Location & tenants
- Location reads 63/100 on livability (#115 in AZ) — a middle-class / working-renter tenant base. Strengths: cost of living A+, housing A+; Watch: health & safety C-, employment D+, crime F.
- Santa Cruz Valley Unified District (4458) (town): math 12% / reading 26% proficiency, ranked #184 of 249 in AZ (top 74%) — low school quality limits family demand, transient renter base, plan for 1-2y turnover; 62% free/reduced lunch — lower-income household profile, screen leases tightly.
- Zoned schools: San Cayetano Elementary School (math 2% / reading 32%, grade F, #810 of 1,109 statewide, top 73%, 393 students, 69% FRL); Coatimundi Middle School (math 16% / reading 32%, grade F, #109 of 218 statewide, top 51%, 473 students, 69% FRL); Rio Rico High School (math 13% / reading 21%, grade F, #252 of 381 statewide, top 67%, 1,414 students, 72% FRL).
- Market conditions: 414 active listings in the ZIP; 8 comparable units currently listed for rent nearby; rentals leasing fast (median 4d on market — plan ~1-2 weeks tenant-placement turnaround); 340 units permitted in Santa Cruz County in 2024 (0 in 5+ unit buildings).
- This rent runs 36% of the median local income ($62k/yr) — at the standard rent-burdened threshold; future hikes will face affordability resistance.
Forward outlook
- In year one you build about $27k of equity ($2k loan paydown + $25k appreciation (10.0% local appreciation)).
- Santa Cruz County population projected at -22% by 2050 — secular population decline; favor cash flow + early exit over multi-decade hold.
- By year 2, paydown + projected appreciation supports a ~$43k cash-out refi (75% LTV) — recoverable capital for the next deal without selling this one.
Negotiation context
- It's been on market 45 days — a 3% lower offer ($241k) is reasonable based on typical stale-listing flexibility.
- 2 sale attempts since 18y ago with the ask held roughly flat each time — persistent listings suggest the price (not the market) is what's stuck; bring a comps-based counter.
- Current owner paid $18k; list at $248k implies a 1317% gain — meaningful room to come down on a strong offer.
Risks & watch-outs
- Climate carrying-cost: major wildfire risk; extreme-heat days projected 7→20/yr by 2055 (HVAC capex compounding) — expect insurance premiums to compound above CPI over the hold.
Questions for the listing agent
- What do current leases actually rent for vs. the listed asking? Can we see a recent rent roll and the last 12 months of T-12 income?
- It's been on market 45 days. Have you received any prior offers? Is the seller open to a 27% concession, seller financing, or rate buy-down credit?
- Is there a deadline driving the sale (1031 exchange, divorce, estate, relocation)? That informs how much negotiation room exists.
- Schools are F-rated, which usually means shorter tenancies and higher turnover. Who's the typical renter profile here, and what's been the actual vacancy rate?
- Crime grade is F in this area — have there been break-ins, vandalism, or insurance claims at this property in the last 3 years? What carrier currently insures it and at what premium?
- The area grade is low — what's the realistic commute time and amenity access for the typical tenant pool here? Any planned neighborhood developments (good or bad) we should know about?
- What's the average days-on-market for RENTAL listings here right now (not sales)? A rising rental-DOM trend means longer vacancies and softer asking-rent achievability than the comps imply.
- What's the recent tenant-quality profile in this submarket — average credit score on applications, eviction rate, late-payment / NSF rate, and stable-employment percentage? A property-management company in the area should have these aggregated.
- How much new for-sale + rental construction is in the pipeline within 1–3 miles? Heavy new supply typically softens prices + rents 12–24 months out; constrained supply supports both.
Investment metrics
- 1% rule
- 0.73% ✗
- Cap rate
- 4.96%
- Cash-on-cash
- -4.74%
- DSCR
- 0.79
- GRM
- 11.3
CMA / ARV
- ARV (median comp)
- $252,314
- List price
- $248,000
- Delta
- -1.71%
- Verdict
- FAIR
- Comps
- 20 within 1.0 mi
Projected returns pro-forma
10.0% appreciation · 3.0% rent growth · sell at horizon
- IRR
- 20.9%
- Equity multiple
- 2.69×
- Total profit
- $117,608
- Equity at exit
- $223,418
- IRR
- 19.0%
- Equity multiple
- 6.19×
- Total profit
- $360,142
- Equity at exit
- $481,809
Cash invested: $69,440 (down + closing). Projections, not guarantees.
Landlord ↔ Tenant lean methodology
- Overall (STATE)
- 87 Strongly Landlord-Friendly
- State Arizona
- 87 Strongly Landlord-Friendly · R+3
- County
- — inherits STATE
- City
- — inherits STATE
ZIP-level market 85648
- Home prices YoY
- 21.0%
- Active inventory
- 414
- Price-to-rent
- 11.3×
Monthly cashflow live
- Estimated rent
- $1,822 high interval (Pro) →
- Mortgage (P&I)
- −$1,301
- Tax est. 1.5%
- −$310 /mo · $3,720/yr
- Insurance
- −$103
- HOA
- −$0
- Vacancy / Maint / Mgmt
- −$383
- Net cashflow
- $-275
Break-even live
Sensitivity live
| Price | -10% $-103 | -5% $-189 | +0% $-275 | +5% $-360 | +10% $-446 |
|---|---|---|---|---|---|
| Rent | -10% $-418 | -5% $-347 | +0% $-275 | +5% $-203 | +10% $-131 |
| Rate | -1.0pp $-150 | -0.5pp $-211 | base $-275 | +0.5pp $-339 | +1.0pp $-404 |
UW: 25.0% down · 7.5% · 30yr · 1.5% tax · 5.0% vac · 8.0% maint · 8.0% mgmt
Financing live
Cash to close
- Down payment
- $62,000
- Closing costs
- $7,440
- Reserves months
- —
- Total cash needed
- —
Loan-product check · same deal, 3 products live
Conventional
25% down · 7.5% · 30yr
- Down + closing
- —
- Monthly P&I
- —
- Monthly cashflow
- —
- DSCR
- —
- Eligible?
- —
Personal DTI + credit; lowest rate.
DSCR
20% down · 8.5% · 30yr
- Down + closing
- —
- Monthly P&I
- —
- Monthly cashflow
- —
- DSCR
- —
- Eligible?
- —
No personal income docs; deal must DSCR.
Hard money
10% down · 12.0% · 12mo
- Down + closing
- —
- Monthly P&I
- —
- Monthly cashflow
- —
- DSCR
- —
- Eligible?
- —
Short-term bridge; refi at stabilization.
Rent comps 8 comps
| Address | Beds | Baths | Sqft | Rent | $/sqft | DOM | Units | Dist |
|---|---|---|---|---|---|---|---|---|
| 125 Alemania Ct Rio Rico, AZ | 3.0 | 2.0 | 1340 | $1,500 | $1.12 | 12d | 1 | 0.24mi |
| 1878 Circulo Girasol Rio Rico, AZ | 3.0 | 2.0 | 1584 | $1,700 | $1.07 | 3d | 1 | 0.46mi |
| 1859 Tijuana Ct Rio Rico, AZ | 2.0 | 2.0 | 1233 | $1,600 | $1.30 | 3d | 1 | 0.47mi |
| 117 Vereda Patria Rio Rico, AZ | 3.0 | 2.0 | 1567 | $2,500 | $1.60 | 3d | 1 | 0.61mi |
| 1808 Cajeme Ct Rio Rico, AZ | 4.0 | 2.0 | 1725 | $1,850 | $1.07 | 3d | 1 | 1.01mi |
| 1731 Avenida Pastor Rio Rico, AZ | 3.0 | 2.0 | 1568 | $1,800 | $1.15 | 3d | 1 | 1.23mi |
| 54 Camino Olympia Rio Rico, AZ | 3.0 | 2.0 | 1556 | $1,800 | $1.16 | 3d | 1 | 1.43mi |
| 65 Avenida Pastor Rio Rico, AZ | 3.0 | 2.0 | 1406 | $2,200 | $1.56 | 3d | 1 | 1.44mi |
Listing history 19 events
-
2026-06-21days on market $248,000 Active 45 DOM
-
2026-06-18days on market $248,000 Active 42 DOM
-
2026-06-17days on market $248,000 Active 41 DOM
-
2026-06-16days on market $248,000 Active 40 DOM
-
2026-06-15days on market $248,000 Active 39 DOM
-
2026-06-13days on market $248,000 Active 37 DOM
-
2026-06-10days on market $248,000 Active 34 DOM
-
2026-06-09days on market $248,000 Active 33 DOM
-
2026-06-08days on market $248,000 Active 32 DOM
-
2026-06-07days on market $248,000 Active 31 DOM
-
2026-06-05days on market $248,000 Active 28 DOM
-
2026-06-03days on market $248,000 Active 27 DOM
-
2026-06-02days on market $248,000 Active 26 DOM
-
2026-06-01days on market $248,000 Active 25 DOM
-
2026-05-31days on market $248,000 Active 24 DOM
-
2026-05-07$248,000 Active 717-char remark
-
2026-01-30soldstatus $17,500
-
2009-09-04historical
-
2008-09-04$9,899
ⓘ Source: listings_history table (triggers on properties + properties_extension) + one-shot
backfill from property_details.listing_events for pre-trigger history.
Climate risk First Street
- Flood 3/10 Moderate FEMA zone X (unshaded) · 20% chance over 30 yrs
- Wildfire 7/10 Severe
- Heat 7/10 Severe 7 d/yr ≥99°F today · 20 d/yr by 30 yrs out
- Wind 1/10 Low
- Air quality 1/10 Low 0 unhealthy d/yr today · 0 by 30 yrs out
Nearby sold comps map
Loading sold comps map…
Walkable amenities ~0.75 mi
Loading nearby amenities…
Taxation est. · year 1
- Rental income
- $21,863
- − Mortgage interest
- −$13,892
- − Property taxes
- −$3,720
- − Insurance
- −$1,240
- − Repairs & maintenance
- −$1,749
- − Management
- −$1,749
- − Depreciation
- −$7,215
- Taxable loss
- −$7,702
- Est. tax savings @ 24.0%
- +$1,848
- After-tax cash flow
- $-1,446/yr
For passive investors: Depreciation is non-cash, so a rental often shows a tax loss while cash-flowing — sheltering income. Rental losses are passive: they offset passive income freely, and up to $25,000/yr can offset ordinary (W-2) income if you actively participate and your MAGI is under $100k (phasing out to $0 by $150k); unused losses carry forward. On sale, claimed depreciation is recaptured at up to 25%, and gains may owe capital-gains tax (a 1031 exchange can defer both). Figures are a year-1 estimate at your 24.0% rate — not tax advice; consult a CPA.
Schools (NCES district)
- District
- Santa Cruz Valley Unified District (4458)
- NCES district ID
- 0407520
- Math proficiency
- 12% ▼ -19.00%
- Reading proficiency
- 26% ▼ -9.00%
- Median HH income
- $48,019
- Composite
- 16.84/100
- National rank
- #9147
- State rank
- #184 of 249 in AZ
Livability — Rio Rico
- Score
- 63/100
- State rank
- #115
- US rank
- #15321
Category grades
Schools grade is shown separately in the Schools card above.
Census & demographics
- Census place
- Rio Rico, AZ
- County
- Santa Cruz County · 22,118 people
- City population
- 22,118
- Metro
- Nogales, AZ
- Population (ZIP)
- 22,118
- Household income
- $61,519
- Rent vs Own
- Severe rent burden
- 407.0
Population outlook (Santa Cruz County) Hauer SSP2
- Today (2025)
- 43,796 people
- By 2030
- 42,097 · -3.9%
- By 2040
- 38,235 · -12.7%
- By 2050
- 34,224 · -21.9%
- By 2075
- 26,014 · -40.6%
- By 2100
- 18,165 · -58.5%
Race, ethnicity, and origin ACS 2023
- Neighborhood character
- Predominantly Hispanic (86%)
- Race & ethnicity
- Hispanic / Latino 86% Two or more races 48% White 12%
- Hispanic origin (detail)
- Mexican 83%
- Common ancestry
- Lithuanian 1% Slovak 1% Iranian 1%
- Foreign-born
- 30% · Canada
- Languages at home
- 21% English-only · Spanish 79%
Political lean MEDSL · Santa Cruz
- 2024 margin
- D (+18.6) · D 58.9% · R 40.3%
- 2008→2024 swing
- -12.7pp toward R · 2008: 31.3pp · 2024: 18.6pp
- All cycles
- 2024: D+18.6 2020: D+35.5 2016: D+47.1 2012: D+37.8 2008: D+31.3
Not yet ingested
- Civics
- —
Market trends
- HPI YoY
- ▲ 72.18%
- Current HPI
- 415.2167
- Rent YoY
- —
- Metro
- Nogales, AZ
- State GDP YoY
- ▲ 4.54%
- F500 in state
- 20
Industry mix (Fortune 500 HQ in AZ)
| Industry | F500 HQs | Revenue |
|---|---|---|
| Technology | 2 | $13B |
|
||
| Mining / Metals | 1 | $23B |
|
||
| Environmental Services | 1 | $16B |
|
||
| Metals / Steel | 1 | $14B |
|
||
| Technology Distribution | 1 | $9B |
|
||
| Homebuilding | 1 | $8B |
|
||
Price history
+2405.3% since first listed4 events — show timeline
- 2026-05-07 Listed $248,000 MLSSAZ
- 2026-01-30 Sold (Public Records) $17,500 Public Records
- 2009-09-04 Listing Removed — MLSSAZ
- 2008-09-04 Listed $9,899 MLSSAZ
Property tax history
-4.8%/yrLatest (2025): $133 · +6.0% YoY. Source: county tax records.
Cash-flow waterfall
monthlySold comps — $/sqft
last 12 mo · ≤1 miLoading sold comps…