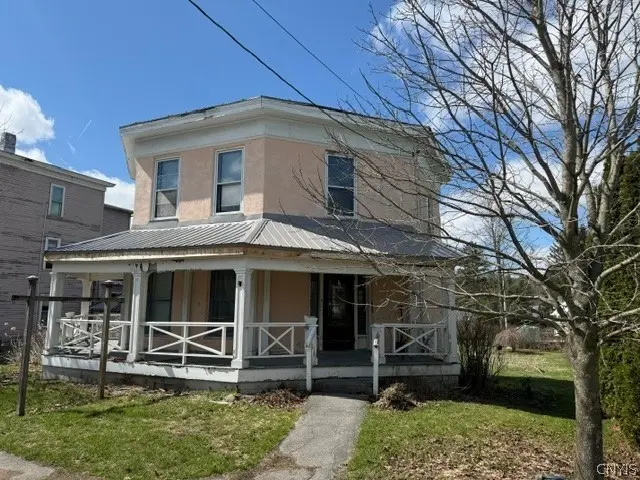
1607 State Highway 26 · DeRuyter, NY
Flood risk 1/10 · Minimal
- FEMA flood zone
- X (unshaded)
- Chance of flooding over 30 yrs
- 0.0%
- Est. flood insurance / yr
- $473 – $860
Fire risk 1/10 · Minimal
- Est. fire insurance / yr
- $691 – $1,283
Heat risk 2/10 · Minimal
- Hot days now (above 90°F)
- 8 days/yr
- Hot days in 30 yrs
- 18 days/yr
Wind risk 2/10 · Minimal
- Chance of severe wind over 30 yrs
- 1.0%
Air-quality risk 2/10 · Minimal
- Unhealthy air days now
- 0 days/yr
- Unhealthy air days in 30 yrs
- 1 days/yr
Risk factors via First Street. Map © Google.
Why this score? — see what drove the B+ grade
The composite is a weighted blend of 9 inputs, each scored 0–100. Each bar is that input's sub-score; the figure is the points it added to the 100-point composite (weight × sub-score).
- Cash flow +30.0/30.0
- 1% rule +10.0/10.0
- DSCR +10.0/10.0
- Appreciation +10.0/10.0
- ARV discount +7.5/15.0
- Schools +3.3/10.0
- Livability +3.1/5.0
- Rent growth +2.5/5.0
- Condition / age +2.5/5.0
$79,900
🖨 Deal sheet 📄 Offer letter ✓ Due diligence
Listing remarks
Would you like a piece of history nestled in a small-town of South Otselic in Upstate, NY? Charming historic octagon house offering a rare architectural gem with timeless character. This unique eight-sided residence showcases period details and exciting opportunities. Unique office spaces, a B & B or a fancy residential home are some ideas for purchasing it. It has an open eat-in size kitchen, a large front room, four bedrooms, 1.5 baths, and a nice deep back yard. It needs painting on the outside, and a fresh coat of paint and tlc on the inside. But once this is completed you will have an amazing piece of history and a distinctive property with classic appeal. Whatever your usage may
Key facts
- Deep back yard
- Distinctive property
- Period details
Tags
Property features AI
Exterior
- Parking: Detached garage; 1-car garage
- Utilities: Public water connected; Septic tank sewer
- Home design: 2-story residence; Resale property; Stucco exterior
- Construction: Stone foundation; Stucco construction; Existing year built
- Exterior features: Dirt driveway; Gravel driveway; Rectangular lot; Main thoroughfare frontage
Interior
- Kitchen: Eat-in country kitchen
- Bedrooms: One main-level bedroom
- Flooring: Hardwood; Vinyl; Varies
- Bathrooms: One full bathroom; One half bathroom; One main-level bathroom
- Heating & cooling: Oil forced-air heating; Has heating
- Interior features: Entrance foyer; Eat-in kitchen; Separate/formal living room; Country kitchen; Other interior features (see remarks); Bedroom on main level
- Laundry & utility: Washer included; Electric water heater
Neighborhood map
What this means for you Summary
Snapshot
- This is a 3-bed/1.5-bath single-family listed at $80k.
Deal economics
- At list price, monthly cash flow is $313 ($4k/yr) — positive.
- The deal already cash-flows at list — no discount required.
- Meets the 1% rule at list price ($1k rent vs $80k).
- Recommended offer: $75k (6.0% below list) — sets the bar for market timing.
Location & tenants
- Location reads 61/100 on livability (#900 in NY) — a middle-class / working-renter tenant base. Strengths: cost of living A+, housing A+; Watch: employment D, crime F, amenities F.
- Georgetown-South Otselic Central School District (rural): math 40% / reading 30% proficiency, ranked #692 of 755 in NY (top 92%) — families likely to look elsewhere, expect single-tenant / working-renter base with shorter leases.
- Market conditions: 8 active listings in the ZIP; 151 units permitted in Chenango County in 2024 (96 in 5+ unit buildings).
Forward outlook
- In year one you build about $9k of equity ($552 loan paydown + $8k appreciation (10.0% local appreciation)).
- Chenango County population projected at -26% by 2050 — secular population decline; favor cash flow + early exit over multi-decade hold.
- At projected returns (10.0% appreciation + 3.0% rent growth), your $22k cash investment doubles in ~2 years — after that, you're playing with house money.
- By year 4, paydown + projected appreciation supports a ~$30k cash-out refi (75% LTV) — recoverable capital for the next deal without selling this one.
Negotiation context
- It's been on market 66 days — a 6% lower offer ($75k) is reasonable based on typical stale-listing flexibility.
- Current owner paid $40k; list at $80k implies a 102% gain — meaningful room to come down on a strong offer.
Risks & watch-outs
- Watch-outs: property tax is 3.3% of price; built in 1860 — expect roof / HVAC / electrical / plumbing capex.
Questions for the listing agent
- It's been on market 66 days. Have you received any prior offers? Is the seller open to a 6% concession, seller financing, or rate buy-down credit?
- Built in 1860 — when were the roof, HVAC, electrical panel, plumbing, and water heater last replaced?
- Property tax is high relative to price — has the assessment been appealed recently, and will the sale trigger a re-assessment?
- Why hasn't it sold? Are there any deal-killer items the seller is aware of (foundation, flood, title, zoning, code violations)?
- Is there a deadline driving the sale (1031 exchange, divorce, estate, relocation)? That informs how much negotiation room exists.
- Crime grade is F in this area — have there been break-ins, vandalism, or insurance claims at this property in the last 3 years? What carrier currently insures it and at what premium?
- What's the average days-on-market for RENTAL listings here right now (not sales)? A rising rental-DOM trend means longer vacancies and softer asking-rent achievability than the comps imply.
- What's the recent tenant-quality profile in this submarket — average credit score on applications, eviction rate, late-payment / NSF rate, and stable-employment percentage? A property-management company in the area should have these aggregated.
- How much new for-sale + rental construction is in the pipeline within 1–3 miles? Heavy new supply typically softens prices + rents 12–24 months out; constrained supply supports both.
Investment metrics
- 1% rule
- 1.56% ✓
- Cap rate
- 11.00%
- Cash-on-cash
- 16.81%
- DSCR
- 1.75
- GRM
- 5.3
CMA / ARV
No comps found within radius.
Projected returns pro-forma
10.0% appreciation · 3.0% rent growth · sell at horizon
- IRR
- 36.8%
- Equity multiple
- 3.84×
- Total profit
- $63,571
- Equity at exit
- $71,980
- IRR
- 31.7%
- Equity multiple
- 8.67×
- Total profit
- $171,690
- Equity at exit
- $155,228
Cash invested: $22,372 (down + closing). Projections, not guarantees.
Landlord ↔ Tenant lean methodology
- Overall (STATE)
- 15 Strongly Tenant-Friendly
- State New York
- 15 Strongly Tenant-Friendly · D+10
- County
- — inherits STATE
- City
- — inherits STATE
ZIP-level market 13155
- Home prices YoY
- 8.4%
- Active inventory
- 8
- Price-to-rent
- 5.3×
Monthly cashflow live
- Estimated rent
- $1,247 medium interval (Pro) →
- Mortgage (P&I)
- −$419
- Tax from tax record
- −$219 /mo · $2,630/yr
- Insurance
- −$33
- HOA
- −$0
- Vacancy / Maint / Mgmt
- −$262
- Net cashflow
- $313
Break-even live
UW: 25.0% down · 7.5% · 30yr · 1.5% tax · 5.0% vac · 8.0% maint · 8.0% mgmt
Financing live
Cash to close
- Down payment
- $19,975
- Closing costs
- $2,397
- Reserves months
- —
- Total cash needed
- —
Loan-product check · same deal, 3 products live
Conventional
25% down · 7.5% · 30yr
- Down + closing
- —
- Monthly P&I
- —
- Monthly cashflow
- —
- DSCR
- —
- Eligible?
- —
Personal DTI + credit; lowest rate.
DSCR
20% down · 8.5% · 30yr
- Down + closing
- —
- Monthly P&I
- —
- Monthly cashflow
- —
- DSCR
- —
- Eligible?
- —
No personal income docs; deal must DSCR.
Hard money
10% down · 12.0% · 12mo
- Down + closing
- —
- Monthly P&I
- —
- Monthly cashflow
- —
- DSCR
- —
- Eligible?
- —
Short-term bridge; refi at stabilization.
Listing history 17 events
-
2026-06-18days on market $79,900 Active 66 DOM
-
2026-06-17days on market $79,900 Active 65 DOM
-
2026-06-16days on market $79,900 Active 64 DOM
-
2026-06-15days on market $79,900 Active 63 DOM
-
2026-06-13days on market $79,900 Active 61 DOM
-
2026-06-12days on market $79,900 Active 60 DOM
-
2026-06-09days on market $79,900 Active 57 DOM
-
2026-06-08days on market $79,900 Active 56 DOM
-
2026-06-07days on market $79,900 Active 55 DOM
-
2026-06-05days on market $79,900 Active 53 DOM
-
2026-06-04days on market $79,900 Active 51 DOM
-
2026-06-02days on market $79,900 Active 50 DOM
-
2026-06-01days on market $79,900 Active 49 DOM
-
2026-05-31days on market $79,900 Active 48 DOM
-
2026-05-06price $84,900
-
2026-04-13$99,900 Active
-
2000-11-17soldstatus $39,500
ⓘ Source: listings_history table (triggers on properties + properties_extension) + one-shot
backfill from property_details.listing_events for pre-trigger history.
Tax reassessment forecast NY · Partial reset (capped growth)
- Current annual tax
- $2,630 · $219/mo
- Projected year-2 tax
- $2,630 · $219/mo
- Expected delta
- $0/yr ($0/mo · 0.0%)
ⓘ Screening estimate from a state-policy table — verify with the county assessor before closing.
Climate risk First Street
- Flood 1/10 Low FEMA zone X (unshaded) · 0% chance over 30 yrs
- Wildfire 1/10 Low
- Heat 2/10 Low 8 d/yr ≥90°F today · 18 d/yr by 30 yrs out
- Wind 2/10 Low 100% chance of damaging wind over 30 yrs
- Air quality 2/10 Low 0 unhealthy d/yr today · 1 by 30 yrs out
Nearby sold comps map
Loading sold comps map…
Walkable amenities ~0.75 mi
Loading nearby amenities…
Taxation est. · year 1
- Rental income
- $14,960
- − Mortgage interest
- −$4,476
- − Property taxes
- −$2,630
- − Insurance
- −$400
- − Repairs & maintenance
- −$1,197
- − Management
- −$1,197
- − Depreciation
- −$2,324
- Taxable income
- $2,737
- Est. tax owed @ 24.0%
- −$657
- After-tax cash flow
- $3,104/yr
For passive investors: Depreciation is non-cash, so a rental often shows a tax loss while cash-flowing — sheltering income. Rental losses are passive: they offset passive income freely, and up to $25,000/yr can offset ordinary (W-2) income if you actively participate and your MAGI is under $100k (phasing out to $0 by $150k); unused losses carry forward. On sale, claimed depreciation is recaptured at up to 25%, and gains may owe capital-gains tax (a 1031 exchange can defer both). Figures are a year-1 estimate at your 24.0% rate — not tax advice; consult a CPA.
Schools (NCES district)
- District
- Georgetown-South Otselic Central School District
- NCES district ID
- 3622100
- Math proficiency
- 40% ▲ 5.00%
- Reading proficiency
- 30% ▲ 5.00%
- Median HH income
- $47,779
- Composite
- 32.79/100
- National rank
- #10750
- State rank
- #692 of 755 in NY
Livability — DeRuyter
- Score
- 61/100
- State rank
- #900
- US rank
- #17540
Category grades
Schools grade is shown separately in the Schools card above.
Census & demographics
- Population (ZIP)
- 654
Population outlook (Chenango County) Hauer SSP2
- Today (2025)
- 45,669 people
- By 2030
- 43,484 · -4.8%
- By 2040
- 38,774 · -15.1%
- By 2050
- 34,000 · -25.6%
- By 2075
- 24,637 · -46.1%
- By 2100
- 16,452 · -64.0%
Race, ethnicity, and origin ACS 2023
- Neighborhood character
- Predominantly White (96%)
- Race & ethnicity
- White 96% Two or more races 4% Hispanic / Latino 1%
- Common ancestry
- Romanian 3% Italian 2% Iranian 2%
- Languages at home
- 99% English-only · Spanish 1%
Political lean MEDSL · Chenango
- 2024 margin
- Strong R (+27.2) · D 36.4% · R 63.6%
- 2008→2024 swing
- -26.1pp toward R · 2008: -1.1pp · 2024: -27.2pp
- All cycles
- 2024: R+27.2 2020: R+23.3 2016: R+28.1 2012: R+3.4 2008: R+1.1
Not yet ingested
- Civics
- —
Market trends
- HPI YoY
- ▲ 20.31%
- Current HPI
- 262.9164
- Rent YoY
- —
- Metro
- —
- State GDP YoY
- ▲ 2.60%
- F500 in state
- 92
Industry mix (Fortune 500 HQ in NY)
| Industry | F500 HQs | Revenue |
|---|---|---|
| Financial Services | 10 | $950B |
|
||
| Consumer Goods | 9 | $162B |
|
||
| Insurance | 4 | $225B |
|
||
| Telecommunications | 2 | $144B |
|
||
| Pharmaceuticals | 2 | $112B |
|
||
| Media / Entertainment | 2 | $69B |
|
||
Price history
+114.9% since first listed3 events — show timeline
- 2026-05-06 Price Changed $84,900 CNYIS
- 2026-04-13 Listed $99,900 CNYIS
- 2000-11-17 Sold (Public Records) $39,500 Public Records
Property tax history
+3.9%/yrLatest (2025): $2,630 · +12.3% YoY. Source: county tax records.
Cash-flow waterfall
monthlySold comps — $/sqft
last 12 mo · ≤1 miLoading sold comps…