 Triplex
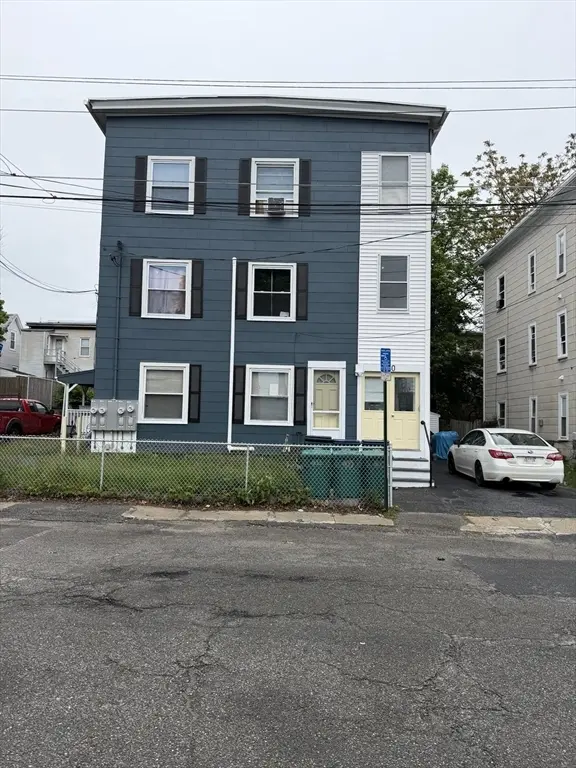
40 Edwards St · Fitchburg, MA
Flood risk 1/10 · Minimal
- FEMA flood zone
- —
- Chance of flooding over 30 yrs
- 0.0%
- Est. flood insurance / yr
- —
Fire risk 3/10 · Minor
- Est. fire insurance / yr
- $915 – $1,699
Heat risk 4/10 · Minor
- Hot days now (above 94°F)
- 8 days/yr
- Hot days in 30 yrs
- 18 days/yr
Wind risk 6/10 · Moderate
- Chance of severe wind over 30 yrs
- 27.0%
Air-quality risk 2/10 · Minimal
- Unhealthy air days now
- 1 days/yr
- Unhealthy air days in 30 yrs
- 1 days/yr
Risk factors via First Street. Map © Google.
Why this score? — see what drove the F grade
The composite is a weighted blend of 9 inputs, each scored 0–100. Each bar is that input's sub-score; the figure is the points it added to the 100-point composite (weight × sub-score).
- Cash flow +13.3/30.0
- DSCR +4.0/10.0
- Livability +3.5/5.0
- Rent growth +3.3/5.0
- 1% rule +2.8/10.0
- Condition / age +2.5/5.0
- Schools +2.0/10.0
- ARV discount +1.6/15.0
- Appreciation +0.0/10.0
$670,000
🖨 Deal sheet 📄 Offer letter ✓ Due diligence
Multi-family units
County records classify this as Multi-Family (2-4 Unit). Listing-text estimate: 3 units. confirmed
Listing remarks MLS
Here is your opportunity to take this solid 3 family to the next level. Spacious eat in kitchens with seprate pantry/ laundry. Room for 3 bedrooms with nice closet space. Enclosed porches and off street parking, Public record shows it as 2 bedroom units but seller has plans and permits in hand to update to 3 bedroom units. Unit 1 and 2 are currently vacant.
Key facts
- Renovated units
- Granite countertops
- Sub-metered panels
Tags
Property features AI
Finance
- Other: Building total area listed as 2,508 sq ft; Lot size approximately 0.12 acre; Green energy/efficiency features vary per unit
- HOA & community: Community features include nearby park
Exterior
- Parking: Six total parking spaces; Open parking available; Paved drive; Off-street parking; Assigned parking
- Utilities: Public water; Public sewer; 110 volt and 220 volt electric; Gas range and electric range provisions vary per unit; Washer hookup (varies per unit); Electric dryer provision
- Home design: 3-family building (3 units, up/down); Three stories; Approximate year built (public records)
- Construction: Post & beam construction; Cement board exterior; Stone/granite foundation; Rubber roof
- Exterior features: Covered patio/porch; Balcony/deck; Cleared lot; Shed(s); Public road frontage
Interior
- Kitchen: Range; Refrigerator
- Bedrooms: Total of 15 rooms across units (bedroom counts by unit not specified)
- Flooring: Tile; Vinyl; Stone/ceramic tile
- Bathrooms: Three full bathrooms
- Heating & cooling: Forced air heating; Heat pump heating; Electric heating; Three heating units; Heat pump cooling; Wall unit(s) cooling; Six cooling units
- Interior features: Remodeled with upgraded cabinets; Stone, granite or solid counters; Smart thermostat; Walk-in closet(s); Bathroom(s) with tub and shower; Living room and kitchen included; Laundry room
- Laundry & utility: Washer hookup; Electric dryer hookup
Neighborhood map
What this means for you Summary
Snapshot
- This is a 3 × 2-bed/1.0-bath units multifamily listed at $670k.
Deal economics
- At list price, monthly cash flow is $0 ($5/yr) — positive. Per door: $0/mo.
- The deal already cash-flows at list — no discount required.
- To meet the 1% rule (rent ≥ 1% of price), the offer needs to be $526k (21.6% below list).
- Recommended offer: $526k (21.6% below list) — sets the bar for 1% rule.
- Cap rate 6.3% vs local median 4.0% in Fitchburg — top-decile yield for the area; either an underpriced asset or a hidden risk that comps aren't pricing in. Stress-test before assuming the spread holds.
Location & tenants
- Location reads 69/100 on livability (#137 in MA) — a middle-class / working-renter tenant base. Strengths: housing A+, commute A-, health & safety B+; Watch: employment D+, crime D, schools D-.
- Fitchburg (suburban): math 15% / reading 30% proficiency, ranked #282 of 302 in MA (top 93%) — low school quality limits family demand, transient renter base, plan for 1-2y turnover; 64% free/reduced lunch — lower-income household profile, screen leases tightly.
- Market conditions: Rents rising (+3.1%/yr); 79 active listings in the ZIP; 2,293 units permitted in Worcester County in 2024 (1,205 in 5+ unit buildings).
- At $5,255/mo this rent would consume 87% of the median local household income ($73k/yr) (locally 1763% of renters already pay >50% of income on rent) — very limited rent-growth headroom before tenants either downsize or default.
Forward outlook
- Local home prices are declining (-3.0%/yr); year-one equity from $5k of loan paydown is wiped out by about $20k of value loss. Plan a longer hold.
Negotiation context
- It's been on market 16 days — a 2% lower offer ($660k) is reasonable based on typical stale-listing flexibility.
- 2 sale attempts with the ask held roughly flat each time — persistent listings suggest the price (not the market) is what's stuck; bring a comps-based counter.
- Current owner paid $475k; 41% above their basis — modest negotiation headroom, anchor on the comps not their cost.
Risks & watch-outs
- Watch-outs: built in 1905 — expect roof / HVAC / electrical / plumbing capex.
- Climate carrying-cost: major wind risk, 27% chance of damaging wind over 30y — expect insurance premiums to compound above CPI over the hold.
Questions for the listing agent
- Can we see the unit-by-unit rent roll, current vacancy, and any below-market leases? What's the average tenancy length?
- What capital expenditures (roof, boiler, parking lot, exteriors) have been made in the last 5 years, and what's planned in the next 2?
- Built in 1905 — when were the roof, HVAC, electrical panel, plumbing, and water heater last replaced?
- Is there a deadline driving the sale (1031 exchange, divorce, estate, relocation)? That informs how much negotiation room exists.
- Schools are D-rated, which usually means shorter tenancies and higher turnover. Who's the typical renter profile here, and what's been the actual vacancy rate?
- Crime grade is D in this area — have there been break-ins, vandalism, or insurance claims at this property in the last 3 years? What carrier currently insures it and at what premium?
- The area grade is low — what's the realistic commute time and amenity access for the typical tenant pool here? Any planned neighborhood developments (good or bad) we should know about?
- What's the average days-on-market for RENTAL listings here right now (not sales)? A rising rental-DOM trend means longer vacancies and softer asking-rent achievability than the comps imply.
- What's the recent tenant-quality profile in this submarket — average credit score on applications, eviction rate, late-payment / NSF rate, and stable-employment percentage? A property-management company in the area should have these aggregated.
- How much new apartment / multifamily construction is in the pipeline within 1–3 miles? Heavy new supply (>2% of stock underway) typically softens rents 12–24 months out; light construction supports rent growth.
Investment metrics
- 1% rule
- 0.78% ✗
- Cap rate
- 6.29%
- Cash-on-cash
- 0.00%
- DSCR
- 1.00
- GRM
- 10.6
CMA / ARV
- ARV (on-the-fly)
- $591,888
- Comps found
- 12
Show comp detail 12 sales within ~0.75 mi
| Address | Dist | Beds/Ba | Sqft | Sold | Price | $/sf | Match |
|---|---|---|---|---|---|---|---|
| 358-360 Fairmount St | 0.34mi | 5/3.0 (-1) | 2,502 (-0%) | 2mo | $406,000 | $162 | 77 |
| 75 Beech St | 0.51mi | 6/4.0 | 2,400 (-4%) | 2mo | $630,000 | $263 | 63 |
| 110 Madison St | 0.06mi | 5/2.0 (-1) | 2,772 (+10%) | 15mo | $450,000 | $162 | 58 |
| 33 Pratt St | 0.17mi | 6/2.0 | 2,184 (-13%) | 13mo | $515,000 | $236 | 56 |
| 483 Rollstone St | 0.68mi | 6/2.0 | 2,580 (+3%) | 9mo | $515,000 | $200 | 52 |
| 26 Pratt Rd | 0.66mi | 6/3.0 | 2,256 (-10%) | 1mo | $665,000 | $295 | 52 |
| 318 Charles St | 0.72mi | 5/3.0 (-1) | 2,348 (-6%) | 2mo | $594,000 | $253 | 49 |
| 48 Silver St | 0.48mi | 5/2.5 (-1) | 2,775 (+11%) | 6mo | $580,000 | $209 | 48 |
| 39 Allen Pl | 0.39mi | 6/3.0 | 2,223 (-11%) | 18mo | $530,000 | $238 | 48 |
| 211 Plymouth St | 0.27mi | 5/2.0 (-1) | 2,178 (-13%) | 13mo | $361,900 | $166 | 45 |
| 426 Kimball St | 0.67mi | 6/3.0 | 2,736 (+9%) | 18mo | $515,000 | $188 | 38 |
| 459 Oak Hill Rd | 0.46mi | 5/2.0 (-1) | 2,300 (-8%) | 23mo | $600,000 | $261 | 36 |
Match score weights: distance 35% · size 25% · config 20% · recency 20%. Top-matched comps best support the ARV.
Projected returns pro-forma
-3.0% appreciation · 3.06% rent growth · sell at horizon
- IRR
- -16.3%
- Equity multiple
- 0.42×
- Total profit
- $-108,441
- Equity at exit
- $99,899
- IRR
- -8.0%
- Equity multiple
- 0.50×
- Total profit
- $-93,966
- Equity at exit
- $57,929
Cash invested: $187,600 (down + closing). Projections, not guarantees.
Landlord ↔ Tenant lean methodology
- Overall (STATE)
- 20 Strongly Tenant-Friendly
- State Massachusetts
- 20 Strongly Tenant-Friendly · D+15
- County
- — inherits STATE
- City
- — inherits STATE
ZIP-level market 01420
- Home prices YoY
- -25.2%
- Rents YoY
- 3.1%
- Active inventory
- 79
- Price-to-rent
- 31.9×
Monthly cashflow live
- Estimated rent
- $5,255 high interval (Pro) →
- Mortgage (P&I)
- −$3,514
- Tax from tax record
- −$358 /mo · $4,300/yr
- Insurance
- −$279
- HOA
- −$0
- Vacancy / Maint / Mgmt
- −$1,104
- Net cashflow
- $0
Break-even live
3-unit breakdown (identical units grouped — click to expand)
| Units | Beds | Baths | Est. rent |
|---|---|---|---|
| 3× units | 2 | 1 | $5,256 |
| #1 | 2 | 1 | $1,752 |
| #2 | 2 | 1 | $1,752 |
| #3 | 2 | 1 | $1,752 |
| Total (3 units) | $5,255 | ||
UW: 25.0% down · 7.5% · 30yr · 1.5% tax · 5.0% vac · 8.0% maint · 8.0% mgmt
Financing live
Cash to close
- Down payment
- $167,500
- Closing costs
- $20,100
- Reserves months
- —
- Total cash needed
- —
Loan-product check · same deal, 3 products live
Conventional
25% down · 7.5% · 30yr
- Down + closing
- —
- Monthly P&I
- —
- Monthly cashflow
- —
- DSCR
- —
- Eligible?
- —
Personal DTI + credit; lowest rate.
DSCR
20% down · 8.5% · 30yr
- Down + closing
- —
- Monthly P&I
- —
- Monthly cashflow
- —
- DSCR
- —
- Eligible?
- —
No personal income docs; deal must DSCR.
Hard money
10% down · 12.0% · 12mo
- Down + closing
- —
- Monthly P&I
- —
- Monthly cashflow
- —
- DSCR
- —
- Eligible?
- —
Short-term bridge; refi at stabilization.
Listing history 11 events
-
2026-06-18days on market $670,000 Active 16 DOM
-
2026-06-17days on market $670,000 Active 15 DOM
-
2026-06-16days on market $670,000 Active 14 DOM
-
2026-06-15days on market $670,000 Active 13 DOM
-
2026-06-14days on market $670,000 Active 11 DOM
-
2026-06-10days on market $670,000 Active 8 DOM
-
2026-06-09statusdays on market $670,000 Active 7 DOM
-
2026-06-08days on market $670,000 Price Changed 6 DOM
-
2026-06-07pricestatusdays on market $670,000 Price Changed 5 DOM
-
2026-06-03remarks 687-char remark
-
2026-06-03$679,000 New 1 DOM
ⓘ Source: listings_history table (triggers on properties + properties_extension) + one-shot
backfill from property_details.listing_events for pre-trigger history.
Tax reassessment forecast MA · Partial reset (capped growth)
- Current annual tax
- $4,300 · $358/mo
- Projected year-2 tax
- $6,270 · $523/mo
- Expected delta
- +$1,970/yr (+$164/mo · 45.8%)
ⓘ Screening estimate from a state-policy table — verify with the county assessor before closing.
Climate risk First Street
- Flood 1/10 Low 0% chance over 30 yrs
- Wildfire 3/10 Moderate
- Heat 4/10 Moderate 8 d/yr ≥94°F today · 18 d/yr by 30 yrs out
- Wind 6/10 Major 27% chance of damaging wind over 30 yrs
- Air quality 2/10 Low 1 unhealthy d/yr today · 1 by 30 yrs out
Nearby sold comps map
Loading sold comps map…
Walkable amenities ~0.75 mi
Loading nearby amenities…
Taxation est. · year 1
- Rental income
- $63,060
- − Mortgage interest
- −$37,530
- − Property taxes
- −$4,300
- − Insurance
- −$3,350
- − Repairs & maintenance
- −$5,045
- − Management
- −$5,045
- − Depreciation
- −$19,491
- Taxable loss
- −$11,701
- Est. tax savings @ 24.0%
- +$2,808
- After-tax cash flow
- $2,813/yr
For passive investors: Depreciation is non-cash, so a rental often shows a tax loss while cash-flowing — sheltering income. Rental losses are passive: they offset passive income freely, and up to $25,000/yr can offset ordinary (W-2) income if you actively participate and your MAGI is under $100k (phasing out to $0 by $150k); unused losses carry forward. On sale, claimed depreciation is recaptured at up to 25%, and gains may owe capital-gains tax (a 1031 exchange can defer both). Figures are a year-1 estimate at your 24.0% rate — not tax advice; consult a CPA.
Schools (NCES district)
- District
- Fitchburg
- NCES district ID
- 2504890
- Math proficiency
- 15% ▼ -14.00%
- Reading proficiency
- 30% ▼ -7.00%
- Median HH income
- $48,430
- Composite
- 19.78/100
- National rank
- #8705
- State rank
- #282 of 302 in MA
Livability — Fitchburg
- Score
- 69/100
- State rank
- #137
- US rank
- #8435
Category grades
Schools grade is shown separately in the Schools card above.
Census & demographics
- Census place
- Fitchburg, MA
- County
- Worcester County · 487,911 people
- City population
- 41,839
- Metro
- Worcester, MA-CT
- Population (ZIP)
- 41,839
- Household income
- $72,780
- Rent vs Own
- Severe rent burden
- 1763.0
Population outlook (Worcester County) Hauer SSP2
- Today (2025)
- 850,858 people
- By 2030
- 860,403 · +1.1%
- By 2040
- 869,902 · +2.2%
- By 2050
- 869,110 · +2.1%
- By 2075
- 870,120 · +2.3%
- By 2100
- 829,703 · -2.5%
Race, ethnicity, and origin ACS 2023
- Neighborhood character
- Diverse neighborhood (Simpson 0.58)
- Race & ethnicity
- White 57% Hispanic / Latino 30% Two or more races 19% Black 6% Asian 2%
- Hispanic origin (detail)
- Mexican 2% Puerto Rican 20% Dominican 2%
- Common ancestry
- Lithuanian 8% Romanian 3% Slovak 1%
- Foreign-born
- 10% · Canada, Jamaica
- Languages at home
- 71% English-only · Spanish 22% French/Haitian/Cajun 3% Other Indo-European 2%
Political lean MEDSL · Worcester
- 2024 margin
- D (+10.0) · D 53.9% · R 43.9% · Other 2.2%
- 2008→2024 swing
- -3.8pp toward R · 2008: 13.8pp · 2024: 10.0pp
- All cycles
- 2024: D+10.0 2020: D+17.8 2016: D+10.5 2012: D+9.2 2008: D+13.8
Not yet ingested
- Civics
- —
Market trends
- HPI YoY
- ▼ -102.11%
- Current HPI
- 303.1067
- Rent YoY
- ▲ 3.06%
- Metro
- Worcester, MA-CT
- State GDP YoY
- ▲ 2.28%
- F500 in state
- 38
Industry mix (Fortune 500 HQ in MA)
| Industry | F500 HQs | Revenue |
|---|---|---|
| Technology | 3 | $17B |
|
||
| Insurance | 2 | $84B |
|
||
| Retail | 2 | $76B |
|
||
| Life Sciences | 1 | $43B |
|
||
| Energy Technology | 1 | $31B |
|
||
| Aerospace / Defense | 1 | $18B |
|
||
Price history
+1479.1% since first listed6 events — show timeline
- 2026-06-02 Listed $679,000 MLS PIN
- 2025-05-08 Sold (MLS) $475,000 MLS PIN
- 2025-04-19 Pending — MLS PIN
- 2025-04-05 Contingent — MLS PIN
- 2025-04-03 Listed $475,000 MLS PIN
- 1991-01-10 Sold (Public Records) $43,000 Public Records
Property tax history
+4.5%/yrLatest (2022): $4,300 · +11.0% YoY. Source: county tax records.
Cash-flow waterfall
monthlySold comps — $/sqft
last 12 mo · ≤1 miLoading sold comps…