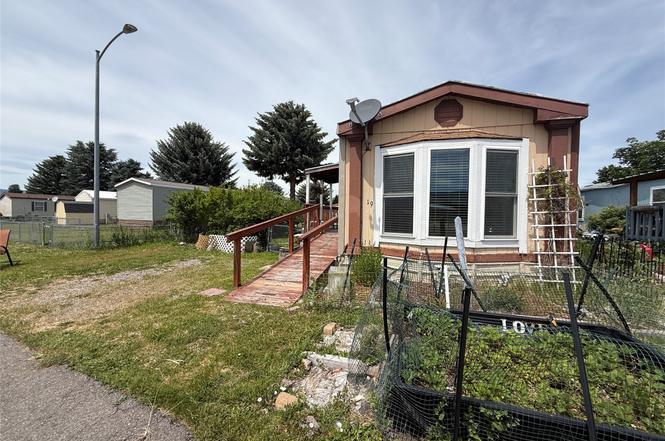
1813 S Reserve St #19 · Missoula, MT
Flood risk 1/10 · Minimal
- FEMA flood zone
- X (unshaded)
- Chance of flooding over 30 yrs
- 0.0%
- Est. flood insurance / yr
- $507 – $1,088
Fire risk 7/10 · Major
- Est. fire insurance / yr
- $918 – $1,706
Heat risk 3/10 · Minor
- Hot days now (above 90°F)
- 7 days/yr
- Hot days in 30 yrs
- 16 days/yr
Wind risk 1/10 · Minimal
- Chance of severe wind over 30 yrs
- —
Air-quality risk 10/10 · Severe
- Unhealthy air days now
- 26 days/yr
- Unhealthy air days in 30 yrs
- 32 days/yr
Risk factors via First Street. Map © Google.
Why this score? — see what drove the B+ grade
The composite is a weighted blend of 9 inputs, each scored 0–100. Each bar is that input's sub-score; the figure is the points it added to the 100-point composite (weight × sub-score).
- Cash flow +30.0/30.0
- ARV discount +13.5/15.0
- 1% rule +10.0/10.0
- DSCR +10.0/10.0
- Livability +4.0/5.0
- Schools +3.5/10.0
- Rent growth +2.9/5.0
- Condition / age +2.2/5.0
- Appreciation +0.0/10.0
$86,000
🖨 Deal sheet (PDF) 📄 Offer letter ✓ Due diligence
Key facts
- Great kitchen
- Covered deck
- Hot tub
Tags
Property features AI
Finance
- Other: Tax information available
- Financial info: Land is leased
Exterior
- Parking: Assigned parking
- Utilities: Natural gas available and connected; Electricity connected; Phone available; Public sewer
- Home design: Manufactured home (single wide); Residential property; Level lot
- Construction: Wood siding and vinyl siding; See remarks for foundation details
- Exterior features: Covered patio/deck; Deck; Storage shed(s); Partial chain link fencing; Accessible entrance with ramp
Interior
- Kitchen: Range; Refrigerator; Washer and dryer listed under appliances
- Bathrooms: 1 full bathroom
- Heating & cooling: Natural gas heating with forced air; Window cooling units
- Interior features: Washer and dryer included; Range; Refrigerator
- Laundry & utility: Washer hookup; Washer and dryer included
Neighborhood map
What this means for you Summary
Snapshot
- This is a 2-bed/1.0-bath manufactured listed at $86k. Condition is rated fair.
Deal economics
- At list price, monthly cash flow is $543 ($7k/yr) — positive.
- The deal already cash-flows at list — no discount required.
- Meets the 1% rule at list price ($1k rent vs $86k).
- Cap rate 13.9% vs local median 1.7% in Missoula — top-decile yield for the area; either an underpriced asset or a hidden risk that comps aren't pricing in. Stress-test before assuming the spread holds.
Location & tenants
- Location reads 79/100 on livability (#17 in MT, #2,351 nationally) — a middle-class / working-renter tenant base. Strengths: amenities A+, commute A+, health & safety A+; Watch: employment C-, crime F.
- Missoula H S (urban): math 31% / reading 52% proficiency, ranked #53 of 116 in MT (top 46%) — families likely to look elsewhere, expect single-tenant / working-renter base with shorter leases.
- Zoned schools: Hawthorne School (math 52% / reading 62%, grade C+, #52 of 293 statewide, top 18%, 387 students, 0% FRL); Porter Middle School (math 28% / reading 48%, grade F, #75 of 146 statewide, top 51%, 579 students, 0% FRL); Big Sky High School (math 21% / reading 37%, grade F, #74 of 132 statewide, top 56%, 1,186 students, 0% FRL).
- Market conditions: Rents rising (+1.5%/yr); 106 active listings in the ZIP; 773 units permitted in Missoula County in 2024 (354 in 5+ unit buildings).
Forward outlook
- Local home prices are declining (-3.0%/yr); year-one equity from $595 of loan paydown is wiped out by about $3k of value loss. Plan a longer hold.
- Missoula County population projected at +23% by 2050 — long-run rental-demand tailwind backs the buy-and-hold thesis.
- At projected returns (-3.0% appreciation + 1.5% rent growth), your $24k cash investment doubles in ~5 years — after that, you're playing with house money.
Negotiation context
- Only 4 days on market — expect competitive offers; lowballing is unlikely to land.
Risks & watch-outs
- Climate carrying-cost: major wildfire risk — expect insurance premiums to compound above CPI over the hold.
Questions for the listing agent
- Have any recent inspections been done? Can we get a copy of the seller's disclosures and any deferred-maintenance estimates?
- Is there a deadline driving the sale (1031 exchange, divorce, estate, relocation)? That informs how much negotiation room exists.
- Schools are B-rated — typically a magnet for longer-tenancy family renters. What's the average tenant stay here, and is there a school-zone premium baked into asking?
- Crime grade is F in this area — have there been break-ins, vandalism, or insurance claims at this property in the last 3 years? What carrier currently insures it and at what premium?
- What's the average days-on-market for RENTAL listings here right now (not sales)? A rising rental-DOM trend means longer vacancies and softer asking-rent achievability than the comps imply.
- What's the recent tenant-quality profile in this submarket — average credit score on applications, eviction rate, late-payment / NSF rate, and stable-employment percentage? A property-management company in the area should have these aggregated.
- How much new for-sale + rental construction is in the pipeline within 1–3 miles? Heavy new supply typically softens prices + rents 12–24 months out; constrained supply supports both.
Investment metrics
- 1% rule
- 1.67% ✓
- Cap rate
- 13.87%
- Cash-on-cash
- 27.07%
- DSCR
- 2.20
- GRM
- 5.0
CMA / ARV
- ARV (on-the-fly)
- $99,120
- Comps found
- 5
Show comp detail 5 sales within ~0.75 mi
| Address | Dist | Beds/Ba | Sqft | Sold | Price | $/sf | Match |
|---|---|---|---|---|---|---|---|
| 1813 S Reserve St W #20 | 0.00mi | 2/1.0 | 728 (-13%) | 14mo | $59,900 | $82 | 66 |
| 1803 Eaton St | 0.33mi | 3/1.5 (+1) | 924 (+10%) | 3mo | $50,000 | $54 | 58 |
| 2511 Mount Ave Trlr 3 | 0.21mi | 3/2.0 (+1) | 952 (+13%) | 2mo | $112,000 | $118 | 58 |
| 2301 Fairview Ave | 0.59mi | 2/1.0 | 840 (0%) | 24mo | $184,000 | $219 | 53 |
| 2222 Burlington Ave | 0.44mi | 3/2.0 (+1) | 924 (+10%) | 12mo | $210,000 | $227 | 44 |
Match score weights: distance 35% · size 25% · config 20% · recency 20%. Top-matched comps best support the ARV.
Projected returns pro-forma
-3.0% appreciation · 1.52% rent growth · sell at horizon
- IRR
- 19.3%
- Equity multiple
- 1.77×
- Total profit
- $18,573
- Equity at exit
- $12,823
- IRR
- 26.6%
- Equity multiple
- 3.18×
- Total profit
- $52,397
- Equity at exit
- $7,436
Cash invested: $24,080 (down + closing). Projections, not guarantees.
Landlord ↔ Tenant lean methodology
- Overall (STATE)
- 82 Strongly Landlord-Friendly
- State Montana
- 82 Strongly Landlord-Friendly · R+11
- County
- — inherits STATE
- City
- — inherits STATE
ZIP-level market 59801
- Rents YoY
- 1.5%
- Active inventory
- 106
- Price-to-rent
- 5.0×
Monthly cashflow live
- Estimated rent
- $1,440 medium interval (Pro) →
- Mortgage (P&I)
- −$451
- Tax est. 1.5%
- −$108 /mo · $1,290/yr
- Insurance
- −$36
- HOA
- −$0
- Vacancy / Maint / Mgmt
- −$302
- Net cashflow
- $543
Break-even live
Sensitivity live
| Price | -10% $603 | -5% $573 | +0% $543 | +5% $514 | +10% $484 |
|---|---|---|---|---|---|
| Rent | -10% $429 | -5% $486 | +0% $543 | +5% $600 | +10% $657 |
| Rate | -1.0pp $587 | -0.5pp $565 | base $543 | +0.5pp $521 | +1.0pp $498 |
UW: 25.0% down · 7.5% · 30yr · 1.5% tax · 5.0% vac · 8.0% maint · 8.0% mgmt
Financing live
Cash to close
- Down payment
- $21,500
- Closing costs
- $2,580
- Reserves months
- —
- Total cash needed
- —
Loan-product check · same deal, 3 products live
Conventional
25% down · 7.5% · 30yr
- Down + closing
- —
- Monthly P&I
- —
- Monthly cashflow
- —
- DSCR
- —
- Eligible?
- —
Personal DTI + credit; lowest rate.
DSCR
20% down · 8.5% · 30yr
- Down + closing
- —
- Monthly P&I
- —
- Monthly cashflow
- —
- DSCR
- —
- Eligible?
- —
No personal income docs; deal must DSCR.
Hard money
10% down · 12.0% · 12mo
- Down + closing
- —
- Monthly P&I
- —
- Monthly cashflow
- —
- DSCR
- —
- Eligible?
- —
Short-term bridge; refi at stabilization.
Listing history 3 events
-
2026-06-21days on market $86,000 Active 4 DOM
-
2026-06-19days on market $86,000 Active 2 DOM
-
2026-06-17$86,000 Active 1 DOM
ⓘ Source: listings_history table (triggers on properties + properties_extension) + one-shot
backfill from property_details.listing_events for pre-trigger history.
Climate risk First Street
- Flood 1/10 Low FEMA zone X (unshaded) · 0% chance over 30 yrs
- Wildfire 7/10 Severe
- Heat 3/10 Moderate 7 d/yr ≥90°F today · 16 d/yr by 30 yrs out
- Wind 1/10 Low
- Air quality 10/10 Extreme 26 unhealthy d/yr today · 32 by 30 yrs out
Nearby sold comps map
Loading sold comps map…
Walkable amenities ~0.75 mi
Loading nearby amenities…
Taxation est. · year 1
- Rental income
- $17,280
- − Mortgage interest
- −$4,817
- − Property taxes
- −$1,290
- − Insurance
- −$430
- − Repairs & maintenance
- −$1,382
- − Management
- −$1,382
- − Depreciation
- −$2,502
- Taxable income
- $5,476
- Est. tax owed @ 24.0%
- −$1,314
- After-tax cash flow
- $5,205/yr
For passive investors: Depreciation is non-cash, so a rental often shows a tax loss while cash-flowing — sheltering income. Rental losses are passive: they offset passive income freely, and up to $25,000/yr can offset ordinary (W-2) income if you actively participate and your MAGI is under $100k (phasing out to $0 by $150k); unused losses carry forward. On sale, claimed depreciation is recaptured at up to 25%, and gains may owe capital-gains tax (a 1031 exchange can defer both). Figures are a year-1 estimate at your 24.0% rate — not tax advice; consult a CPA.
Condition & rehab AI · 12 photos
This manufactured home requires moderate renovations to its kitchen and bathroom, along with exterior updates, to significantly increase its value for resale or rental.
Repairs flagged
- Moderate kitchen cabinets — dated and in need of replacement
- Major bathroom fixtures — old and in poor condition
- Minor exterior siding — slight wear
Value-add opportunities
- Both kitchen renovation — modernizing the kitchen can increase both resale and rental value
- Both bathroom renovation — updating the bathroom can significantly boost both resale and rental value
- Both exterior paint and landscaping — improving curb appeal can enhance both resale and rental value
Renovation cost estimate screening
| Repair item | Severity | Est. cost |
|---|---|---|
| kitchen cabinets · dated and in need of replacement | Moderate | $3,000–15,000 |
| bathroom fixtures · old and in poor condition | Major | $15,000–50,000 |
| exterior siding · slight wear | Minor | $500–3,000 |
| Total estimated repair cost · 3 items | $18,500–68,000 |
Value-add ROI direction
- Both kitchen renovation — modernizing the kitchen can increase both resale and rental value ↑
- Both bathroom renovation — updating the bathroom can significantly boost both resale and rental value ↑
- Both exterior paint and landscaping — improving curb appeal can enhance both resale and rental value ↑
ⓘ Cost ranges are severity-bucket heuristics (US national rule-of-thumb). Get contractor quotes + a written scope before underwriting a rehab budget.
Schools (NCES district)
- District
- Missoula H S
- NCES district ID
- 3018540
- Math proficiency
- 31% ▼ -8.00%
- Reading proficiency
- 52% ▼ -1.00%
- Median HH income
- $41,814
- Composite
- 34.87/100
- National rank
- #5087
- State rank
- #53 of 116 in MT
Livability — Missoula
- Score
- 79/100
- State rank
- #17
- US rank
- #2351
Category grades
Schools grade is shown separately in the Schools card above.
Census & demographics
- Census place
- Missoula, MT
- County
- Missoula County · 100,878 people
- City population
- 100,878
- Metro
- Missoula, MT
- Population (ZIP)
- 30,916
- Household income
- $58,347
- Rent vs Own
- Severe rent burden
- 2286.0
Population outlook (Missoula County) Hauer SSP2
- Today (2025)
- 127,248 people
- By 2030
- 133,571 · +5.0%
- By 2040
- 144,833 · +13.8%
- By 2050
- 156,753 · +23.2%
- By 2075
- 189,373 · +48.8%
- By 2100
- 217,637 · +71.0%
Race, ethnicity, and origin ACS 2023
- Neighborhood character
- Predominantly White (85%)
- Race & ethnicity
- White 85% Two or more races 7% Hispanic / Latino 5% Native American 3% Black 2%
- Hispanic origin (detail)
- Mexican 4%
- Common ancestry
- Portuguese 7% Italian 4% Lithuanian 3%
- Foreign-born
- 4% · Canada, China
- Languages at home
- 95% English-only · Spanish 2% German/W. Germanic 2%
Political lean MEDSL · Missoula
- 2024 margin
- Strong D (+21.4) · D 59.0% · R 37.5% · Other 3.5%
- 2008→2024 swing
- -5.3pp toward R · 2008: 26.7pp · 2024: 21.4pp
- All cycles
- 2024: D+21.4 2020: D+23.6 2016: D+15.8 2012: D+18.7 2008: D+26.7
Not yet ingested
- Civics
- —
Market trends
- HPI YoY
- ▼ -809.50%
- Current HPI
- 268.1207
- Rent YoY
- ▲ 1.52%
- Metro
- Missoula, MT
- State GDP YoY
- ▲ 3.41%
- F500 in state
- 2
Industry mix (Fortune 500 HQ in MT)
| Industry | F500 HQs | Revenue |
|---|---|---|
| Technology / Analytics | 1 | $2B |
|
||
Price history
1 event — show timeline
- 2026-06-17 Listed $86,000 MRMLS
Cash-flow waterfall
monthlySold comps — $/sqft
last 12 mo · ≤1 miLoading sold comps…