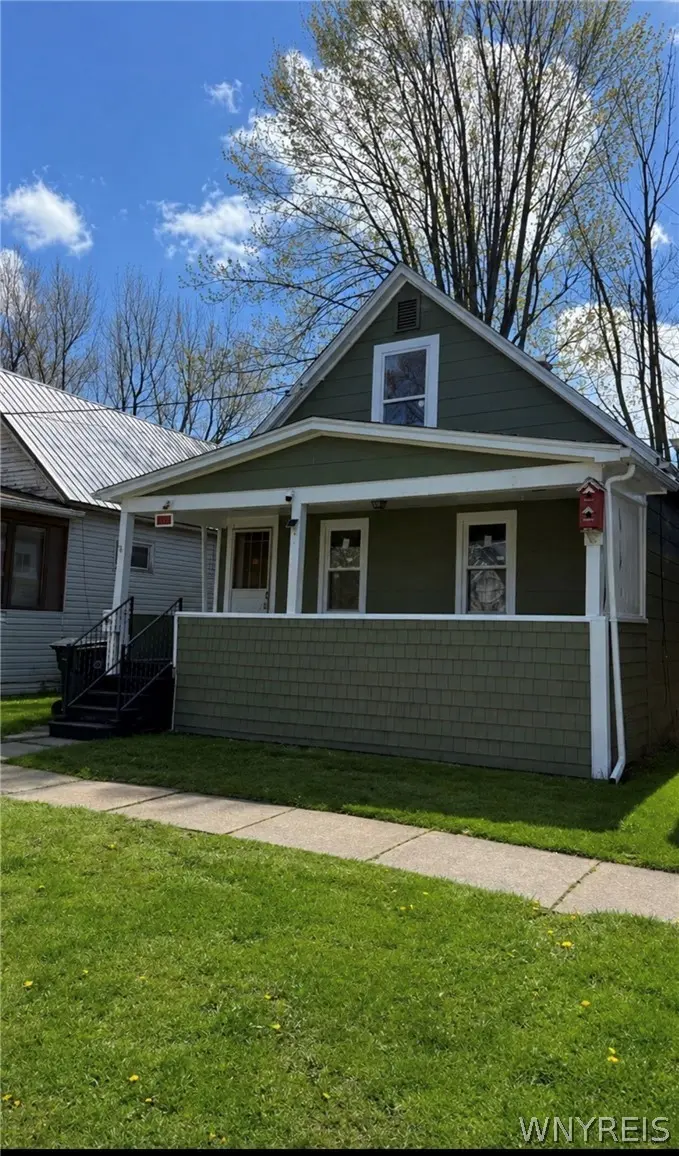
125 7th Ave · North Tonawanda, NY
Flood risk 1/10 · Minimal
- FEMA flood zone
- X (unshaded)
- Chance of flooding over 30 yrs
- 0.0%
- Est. flood insurance / yr
- $507 – $1,088
Fire risk 3/10 · Minor
- Est. fire insurance / yr
- $691 – $1,283
Heat risk 2/10 · Minimal
- Hot days now (above 94°F)
- 7 days/yr
- Hot days in 30 yrs
- 15 days/yr
Wind risk 1/10 · Minimal
- Chance of severe wind over 30 yrs
- —
Air-quality risk 3/10 · Minor
- Unhealthy air days now
- 3 days/yr
- Unhealthy air days in 30 yrs
- 4 days/yr
Risk factors via First Street. Map © Google.
Why this score? — see what drove the C- grade
The composite is a weighted blend of 9 inputs, each scored 0–100. Each bar is that input's sub-score; the figure is the points it added to the 100-point composite (weight × sub-score).
- Cash flow +15.6/30.0
- ARV discount +15.0/15.0
- DSCR +4.8/10.0
- Schools +4.2/10.0
- Livability +4.2/5.0
- Rent growth +4.0/5.0
- 1% rule +3.8/10.0
- Condition / age +2.5/5.0
- Appreciation +0.0/10.0
$162,800
🖨 Deal sheet 📄 Offer letter ✓ Due diligence
Listing remarks
125 7th Ave is back on the market with many new updates. The owner has installed a complete set of vinyl windows, freshly painted the exterior, and updated the roofing system. The heating system was installed by Reimer Heating & Cooling and includes a transferable warranty through 2031, giving the next owner added peace of mind. Inside, this 4-bedroom, 1-bath home features fresh interior paint, new flooring throughout, and refinished hardwood floors. Many of the major updates have already been completed, helping save the buyer time and money. The entire second floor offers a spacious loft-style bedroom, providing flexibility for a primary suite, home office, or additional living space
Key facts
- Vinyl windows
- Rear parking
- Heating system
Tags
Property features AI
Exterior
- Parking: No garage
- Utilities: Public water (connected); Sewer connected
- Home design: Single-story house; Existing resale property
- Construction: Composite siding; Asphalt roof
- Exterior features: Gravel driveway; Irregular residential lot, 30 x 100; City street frontage
Interior
- Kitchen: Eat-in kitchen
- Bedrooms: 3 main-level bedrooms
- Flooring: Carpet; Hardwood; Varies
- Bathrooms: 1 full bathroom (main level)
- Heating & cooling: Gas forced-air heating
- Interior features: Eat-in kitchen; Bedroom on main level; Crawl space basement
- Laundry & utility: Gas water heater
Neighborhood map
What this means for you Summary
Snapshot
- This is a 3-bed/1.0-bath single-family listed at $163k.
Deal economics
- At list price, monthly cash flow is $68 ($817/yr) — positive.
- The deal already cash-flows at list — no discount required.
- To meet the 1% rule (rent ≥ 1% of price), the offer needs to be $144k (11.8% below list).
- Recommended offer: $144k (11.8% below list) — sets the bar for 1% rule.
- Cap rate 6.8% vs local median 4.0% in North Tonawanda — top-decile yield for the area; either an underpriced asset or a hidden risk that comps aren't pricing in. Stress-test before assuming the spread holds.
Location & tenants
- Location reads 85/100 on livability (#30 in NY, #518 nationally) — a professional / high-income tenant draw. Strengths: commute A+, housing A+, health & safety A+.
- North Tonawanda City School District (suburban): math 42% / reading 57% proficiency, ranked #398 of 590 in NY (top 68%) — families likely to look elsewhere, expect single-tenant / working-renter base with shorter leases.
- Market conditions: Rents rising fast (+6.0%/yr); 178 active listings in the ZIP; 9 comparable units currently listed for rent nearby; rentals at typical pace (median 15d on market — plan ~3-4 weeks tenant-placement turnaround); 167 units permitted in Niagara County in 2024 (0 in 5+ unit buildings).
Forward outlook
- Local home prices are declining (-3.0%/yr); year-one equity from $1k of loan paydown is wiped out by about $5k of value loss. Plan a longer hold.
- Niagara County population projected at -19% by 2050 — secular population decline; favor cash flow + early exit over multi-decade hold.
Negotiation context
- It's been on market 35 days — a 3% lower offer ($158k) is reasonable based on typical stale-listing flexibility.
- 4 sale attempts with the ask held roughly flat each time — persistent listings suggest the price (not the market) is what's stuck; bring a comps-based counter.
- Current owner paid $88k; list at $163k implies a 84% gain — meaningful room to come down on a strong offer.
Risks & watch-outs
- Watch-outs: built in 1900 — expect roof / HVAC / electrical / plumbing capex.
Questions for the listing agent
- It's been on market 35 days. Have you received any prior offers? Is the seller open to a 12% concession, seller financing, or rate buy-down credit?
- Built in 1900 — when were the roof, HVAC, electrical panel, plumbing, and water heater last replaced?
- Is there a deadline driving the sale (1031 exchange, divorce, estate, relocation)? That informs how much negotiation room exists.
- Schools are B-rated — typically a magnet for longer-tenancy family renters. What's the average tenant stay here, and is there a school-zone premium baked into asking?
- What's the average days-on-market for RENTAL listings here right now (not sales)? A rising rental-DOM trend means longer vacancies and softer asking-rent achievability than the comps imply.
- What's the recent tenant-quality profile in this submarket — average credit score on applications, eviction rate, late-payment / NSF rate, and stable-employment percentage? A property-management company in the area should have these aggregated.
- How much new for-sale + rental construction is in the pipeline within 1–3 miles? Heavy new supply typically softens prices + rents 12–24 months out; constrained supply supports both.
Investment metrics
- 1% rule
- 0.88% ✗
- Cap rate
- 6.79%
- Cash-on-cash
- 1.79%
- DSCR
- 1.08
- GRM
- 9.5
CMA / ARV
- ARV (median comp)
- $213,659
- List price
- $162,800
- Delta
- -23.80%
- Verdict
- UNDERPRICED
- Comps
- 20 within 1.0 mi
Show comp detail 12 sales within ~0.75 mi
| Address | Dist | Beds/Ba | Sqft | Sold | Price | $/sf | Match |
|---|---|---|---|---|---|---|---|
| 254 Spaulding St | 0.25mi | 3/1.5 | 1,137 (-3%) | 1mo | $244,000 | $215 | 80 |
| 203 Edward St | 0.15mi | 4/1.0 (+1) | 1,202 (+2%) | 5mo | $250,000 | $208 | 80 |
| 65 6th Ave | 0.12mi | 3/1.0 | 1,092 (-7%) | 8mo | $141,000 | $129 | 76 |
| 19 5th Ave | 0.22mi | 4/1.0 (+1) | 1,145 (-3%) | 6mo | $197,000 | $172 | 75 |
| 871 Payne Ave | 0.44mi | 3/1.0 | 1,144 (-3%) | 0mo | $260,000 | $227 | 75 |
| 29 1st Ave | 0.37mi | 2/1.0 (-1) | 1,140 (-3%) | 4mo | $76,000 | $67 | 69 |
| 732 Barrally St | 0.32mi | 3/1.0 | 1,302 (+11%) | 2mo | $280,000 | $215 | 65 |
| 49 Maple Ter | 0.45mi | 3/2.0 | 1,132 (-4%) | 7mo | $200,000 | $177 | 63 |
| 427 Walck Rd | 0.56mi | 2/1.0 (-1) | 1,082 (-8%) | 2mo | $255,000 | $236 | 54 |
| 222 Fredericka St | 0.74mi | 2/1.0 (-1) | 1,223 (+4%) | 5mo | $165,000 | $135 | 50 |
| 848 Eggert Dr | 0.65mi | 3/1.5 | 1,077 (-8%) | 7mo | $220,000 | $204 | 48 |
| 33 Jackson Ave | 0.74mi | 3/2.0 | 1,023 (-13%) | 6mo | $230,000 | $225 | 35 |
Match score weights: distance 35% · size 25% · config 20% · recency 20%. Top-matched comps best support the ARV.
Projected returns pro-forma
-3.0% appreciation · 5.96% rent growth · sell at horizon
- IRR
- -10.3%
- Equity multiple
- 0.61×
- Total profit
- $-17,657
- Equity at exit
- $24,274
- IRR
- 2.5%
- Equity multiple
- 1.20×
- Total profit
- $9,342
- Equity at exit
- $14,076
Cash invested: $45,584 (down + closing). Projections, not guarantees.
Landlord ↔ Tenant lean methodology
- Overall (STATE)
- 15 Strongly Tenant-Friendly
- State New York
- 15 Strongly Tenant-Friendly · D+10
- County
- — inherits STATE
- City
- — inherits STATE
ZIP-level market 14120
- Rents YoY
- 6.0%
- Active inventory
- 178
- Price-to-rent
- 9.5×
Monthly cashflow live
- Estimated rent
- $1,435 high interval (Pro) →
- Mortgage (P&I)
- −$854
- Tax from tax record
- −$144 /mo · $1,731/yr
- Insurance
- −$68
- HOA
- −$0
- Vacancy / Maint / Mgmt
- −$301
- Net cashflow
- $68
Break-even live
UW: 25.0% down · 7.5% · 30yr · 1.5% tax · 5.0% vac · 8.0% maint · 8.0% mgmt
Financing live
Cash to close
- Down payment
- $40,700
- Closing costs
- $4,884
- Reserves months
- —
- Total cash needed
- —
Loan-product check · same deal, 3 products live
Conventional
25% down · 7.5% · 30yr
- Down + closing
- —
- Monthly P&I
- —
- Monthly cashflow
- —
- DSCR
- —
- Eligible?
- —
Personal DTI + credit; lowest rate.
DSCR
20% down · 8.5% · 30yr
- Down + closing
- —
- Monthly P&I
- —
- Monthly cashflow
- —
- DSCR
- —
- Eligible?
- —
No personal income docs; deal must DSCR.
Hard money
10% down · 12.0% · 12mo
- Down + closing
- —
- Monthly P&I
- —
- Monthly cashflow
- —
- DSCR
- —
- Eligible?
- —
Short-term bridge; refi at stabilization.
Rent comps 9 comps
| Address | Beds | Baths | Sqft | Rent | $/sqft | DOM | Units | Dist |
|---|---|---|---|---|---|---|---|---|
| 125 3rd Ave North Tonawanda, NY | 2.0 | 1.0 | 900 | $1,100 | $1.22 | 44d | 1 | 0.20mi |
| 175 12th Ave North Tonawanda, NY | 3.0 | 1.0 | 1000 | $1,600 | $1.60 | 44d | 1 | 0.31mi |
| 317 Hedwig Dr Unit N North Tonawanda, NY | 3.0 | 1.0 | 864 | $1,350 | $1.56 | 10d | 1 | 0.41mi |
| 600 River Rd North Tonawanda, NY | 1.0–3.0 | 1.0–2.5 | 1320 | $4,995 | $3.78 | 2d | 12 | 0.43mi |
| 60 Fredericka St North Tonawanda, NY | 2.0 | 1.0 | 1200 | $1,425 | $1.19 | 14d | 1 | 0.63mi |
| 399 Miller St North Tonawanda, NY | 2.0 | 1.0 | 750 | $1,250 | $1.67 | 24d | 1 | 0.65mi |
| 757 Remington Dr Unit 1 North Tonawanda, NY | 3.0 | 1.5 | 1100 | $1,750 | $1.59 | 10d | 1 | 1.18mi |
| 184 Sweeney St North Tonawanda, NY | 2.0 | 2.0 | 1155 | $2,000 | $1.73 | 2d | 1 | 1.27mi |
| 166 Spruce St Unit 5 North Tonawanda, NY | 2.0 | 1.0 | 1000 | $1,300 | $1.30 | 24d | 1 | 1.47mi |
Listing history 20 events
-
2026-06-01statusdays on market $162,800 Pending 35 DOM
-
2026-05-31days on market $162,800 Active 34 DOM
-
2026-05-12price $163,800 956-char remark
-
2026-05-06price $164,800 956-char remark
-
2026-05-05price $167,800 956-char remark
-
2026-04-27$168,800 Active 956-char remark
-
2026-04-02historical
-
2026-03-27price $151,800
-
2026-03-24price $152,800
-
2026-03-17price $153,400
-
2026-03-03$155,400 Active
-
2026-02-26historical
-
2026-02-17price $155,400
-
2026-02-01price $155,900
-
2026-01-11$159,900 Active
-
2025-10-30soldstatus $88,500 Closed
-
2025-07-14status Pending
-
2025-07-02price $99,900
-
2025-06-17price $109,900
-
2025-05-28$124,900 Active
ⓘ Source: listings_history table (triggers on properties + properties_extension) + one-shot
backfill from property_details.listing_events for pre-trigger history.
Tax reassessment forecast NY · Partial reset (capped growth)
- Current annual tax
- $1,731 · $144/mo
- Projected year-2 tax
- $2,241 · $187/mo
- Expected delta
- +$510/yr (+$43/mo · 29.5%)
ⓘ Screening estimate from a state-policy table — verify with the county assessor before closing.
Climate risk First Street
- Flood 1/10 Low FEMA zone X (unshaded) · 0% chance over 30 yrs
- Wildfire 3/10 Moderate
- Heat 2/10 Low 7 d/yr ≥94°F today · 15 d/yr by 30 yrs out
- Wind 1/10 Low
- Air quality 3/10 Moderate 3 unhealthy d/yr today · 4 by 30 yrs out
Nearby sold comps map
Loading sold comps map…
Walkable amenities ~0.75 mi
Loading nearby amenities…
Taxation est. · year 1
- Rental income
- $17,224
- − Mortgage interest
- −$9,119
- − Property taxes
- −$1,731
- − Insurance
- −$814
- − Repairs & maintenance
- −$1,378
- − Management
- −$1,378
- − Depreciation
- −$4,736
- Taxable loss
- −$1,932
- Est. tax savings @ 24.0%
- +$464
- After-tax cash flow
- $1,281/yr
For passive investors: Depreciation is non-cash, so a rental often shows a tax loss while cash-flowing — sheltering income. Rental losses are passive: they offset passive income freely, and up to $25,000/yr can offset ordinary (W-2) income if you actively participate and your MAGI is under $100k (phasing out to $0 by $150k); unused losses carry forward. On sale, claimed depreciation is recaptured at up to 25%, and gains may owe capital-gains tax (a 1031 exchange can defer both). Figures are a year-1 estimate at your 24.0% rate — not tax advice; consult a CPA.
Schools (NCES district)
- District
- North Tonawanda City School District
- NCES district ID
- 3621240
- Math proficiency
- 42% ▼ -16.00%
- Reading proficiency
- 57% ▲ 4.00%
- Median HH income
- $48,348
- Composite
- 42.15/100
- National rank
- #3301
- State rank
- #398 of 590 in NY
Livability — North Tonawanda
- Score
- 85/100
- State rank
- #30
- US rank
- #518
Category grades
Schools grade is shown separately in the Schools card above.
Census & demographics
- Census place
- North Tonawanda, NY
- County
- Niagara County · 157,377 people
- City population
- 44,241
- Metro
- Buffalo-Cheektowaga, NY
- Population (ZIP)
- 44,241
- Household income
- $74,871
- Rent vs Own
- Severe rent burden
- 1303.0
Population outlook (Niagara County) Hauer SSP2
- Today (2025)
- 204,149 people
- By 2030
- 197,900 · -3.1%
- By 2040
- 182,239 · -10.7%
- By 2050
- 165,198 · -19.1%
- By 2075
- 129,416 · -36.6%
- By 2100
- 96,222 · -52.9%
Race, ethnicity, and origin ACS 2023
- Neighborhood character
- Predominantly White (91%)
- Race & ethnicity
- White 91% Two or more races 4% Hispanic / Latino 3% Black 2%
- Common ancestry
- Romanian 15% Lithuanian 2% Slovak 2%
- Foreign-born
- 4% · Canada, China
- Languages at home
- 95% English-only · Russian/Polish/Slavic 2% Spanish 1% Other Indo-European 1%
Political lean MEDSL · Niagara
- 2024 margin
- R (+14.9) · D 42.5% · R 57.5%
- 2008→2024 swing
- -15.9pp toward R · 2008: 1.0pp · 2024: -14.9pp
- All cycles
- 2024: R+14.9 2020: R+9.7 2016: R+19.0 2012: D+0.6 2008: D+1.0
Not yet ingested
- Civics
- —
Market trends
- HPI YoY
- ▼ -260.39%
- Current HPI
- 303.1744
- Rent YoY
- ▲ 5.96%
- Metro
- Buffalo-Cheektowaga, NY
- State GDP YoY
- ▲ 2.60%
- F500 in state
- 92
Industry mix (Fortune 500 HQ in NY)
| Industry | F500 HQs | Revenue |
|---|---|---|
| Financial Services | 10 | $950B |
|
||
| Consumer Goods | 9 | $162B |
|
||
| Insurance | 4 | $225B |
|
||
| Telecommunications | 2 | $144B |
|
||
| Pharmaceuticals | 2 | $112B |
|
||
| Media / Entertainment | 2 | $69B |
|
||
Price history
+30.3% since first listed20 events — show timeline
- 2026-06-01 Pending — WNYREIS
- 2026-05-26 Price Changed $162,800 WNYREIS
- 2026-05-12 Price Changed $163,800 WNYREIS
- 2026-05-06 Price Changed $164,800 WNYREIS
- 2026-05-05 Price Changed $167,800 WNYREIS
- 2026-04-27 Listed $168,800 WNYREIS
- 2026-04-02 Listing Removed — WNYREIS
- 2026-03-27 Price Changed $151,800 WNYREIS
- 2026-03-24 Price Changed $152,800 WNYREIS
- 2026-03-17 Price Changed $153,400 WNYREIS
- 2026-03-03 Listed $155,400 WNYREIS
- 2026-02-26 Listing Removed — WNYREIS
- 2026-02-17 Price Changed $155,400 WNYREIS
- 2026-02-01 Price Changed $155,900 WNYREIS
- 2026-01-11 Listed $159,900 WNYREIS
- 2025-10-30 Sold (MLS) $88,500 WNYREIS
- 2025-07-14 Pending — WNYREIS
- 2025-07-02 Price Changed $99,900 WNYREIS
- 2025-06-17 Price Changed $109,900 WNYREIS
- 2025-05-28 Listed $124,900 WNYREIS
Property tax history
+1.2%/yrLatest (2025): $1,731 · +2.1% YoY. Source: county tax records.
Cash-flow waterfall
monthlySold comps — $/sqft
last 12 mo · ≤1 miLoading sold comps…