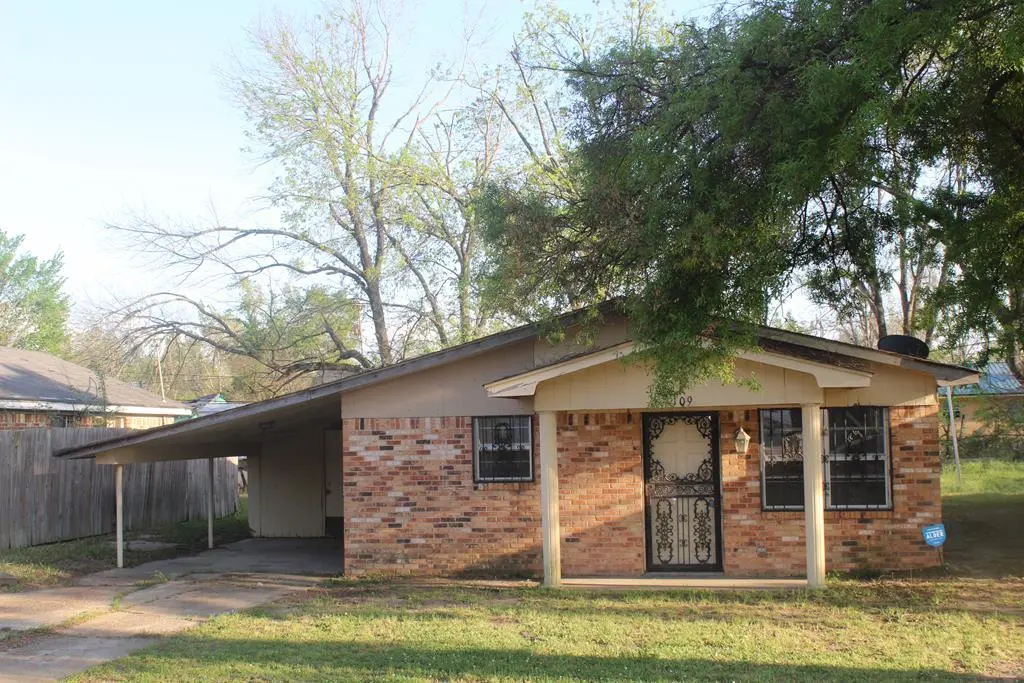
109 Jefferies St · Itta Bena, MS
Flood risk 1/10 · Minimal
- FEMA flood zone
- X (unshaded)
- Chance of flooding over 30 yrs
- 0.0%
- Est. flood insurance / yr
- $507 – $1,088
Fire risk 1/10 · Minimal
- Est. fire insurance / yr
- $1,241 – $2,305
Heat risk 7/10 · Major
- Hot days now (above 110°F)
- 7 days/yr
- Hot days in 30 yrs
- 22 days/yr
Wind risk 6/10 · Moderate
- Chance of severe wind over 30 yrs
- 27.0%
Air-quality risk 1/10 · Minimal
- Unhealthy air days now
- 0 days/yr
- Unhealthy air days in 30 yrs
- 0 days/yr
Risk factors via First Street. Map © Google.
Why this score? — see what drove the B+ grade
The composite is a weighted blend of 9 inputs, each scored 0–100. Each bar is that input's sub-score; the figure is the points it added to the 100-point composite (weight × sub-score).
- Cash flow +30.0/30.0
- ARV discount +13.3/15.0
- 1% rule +10.0/10.0
- DSCR +10.0/10.0
- Schools +5.0/10.0
- Livability +2.9/5.0
- Appreciation +2.7/10.0
- Rent growth +2.5/5.0
- Condition / age +2.5/5.0
$29,900
🖨 Deal sheet (PDF) 📄 Offer letter ✓ Due diligence
Listing remarks MLS
The subject is a 3-bedroom, 1-bath all-brick home located in a rural area with investor or first time homebuyer opportunity. While the property requires repairs and is offered as-is, its construction and layout provide potential for renovation and repositioning within the local market.
Key facts
- Rural area
- All brick home
- Investor opportunity
Tags
Neighborhood map
What this means for you Summary
Snapshot
- This is a 3-bed/1.0-bath single-family listed at $30k.
Deal economics
- At list price, monthly cash flow is $577 ($7k/yr) — positive.
- The deal already cash-flows at list — no discount required.
- Meets the 1% rule at list price ($983 rent vs $30k).
- Recommended offer: $29k (3.0% below list) — sets the bar for market timing.
Location & tenants
- Location reads 57/100 on livability (#280 in MS) — a working-class tenant base; expect higher turnover. Strengths: crime A+, cost of living A+, housing A; Watch: schools F, amenities F, commute F.
- Market conditions: 5 active listings in the ZIP; 9 units permitted in Leflore County in 2024 (0 in 5+ unit buildings).
Forward outlook
- Local home prices are declining (-3.0%/yr); year-one equity from $207 of loan paydown is wiped out by about $897 of value loss. Plan a longer hold.
- Leflore County population projected at -29% by 2050 — secular population decline; favor cash flow + early exit over multi-decade hold.
- At projected returns (-3.0% appreciation + 3.0% rent growth), your $8k cash investment doubles in ~2 years — after that, you're playing with house money.
Negotiation context
- It's been on market 60 days — a 3% lower offer ($29k) is reasonable based on typical stale-listing flexibility.
- 3 sale attempts; this cycle's ask has dropped $30k (50%) from the opening price — seller is motivated, your offer sets the floor, not the list.
Risks & watch-outs
- Climate carrying-cost: major wind risk, 27% chance of damaging wind over 30y; extreme-heat days projected 7→22/yr by 2055 (HVAC capex compounding) — expect insurance premiums to compound above CPI over the hold.
Questions for the listing agent
- It's been on market 60 days. Have you received any prior offers? Is the seller open to a 3% concession, seller financing, or rate buy-down credit?
- Built in 1969 — when were the roof, HVAC, electrical panel, plumbing, and water heater last replaced?
- Is there a deadline driving the sale (1031 exchange, divorce, estate, relocation)? That informs how much negotiation room exists.
- Schools are F-rated, which usually means shorter tenancies and higher turnover. Who's the typical renter profile here, and what's been the actual vacancy rate?
- What's the average days-on-market for RENTAL listings here right now (not sales)? A rising rental-DOM trend means longer vacancies and softer asking-rent achievability than the comps imply.
- What's the recent tenant-quality profile in this submarket — average credit score on applications, eviction rate, late-payment / NSF rate, and stable-employment percentage? A property-management company in the area should have these aggregated.
- How much new for-sale + rental construction is in the pipeline within 1–3 miles? Heavy new supply typically softens prices + rents 12–24 months out; constrained supply supports both.
Investment metrics
- 1% rule
- 3.29% ✓
- Cap rate
- 29.46%
- Cash-on-cash
- 82.75%
- DSCR
- 4.68
- GRM
- 2.5
CMA / ARV
- ARV (median comp)
- $34,325
- List price
- $29,900
- Delta
- -12.89%
- Verdict
- UNDERPRICED
- Comps
- 10 within 1.0 mi
Show comp detail 3 sales within ~0.75 mi
| Address | Dist | Beds/Ba | Sqft | Sold | Price | $/sf | Match |
|---|---|---|---|---|---|---|---|
| 404 Mitchell St | 0.45mi | 3/1.0 | 1,065 (-5%) | 2mo | $80,000 | $75 | 68 |
| 112 Morgan Ln | 0.48mi | 3/1.0 | 1,065 (-5%) | 7mo | $11,470 | $11 | 63 |
| 704 Cleveland St | 0.41mi | 3/1.0 | 1,188 (+6%) | 15mo | $13,320 | $11 | 59 |
Match score weights: distance 35% · size 25% · config 20% · recency 20%. Top-matched comps best support the ARV.
Projected returns pro-forma
-3.0% appreciation · 3.0% rent growth · sell at horizon
- IRR
- 83.1%
- Equity multiple
- 4.81×
- Total profit
- $31,937
- Equity at exit
- $4,458
- IRR
- 86.4%
- Equity multiple
- 9.98×
- Total profit
- $75,201
- Equity at exit
- $2,585
Cash invested: $8,372 (down + closing). Projections, not guarantees.
Landlord ↔ Tenant lean methodology
- Overall (STATE)
- 90 Strongly Landlord-Friendly
- State Mississippi
- 90 Strongly Landlord-Friendly · R+11
- County
- — inherits STATE
- City
- — inherits STATE
ZIP-level market 38941
- Home prices YoY
- -5.6%
- Active inventory
- 5
- Price-to-rent
- 2.5×
Monthly cashflow live
- Estimated rent
- $983 medium interval (Pro) →
- Mortgage (P&I)
- −$157
- Tax from tax record
- −$30 /mo · $361/yr
- Insurance
- −$12
- HOA
- −$0
- Vacancy / Maint / Mgmt
- −$206
- Net cashflow
- $577
Break-even live
Sensitivity live
| Price | -10% $594 | -5% $586 | +0% $577 | +5% $569 | +10% $560 |
|---|---|---|---|---|---|
| Rent | -10% $500 | -5% $539 | +0% $577 | +5% $616 | +10% $655 |
| Rate | -1.0pp $592 | -0.5pp $585 | base $577 | +0.5pp $570 | +1.0pp $562 |
UW: 25.0% down · 7.5% · 30yr · 1.5% tax · 5.0% vac · 8.0% maint · 8.0% mgmt
Financing live
Cash to close
- Down payment
- $7,475
- Closing costs
- $897
- Reserves months
- —
- Total cash needed
- —
Loan-product check · same deal, 3 products live
Conventional
25% down · 7.5% · 30yr
- Down + closing
- —
- Monthly P&I
- —
- Monthly cashflow
- —
- DSCR
- —
- Eligible?
- —
Personal DTI + credit; lowest rate.
DSCR
20% down · 8.5% · 30yr
- Down + closing
- —
- Monthly P&I
- —
- Monthly cashflow
- —
- DSCR
- —
- Eligible?
- —
No personal income docs; deal must DSCR.
Hard money
10% down · 12.0% · 12mo
- Down + closing
- —
- Monthly P&I
- —
- Monthly cashflow
- —
- DSCR
- —
- Eligible?
- —
Short-term bridge; refi at stabilization.
Listing history 19 events
-
2026-06-21days on market $29,900 Active 60 DOM
-
2026-06-18days on market $29,900 Active 58 DOM
-
2026-06-17days on market $29,900 Active 57 DOM
-
2026-06-16days on market $29,900 Active 56 DOM
-
2026-06-15days on market $29,900 Active 55 DOM
-
2026-06-13days on market $29,900 Active 53 DOM
-
2026-06-12days on market $29,900 Active 52 DOM
-
2026-06-09days on market $29,900 Active 49 DOM
-
2026-06-08days on market $29,900 Active 48 DOM
-
2026-06-07days on market $29,900 Active 47 DOM
-
2026-06-04days on market $29,900 Active 43 DOM
-
2026-06-02days on market $29,900 Active 42 DOM
-
2026-06-01days on market $29,900 Active 41 DOM
-
2026-05-31days on market $29,900 Active 40 DOM
-
2026-04-22$59,900 Active 286-char remark
Show marketing remark (286 chars)
The subject is a 3-bedroom, 1-bath all-brick home located in a rural area with investor or first time homebuyer opportunity. While the property requires repairs and is offered as-is, its construction and layout provide potential for renovation and repositioning within the local market.
-
2026-04-21$59,900 Active 286-char remark
Show marketing remark (286 chars)
The subject is a 3-bedroom, 1-bath all-brick home located in a rural area with investor or first time homebuyer opportunity. While the property requires repairs and is offered as-is, its construction and layout provide potential for renovation and repositioning within the local market.
-
2025-08-01historical
-
2025-02-01$40,000 Active
-
1980-06-27soldstatus
ⓘ Source: listings_history table (triggers on properties + properties_extension) + one-shot
backfill from property_details.listing_events for pre-trigger history.
Tax reassessment forecast MS · Resets to sale price
- Current annual tax
- $361 · $30/mo
- Projected year-2 tax
- $361 · $30/mo
- Expected delta
- $0/yr ($0/mo · 0.0%)
ⓘ Screening estimate from a state-policy table — verify with the county assessor before closing.
Climate risk First Street
- Flood 1/10 Low FEMA zone X (unshaded) · 0% chance over 30 yrs
- Wildfire 1/10 Low
- Heat 7/10 Severe 7 d/yr ≥110°F today · 22 d/yr by 30 yrs out
- Wind 6/10 Major 27% chance of damaging wind over 30 yrs
- Air quality 1/10 Low 0 unhealthy d/yr today · 0 by 30 yrs out
Nearby sold comps map
Loading sold comps map…
Walkable amenities ~0.75 mi
Loading nearby amenities…
Taxation est. · year 1
- Rental income
- $11,798
- − Mortgage interest
- −$1,675
- − Property taxes
- −$361
- − Insurance
- −$150
- − Repairs & maintenance
- −$944
- − Management
- −$944
- − Depreciation
- −$870
- Taxable income
- $6,855
- Est. tax owed @ 24.0%
- −$1,645
- After-tax cash flow
- $5,283/yr
For passive investors: Depreciation is non-cash, so a rental often shows a tax loss while cash-flowing — sheltering income. Rental losses are passive: they offset passive income freely, and up to $25,000/yr can offset ordinary (W-2) income if you actively participate and your MAGI is under $100k (phasing out to $0 by $150k); unused losses carry forward. On sale, claimed depreciation is recaptured at up to 25%, and gains may owe capital-gains tax (a 1031 exchange can defer both). Figures are a year-1 estimate at your 24.0% rate — not tax advice; consult a CPA.
Schools (NCES district)
No district data.
Livability — Itta Bena
- Score
- 57/100
- State rank
- #280
- US rank
- #21568
Category grades
Schools grade is shown separately in the Schools card above.
Census & demographics
- Census place
- Itta Bena, MS
- Population (ZIP)
- 3,478
Population outlook (Leflore County) Hauer SSP2
- Today (2025)
- 27,008 people
- By 2030
- 25,362 · -6.1%
- By 2040
- 22,049 · -18.4%
- By 2050
- 19,188 · -29.0%
- By 2075
- 13,543 · -49.9%
- By 2100
- 8,913 · -67.0%
Race, ethnicity, and origin ACS 2023
- Neighborhood character
- Predominantly Black (88%)
- Race & ethnicity
- Black 88% White 10% Two or more races 1%
- Foreign-born
- 2%
- Languages at home
- 98% English-only · Spanish 1%
Political lean MEDSL · Leflore
- 2024 margin
- Solid D (+38.5) · D 68.7% · R 30.3%
- 2008→2024 swing
- +1.7pp toward D · 2008: 36.8pp · 2024: 38.5pp
- All cycles
- 2024: D+38.5 2020: D+41.5 2016: D+41.0 2012: D+45.8 2008: D+36.8
Not yet ingested
- Civics
- —
Market trends
- HPI YoY
- ▼ -4.57%
- Current HPI
- 76.7465
- Rent YoY
- —
- Metro
- —
- State GDP YoY
- —
- F500 in state
- 0
Price history
+49.8% since first listed5 events — show timeline
- 2026-04-22 Listed $59,900 NCMBR
- 2026-04-21 Listed $59,900 MLSU
- 2025-08-01 Listing Removed — MLSU
- 2025-02-01 Listed $40,000 MLSU
- 1980-06-27 Sold (Public Records) — Public Records
Property tax history
-19.8%/yrLatest (2025): $361 · +18.7% YoY. Source: county tax records.
Cash-flow waterfall
monthlySold comps — $/sqft
last 12 mo · ≤1 miLoading sold comps…