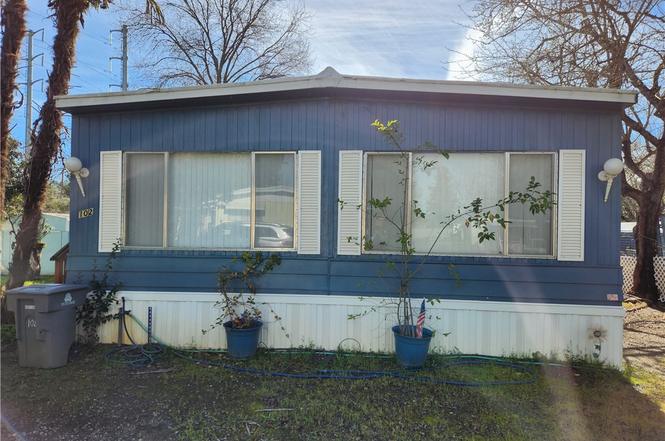
6368 Lincoln Blvd #102 · Palermo, CA
Flood risk 1/10 · Minimal
- FEMA flood zone
- X (unshaded)
- Chance of flooding over 30 yrs
- 0.0%
- Est. flood insurance / yr
- $507 – $1,088
Fire risk 10/10 · Severe
- Est. fire insurance / yr
- $659 – $1,223
Heat risk 7/10 · Major
- Hot days now (above 105°F)
- 7 days/yr
- Hot days in 30 yrs
- 16 days/yr
Wind risk 1/10 · Minimal
- Chance of severe wind over 30 yrs
- —
Air-quality risk 10/10 · Severe
- Unhealthy air days now
- 29 days/yr
- Unhealthy air days in 30 yrs
- 36 days/yr
Risk factors via First Street. Map © Google.
Why this score? — see what drove the B- grade
The composite is a weighted blend of 9 inputs, each scored 0–100. Each bar is that input's sub-score; the figure is the points it added to the 100-point composite (weight × sub-score).
- Cash flow +30.0/30.0
- 1% rule +10.0/10.0
- DSCR +10.0/10.0
- ARV discount +9.4/15.0
- Rent growth +2.5/5.0
- Schools +2.5/10.0
- Condition / age +2.5/5.0
- Livability +2.4/5.0
- Appreciation +0.0/10.0
$39,999
🖨 Deal sheet (PDF) 📄 Offer letter ✓ Due diligence
Listing remarks
Beautiful home located in the peaceful and welcoming Lake Vista Mobile Home Park. This is a great opportunity to own a spacious and well maintained home with two bedrooms, two bathrooms, and a large living room. New HVAC system installed in 2024. Park also provides amenities such as pool and recreational areas near by. Don't let this opportunity slip by, call your Realtor today!
Key facts
- Community pool
- Built 1973
- Listed 110 days
Property features AI
Finance
- Financial info: Land lease: $650 monthly (land lease community); Rent includes pool
- HOA & community: Senior community; Manager approval required; Community features include: lake, watersports, fishing, boating, golf course, hiking, biking, horse trails, parks, dog park, hunting, foothills
Exterior
- Parking: Driveway; Park name: Lake Vista; Maintained road access; Accessible parking
- Utilities: District/public water; Public sewer; Natural gas connected; Electricity connected (standard); Sewer connected; Cable available; Telephone available in street; Water connected
- Home design: Manufactured/mobile home (Model: FARWEST); Double body type; Mobile home remains on site; Single-story; Entry level 1; Has a view
- Construction: Aluminum construction materials; Aluminum skirting
- Exterior features: Porch; Awning; Community pool; Shed; Chain link fence; Aluminum skirting
Interior
- Kitchen: Formica counters; Microwave; Refrigerator; Gas range; Dishwasher; Water heater unit
- Bedrooms: All bedrooms on main level
- Flooring: Vinyl flooring
- Bathrooms: One full bathroom; One 3/4 bathroom; Shower-in-tub
- Heating & cooling: Central heating (central furnace); Central cooling
- Interior features: Turnkey condition; Open kitchen to family room; No interior steps; Unfurnished; Side entry; One level
- Laundry & utility: Indoor laundry; Washer included; Dryer included
Neighborhood map
What this means for you Summary
Snapshot
- This is a 2-bed/2.0-bath manufactured listed at $40k.
Deal economics
- At list price, monthly cash flow is $1k ($13k/yr) — positive.
- The deal already cash-flows at list — no discount required.
- Meets the 1% rule at list price ($2k rent vs $40k).
- Recommended offer: $36k (9.0% below list) — sets the bar for market timing.
- Cap rate 38.1% vs local median 3.8% in Palermo — top-decile yield for the area; either an underpriced asset or a hidden risk that comps aren't pricing in. Stress-test before assuming the spread holds.
Location & tenants
- Location reads 48/100 on livability (#1,219 in CA) — a working-class tenant base; expect higher turnover. Strengths: housing B+; Watch: crime F, amenities F, commute F.
- Palermo Union Elementary (town): math 20% / reading 33% proficiency, ranked #1,149 of 1,400 in CA (top 82%) — low school quality limits family demand, transient renter base, plan for 1-2y turnover; 72% free/reduced lunch — lower-income household profile, screen leases tightly.
- Zoned schools: Helen M. Wilcox Elementary (516 students, 83% FRL); Palermo (404 students, 78% FRL); Las Plumas High (math 17% / reading 52%, grade F, #618 of 1,170 statewide, top 56%, 1,287 students, 76% FRL).
- Market conditions: 376 active listings in the ZIP; 946 units permitted in Butte County in 2024 (254 in 5+ unit buildings).
- This rent runs 30% of the median local income ($66k/yr) — at the standard rent-burdened threshold; future hikes will face affordability resistance.
Forward outlook
- Local home prices are declining (-3.0%/yr); year-one equity from $276 of loan paydown is wiped out by about $1k of value loss. Plan a longer hold.
- Butte County population projected at +10% by 2050 — modest demand growth; plan on rents tracking national, not racing it.
- At projected returns (-3.0% appreciation + 3.0% rent growth), your $11k cash investment doubles in ~1 year — after that, you're playing with house money.
Negotiation context
- It's been on market 110 days — a 9% lower offer ($36k) is reasonable based on typical stale-listing flexibility.
- 4 sale attempts since 4y ago; this cycle's ask has dropped $5k (11%) from the opening price — seller is motivated, your offer sets the floor, not the list.
Risks & watch-outs
- Climate carrying-cost: severe wildfire risk; extreme-heat days projected 7→16/yr by 2055 (HVAC capex compounding) — expect insurance premiums to compound above CPI over the hold.
Questions for the listing agent
- It's been on market 110 days. Have you received any prior offers? Is the seller open to a 9% concession, seller financing, or rate buy-down credit?
- Built in 1973 — when were the roof, HVAC, electrical panel, plumbing, and water heater last replaced?
- Why hasn't it sold? Are there any deal-killer items the seller is aware of (foundation, flood, title, zoning, code violations)?
- Is there a deadline driving the sale (1031 exchange, divorce, estate, relocation)? That informs how much negotiation room exists.
- Schools are F-rated, which usually means shorter tenancies and higher turnover. Who's the typical renter profile here, and what's been the actual vacancy rate?
- Crime grade is F in this area — have there been break-ins, vandalism, or insurance claims at this property in the last 3 years? What carrier currently insures it and at what premium?
- What's the average days-on-market for RENTAL listings here right now (not sales)? A rising rental-DOM trend means longer vacancies and softer asking-rent achievability than the comps imply.
- What's the recent tenant-quality profile in this submarket — average credit score on applications, eviction rate, late-payment / NSF rate, and stable-employment percentage? A property-management company in the area should have these aggregated.
- How much new for-sale + rental construction is in the pipeline within 1–3 miles? Heavy new supply typically softens prices + rents 12–24 months out; constrained supply supports both.
Investment metrics
- 1% rule
- 4.15% ✓
- Cap rate
- 38.10%
- Cash-on-cash
- 113.59%
- DSCR
- 6.05
- GRM
- 2.0
CMA / ARV
- ARV (on-the-fly)
- $41,760
- Comps found
- 3
Show comp detail 3 sales within ~0.75 mi
| Address | Dist | Beds/Ba | Sqft | Sold | Price | $/sf | Match |
|---|---|---|---|---|---|---|---|
| 6368 Lincoln #2 | 0.05mi | 2/2.0 | 1,440 (0%) | 8mo | $42,000 | $29 | 91 |
| 6368-#63 Lincoln Blvd | 0.08mi | 2/2.0 | 1,344 (-7%) | 2mo | $23,000 | $17 | 84 |
| 6715 Lincoln Blvd | 0.30mi | 2/2.0 | 1,344 (-7%) | 23mo | $288,000 | $214 | 56 |
Match score weights: distance 35% · size 25% · config 20% · recency 20%. Top-matched comps best support the ARV.
Projected returns pro-forma
-3.0% appreciation · 3.0% rent growth · sell at horizon
- IRR
- —
- Equity multiple
- 6.45×
- Total profit
- $61,053
- Equity at exit
- $5,964
- IRR
- —
- Equity multiple
- 13.51×
- Total profit
- $140,153
- Equity at exit
- $3,458
Cash invested: $11,200 (down + closing). Projections, not guarantees.
Landlord ↔ Tenant lean methodology
- Overall (STATE)
- 18 Strongly Tenant-Friendly
- State California
- 18 Strongly Tenant-Friendly · D+13
- County
- — inherits STATE
- City
- — inherits STATE
ZIP-level market 95966
- Active inventory
- 376
- Price-to-rent
- 2.0×
Monthly cashflow live
- Estimated rent
- $1,662 medium interval (Pro) →
- Mortgage (P&I)
- −$210
- Tax from tax record
- −$26 /mo · $312/yr
- Insurance
- −$17
- HOA
- −$0
- Vacancy / Maint / Mgmt
- −$349
- Net cashflow
- $1,060
Break-even live
Sensitivity live
| Price | -10% $1,083 | -5% $1,072 | +0% $1,060 | +5% $1,049 | +10% $1,038 |
|---|---|---|---|---|---|
| Rent | -10% $929 | -5% $995 | +0% $1,060 | +5% $1,126 | +10% $1,191 |
| Rate | -1.0pp $1,080 | -0.5pp $1,070 | base $1,060 | +0.5pp $1,050 | +1.0pp $1,039 |
UW: 25.0% down · 7.5% · 30yr · 1.5% tax · 5.0% vac · 8.0% maint · 8.0% mgmt
Financing live
Cash to close
- Down payment
- $10,000
- Closing costs
- $1,200
- Reserves months
- —
- Total cash needed
- —
Loan-product check · same deal, 3 products live
Conventional
25% down · 7.5% · 30yr
- Down + closing
- —
- Monthly P&I
- —
- Monthly cashflow
- —
- DSCR
- —
- Eligible?
- —
Personal DTI + credit; lowest rate.
DSCR
20% down · 8.5% · 30yr
- Down + closing
- —
- Monthly P&I
- —
- Monthly cashflow
- —
- DSCR
- —
- Eligible?
- —
No personal income docs; deal must DSCR.
Hard money
10% down · 12.0% · 12mo
- Down + closing
- —
- Monthly P&I
- —
- Monthly cashflow
- —
- DSCR
- —
- Eligible?
- —
Short-term bridge; refi at stabilization.
Listing history 29 events
-
2026-06-22days on market $39,999 Active 110 DOM
-
2026-06-19days on market $39,999 Active 108 DOM
-
2026-06-18days on market $39,999 Active 107 DOM
-
2026-06-17days on market $39,999 Active 106 DOM
-
2026-06-16days on market $39,999 Active 105 DOM
-
2026-06-15days on market $39,999 Active 104 DOM
-
2026-06-14days on market $39,999 Active 102 DOM
-
2026-06-13days on market $39,999 Active 101 DOM
-
2026-06-10days on market $39,999 Active 99 DOM
-
2026-06-09days on market $39,999 Active 98 DOM
-
2026-06-08days on market $39,999 Active 97 DOM
-
2026-06-07days on market $39,999 Active 96 DOM
-
2026-06-05days on market $39,999 Active 93 DOM
-
2026-06-02days on market $39,999 Active 91 DOM
-
2026-06-01days on market $39,999 Active 90 DOM
-
2026-05-31days on market $39,999 Active 89 DOM
-
2026-05-30days on market $39,999 Active 88 DOM
-
2026-05-19price $39,999
-
2026-03-03$45,000 Active
-
2025-10-31historical
-
2025-08-22price $59,000
-
2025-05-30price $63,000
-
2025-04-28price $68,000
-
2025-03-02$73,000 Active
-
2024-07-31historical
-
2024-06-23price $65,500
-
2024-03-13$69,000 Active
-
2022-08-01historical
-
2022-07-16$105,000 Active
ⓘ Source: listings_history table (triggers on properties + properties_extension) + one-shot
backfill from property_details.listing_events for pre-trigger history.
Tax reassessment forecast CA · Resets to sale price
- Current annual tax
- $312 · $26/mo
- Projected year-2 tax
- $312 · $26/mo
- Expected delta
- $0/yr ($0/mo · 0.0%)
ⓘ Screening estimate from a state-policy table — verify with the county assessor before closing.
Climate risk First Street
- Flood 1/10 Low FEMA zone X (unshaded) · 0% chance over 30 yrs
- Wildfire 10/10 Extreme
- Heat 7/10 Severe 7 d/yr ≥105°F today · 16 d/yr by 30 yrs out
- Wind 1/10 Low
- Air quality 10/10 Extreme 29 unhealthy d/yr today · 36 by 30 yrs out
Nearby sold comps map
Loading sold comps map…
Walkable amenities ~0.75 mi
Loading nearby amenities…
Taxation est. · year 1
- Rental income
- $19,938
- − Mortgage interest
- −$2,241
- − Property taxes
- −$312
- − Insurance
- −$200
- − Repairs & maintenance
- −$1,595
- − Management
- −$1,595
- − Depreciation
- −$1,164
- Taxable income
- $12,832
- Est. tax owed @ 24.0%
- −$3,080
- After-tax cash flow
- $9,643/yr
For passive investors: Depreciation is non-cash, so a rental often shows a tax loss while cash-flowing — sheltering income. Rental losses are passive: they offset passive income freely, and up to $25,000/yr can offset ordinary (W-2) income if you actively participate and your MAGI is under $100k (phasing out to $0 by $150k); unused losses carry forward. On sale, claimed depreciation is recaptured at up to 25%, and gains may owe capital-gains tax (a 1031 exchange can defer both). Figures are a year-1 estimate at your 24.0% rate — not tax advice; consult a CPA.
Schools (NCES district)
- District
- Palermo Union Elementary
- NCES district ID
- 0629540
- Math proficiency
- 20% ▲ 1.00%
- Reading proficiency
- 33% ▬ 0.00%
- Median HH income
- $39,628
- Composite
- 25.26/100
- National rank
- #12903
- State rank
- #1149 of 1400 in CA
Livability — Palermo
- Score
- 48/100
- State rank
- #1219
- US rank
- #26161
Category grades
Schools grade is shown separately in the Schools card above.
Census & demographics
- Census place
- Palermo, CA
- County
- Butte County · 175,030 people
- Metro
- Chico, CA
- Population (ZIP)
- 28,503
- Household income
- $65,586
- Rent vs Own
- Severe rent burden
- 807.0
Population outlook (Butte County) Hauer SSP2
- Today (2025)
- 237,527 people
- By 2030
- 243,804 · +2.6%
- By 2040
- 253,899 · +6.9%
- By 2050
- 262,561 · +10.5%
- By 2075
- 283,709 · +19.4%
- By 2100
- 282,689 · +19.0%
Race, ethnicity, and origin ACS 2023
- Neighborhood character
- Predominantly White (67%)
- Race & ethnicity
- White 67% Hispanic / Latino 18% Two or more races 14% Asian 6% Native American 2% Black 2%
- Hispanic origin (detail)
- Mexican 16%
- Common ancestry
- Lithuanian 3% Slovak 3% Portuguese 2%
- Foreign-born
- 6% · Canada
- Languages at home
- 88% English-only · Spanish 7% Other Asian/Pacific 3% Russian/Polish/Slavic 1%
Political lean MEDSL · Butte
- 2024 margin
- Toss-up / Even · D 46.8% · R 49.9% · Other 3.3%
- 2008→2024 swing
- -5.5pp toward R · 2008: 2.4pp · 2024: -3.1pp
- All cycles
- 2024: R+3.1 2020: D+1.7 2016: R+4.0 2012: R+3.9 2008: D+2.4
Not yet ingested
- Civics
- —
Market trends
- HPI YoY
- ▼ -284.58%
- Current HPI
- 267.1415
- Rent YoY
- —
- Metro
- Chico, CA
- State GDP YoY
- ▲ 3.21%
- F500 in state
- 116
Industry mix (Fortune 500 HQ in CA)
| Industry | F500 HQs | Revenue |
|---|---|---|
| Technology | 27 | $1,492B |
|
||
| Financial Services | 3 | $174B |
|
||
| Retail | 3 | $44B |
|
||
| Insurance | 3 | $26B |
|
||
| Media / Entertainment | 2 | $115B |
|
||
| Pharmaceuticals / Biotech | 2 | $62B |
|
||
Price history
-61.9% since first listed12 events — show timeline
- 2026-05-19 Price Changed $39,999 CRMLS
- 2026-03-03 Listed $45,000 CRMLS
- 2025-10-31 Listing Removed — CRMLS
- 2025-08-22 Price Changed $59,000 CRMLS
- 2025-05-30 Price Changed $63,000 CRMLS
- 2025-04-28 Price Changed $68,000 CRMLS
- 2025-03-02 Listed $73,000 CRMLS
- 2024-07-31 Listing Removed — CRMLS
- 2024-06-23 Price Changed $65,500 CRMLS
- 2024-03-13 Listed $69,000 CRMLS
- 2022-08-01 Listing Removed — CRMLS
- 2022-07-16 Listed $105,000 CRMLS
Property tax history
+3.6%/yrLatest (2025): $312 · +1.9% YoY. Source: county tax records.
Cash-flow waterfall
monthlySold comps — $/sqft
last 12 mo · ≤1 miLoading sold comps…