 🏷️ Likely Rental
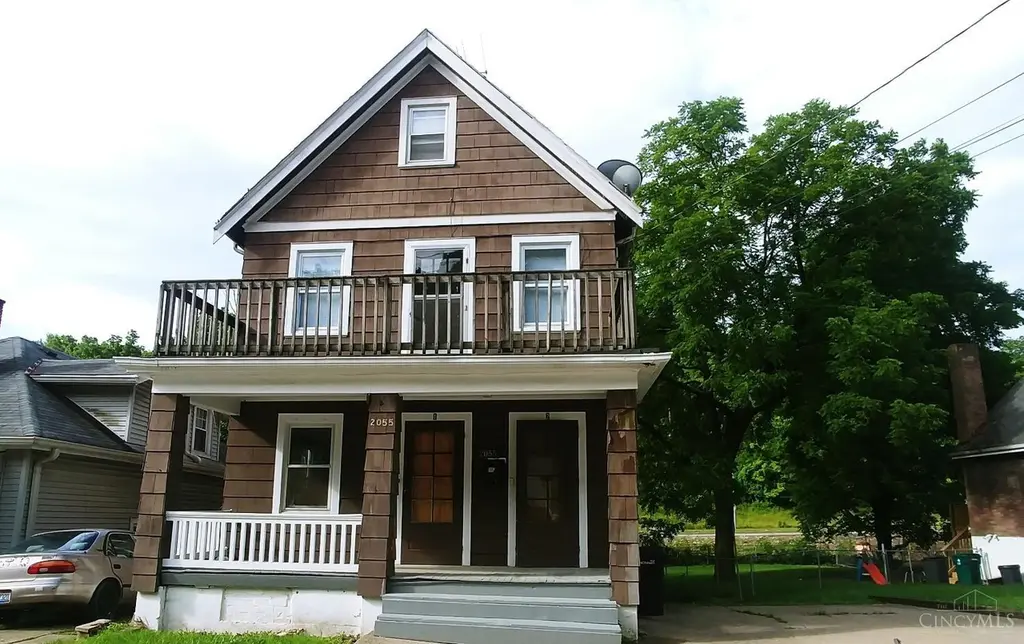
2055 Queen City Ave · Cincinnati, OH
Flood risk 10/10 · Severe
- FEMA flood zone
- X (unshaded)
- Chance of flooding over 30 yrs
- 0.99%
- Est. flood insurance / yr
- $473 – $860
Fire risk 1/10 · Minimal
- Est. fire insurance / yr
- $713 – $1,323
Heat risk 4/10 · Minor
- Hot days now (above 103°F)
- 7 days/yr
- Hot days in 30 yrs
- 19 days/yr
Wind risk 2/10 · Minimal
- Chance of severe wind over 30 yrs
- 1.0%
Air-quality risk 3/10 · Minor
- Unhealthy air days now
- 3 days/yr
- Unhealthy air days in 30 yrs
- 5 days/yr
Risk factors via First Street. Map © Google.
Why this score? — see what drove the A grade
The composite is a weighted blend of 9 inputs, each scored 0–100. Each bar is that input's sub-score; the figure is the points it added to the 100-point composite (weight × sub-score).
- Cash flow +30.0/30.0
- ARV discount +15.0/15.0
- 1% rule +10.0/10.0
- DSCR +10.0/10.0
- Appreciation +10.0/10.0
- Rent growth +4.5/5.0
- Livability +4.0/5.0
- Schools +2.5/10.0
- Condition / age +2.5/5.0
$142,000
🖨 Deal sheet 📄 Offer letter ✓ Due diligence
Multi-family units
County records classify this as Multi-Family (2-4 Unit). Listing-text estimate: 1 unit. estimate disagrees with records
Listing remarks MLS
Solid duplex in South Fairmount, backing to Lick Run Greenway Project in an area of major redevelopment. Huge potential. Fully occupied, tenants on month to month leases. The first floor is a 1 bedroom one bath unit, and a 2 bedroom one bath unit occupies the second and third floors. Could be converted to a single family. Off Street parking. Separate water heaters and furnaces. Owner pays water.
Key facts
- Off street parking
- Separate furnaces
- 3,572 sq ft lot
Tags
Property features AI
Finance
- Other: Both tenants are month-to-month
- Financial info: Property contains 2 total rental units; Unit 1 (1-bedroom, ~744): current rent $735 (month-to-month tenant); Unit 2 (2-bedroom, ~1,101): current rent $802 (month-to-month tenant)
- HOA & community: No HOA information provided
Exterior
- Parking: 2 garage spaces; 2 open parking spaces; On-street parking and driveway
- Security: No security details provided
- Utilities: Public water (owner pays water); Public sewer; Natural gas available
- Home design: Duplex; Two-story; Second floor area approximately 744 sq ft
- Construction: Wood siding exterior; Shingle roof; Poured foundation; Built with two levels
- Exterior features: Porch; Balcony; Vinyl windows
Interior
- Kitchen: No kitchen appliance details provided
- Bedrooms: Unit 1: 1 bedroom; Unit 2: 2 bedrooms
- Flooring: No flooring details provided
- Bathrooms: Unit 1: 1 full bathroom; Unit 2: 1 full bathroom
- Heating & cooling: Gas heating; Heat paid by tenants (for at least some utilities)
- Interior features: Full basement; Two levels; Inoperable fireplaces (2)
- Laundry & utility: Separate furnace for units; Separate gas and electric meters
Neighborhood map
What this means for you Summary
Snapshot
- This is a 3-bed/2.0-bath multifamily listed at $142k.
Deal economics
- At list price, monthly cash flow is $1k ($15k/yr) — positive.
- The deal already cash-flows at list — no discount required.
- Meets the 1% rule at list price ($3k rent vs $142k).
- Recommended offer: $138k (3.0% below list) — sets the bar for market timing.
- Cap rate 17.4% vs local median 3.9% in Cincinnati — top-decile yield for the area; either an underpriced asset or a hidden risk that comps aren't pricing in. Stress-test before assuming the spread holds.
Location & tenants
- Location reads 80/100 on livability (#130 in OH, #1,856 nationally) — a professional / high-income tenant draw. Strengths: amenities A+, commute A+, cost of living A+; Watch: employment D, crime F.
- Cincinnati Public Schools (urban): math 25% / reading 36% proficiency, ranked #581 of 656 in OH (top 89%) — families likely to look elsewhere, expect single-tenant / working-renter base with shorter leases; 70% free/reduced lunch — lower-income household profile, screen leases tightly.
- Market conditions: Rents rising fast (+8.1%/yr); 67 active listings in the ZIP; 18 comparable units currently listed for rent nearby; rentals at typical pace (median 20d on market — plan ~3-4 weeks tenant-placement turnaround); lower-income renter base — watch delinquency; 801 units permitted in Hamilton County in 2024 (190 in 5+ unit buildings).
- At $2,812/mo this rent would consume 121% of the median local household income ($28k/yr) (locally 857% of renters already pay >50% of income on rent) — very limited rent-growth headroom before tenants either downsize or default.
Forward outlook
- In year one you build about $15k of equity ($982 loan paydown + $14k appreciation (10.0% local appreciation)).
- At projected returns (10.0% appreciation + 8.0% rent growth), your $40k cash investment doubles in ~2 years — after that, you're playing with house money.
- By year 3, paydown + projected appreciation supports a ~$38k cash-out refi (75% LTV) — recoverable capital for the next deal without selling this one.
Negotiation context
- It's been on market 52 days — a 3% lower offer ($138k) is reasonable based on typical stale-listing flexibility.
- 10 sale attempts since 29y ago with the ask held roughly flat each time — persistent listings suggest the price (not the market) is what's stuck; bring a comps-based counter.
- Current owner paid $52k; list at $142k implies a 173% gain — meaningful room to come down on a strong offer.
Risks & watch-outs
- Watch-outs: flood insurance adds $56/mo; built in 1928 — expect roof / HVAC / electrical / plumbing capex.
- Climate carrying-cost: severe flood risk — expect insurance premiums to compound above CPI over the hold.
Questions for the listing agent
- It's been on market 52 days. Have you received any prior offers? Is the seller open to a 3% concession, seller financing, or rate buy-down credit?
- Built in 1928 — when were the roof, HVAC, electrical panel, plumbing, and water heater last replaced?
- What's the actual annual flood-insurance premium (NFIP or private), and is the property in a SFHA with mandatory coverage?
- Is there a deadline driving the sale (1031 exchange, divorce, estate, relocation)? That informs how much negotiation room exists.
- Schools are B-rated — typically a magnet for longer-tenancy family renters. What's the average tenant stay here, and is there a school-zone premium baked into asking?
- Crime grade is F in this area — have there been break-ins, vandalism, or insurance claims at this property in the last 3 years? What carrier currently insures it and at what premium?
- What's the average days-on-market for RENTAL listings here right now (not sales)? A rising rental-DOM trend means longer vacancies and softer asking-rent achievability than the comps imply.
- What's the recent tenant-quality profile in this submarket — average credit score on applications, eviction rate, late-payment / NSF rate, and stable-employment percentage? A property-management company in the area should have these aggregated.
- How much new apartment / multifamily construction is in the pipeline within 1–3 miles? Heavy new supply (>2% of stock underway) typically softens rents 12–24 months out; light construction supports rent growth.
Investment metrics
- 1% rule
- 1.98% ✓
- Cap rate
- 17.39%
- Cash-on-cash
- 39.62%
- DSCR
- 2.76
- GRM
- 4.2
CMA / ARV
- ARV (on-the-fly)
- $208,485
- Comps found
- 2
Show comp detail 2 sales within ~0.75 mi
| Address | Dist | Beds/Ba | Sqft | Sold | Price | $/sf | Match |
|---|---|---|---|---|---|---|---|
| 4000 Akochia Ave | 0.64mi | 3/2.0 | 1,638 (-11%) | 1mo | $155,000 | $95 | 50 |
| 2909 Cavanaugh Ave | 0.72mi | 4/2.0 (+1) | 1,984 (+8%) | 10mo | $225,000 | $113 | 41 |
Match score weights: distance 35% · size 25% · config 20% · recency 20%. Top-matched comps best support the ARV.
Projected returns pro-forma
10.0% appreciation · 8.0% rent growth · sell at horizon
- IRR
- 56.9%
- Equity multiple
- 5.33×
- Total profit
- $172,297
- Equity at exit
- $127,925
- IRR
- 52.5%
- Equity multiple
- 13.11×
- Total profit
- $481,302
- Equity at exit
- $275,875
Cash invested: $39,760 (down + closing). Projections, not guarantees.
Landlord ↔ Tenant lean methodology
- Overall (STATE)
- 73 Landlord-Friendly
- State Ohio
- 73 Landlord-Friendly · R+6
- County
- — inherits STATE
- City
- — inherits STATE
ZIP-level market 45214
- Home prices YoY
- 3.6%
- Rents YoY
- 8.1%
- Active inventory
- 67
- Price-to-rent
- 13.4×
Monthly cashflow live
- Estimated rent
- $2,812 high interval (Pro) →
- Mortgage (P&I)
- −$745
- Tax from tax record
- −$105 /mo · $1,260/yr
- Insurance
- −$59
- Flood insurance flood zone
- −$56 /mo · $666/yr
- HOA
- −$0
- Vacancy / Maint / Mgmt
- −$591
- Net cashflow
- $1,257
Break-even live
3-unit breakdown (identical units grouped — click to expand)
| Units | Beds | Baths | Est. rent |
|---|---|---|---|
| 1× unit | 1 | 1 | $883 |
| 2× units | 2 | 1 | $1,930 |
| #2 | 2 | 1 | $965 |
| #3 | 2 | 1 | $965 |
| Total (3 units) | $2,812 | ||
UW: 25.0% down · 7.5% · 30yr · 1.5% tax · 5.0% vac · 8.0% maint · 8.0% mgmt
Financing live
Cash to close
- Down payment
- $35,500
- Closing costs
- $4,260
- Reserves months
- —
- Total cash needed
- —
Loan-product check · same deal, 3 products live
Conventional
25% down · 7.5% · 30yr
- Down + closing
- —
- Monthly P&I
- —
- Monthly cashflow
- —
- DSCR
- —
- Eligible?
- —
Personal DTI + credit; lowest rate.
DSCR
20% down · 8.5% · 30yr
- Down + closing
- —
- Monthly P&I
- —
- Monthly cashflow
- —
- DSCR
- —
- Eligible?
- —
No personal income docs; deal must DSCR.
Hard money
10% down · 12.0% · 12mo
- Down + closing
- —
- Monthly P&I
- —
- Monthly cashflow
- —
- DSCR
- —
- Eligible?
- —
Short-term bridge; refi at stabilization.
Rent comps 18 comps
| Address | Beds | Baths | Sqft | Rent | $/sqft | DOM | Units | Dist |
|---|---|---|---|---|---|---|---|---|
| 1852 Knox St Cincinnati, OH | 4.0 | 1.5 | 1747 | $1,850 | $1.06 | 23d | 1 | 0.64mi |
| 1740 Minion Ave Cincinnati, OH | 2.0 | 1.0 | 1320 | $1,200 | $0.91 | 23d | 1 | 0.70mi |
| 1620 Minion Ave Cincinnati, OH | 4.0 | 2.0 | 1845 | $1,550 | $0.84 | 20d | 1 | 0.88mi |
| 1311 Manss Ave Cincinnati, OH | 4.0 | 1.0 | 1409 | $1,295 | $0.92 | 4d | 1 | 0.93mi |
| 3666 Glenway Ave Cincinnati, OH | 3.0 | 1.0 | 1339 | $1,250 | $0.93 | 23d | 1 | 1.05mi |
| 3350 Cavanaugh Ave Cincinnati, OH | 4.0 | 2.5 | 2309 | $1,995 | $0.86 | 23d | 1 | 1.08mi |
| 1240 Rosemont Ave Cincinnati, OH | 2.0 | 1.0 | 1280 | $1,100 | $0.86 | 20d | 1 | 1.16mi |
| 1233 Dewey Ave Cincinnati, OH | 3.0 | 1.0 | 1411 | $1,375 | $0.97 | 4d | 1 | 1.17mi |
| 1214 Gilsey Ave Cincinnati, OH | 3.0 | 1.0 | 1300 | $1,300 | $1.00 | 20d | 1 | 1.17mi |
| 1214 Gilsey Ave Cincinnati, OH | 3.0 | 1.0 | 1300 | $1,300 | $1.00 | 23d | 1 | 1.17mi |
| 2621 Gehrum Ln Cincinnati, OH | 3.0 | 1.0 | 1373 | $1,850 | $1.35 | 23d | 1 | 1.18mi |
| 3157 Sunshine Ave Cincinnati, OH | 3.0 | 2.0 | 1894 | $1,825 | $0.96 | 2d | 1 | 1.28mi |
| 1014 Considine Ave Cincinnati, OH | 4.0 | 2.0 | 2200 | $2,000 | $0.91 | 1d | 1 | 1.32mi |
| 2706 E Tower Dr Cincinnati, OH | 1.0–3.0 | 1.0–2.0 | 951 | $1,520 | $1.60 | 1d | 61 | 1.41mi |
| 931 Olive Ave Cincinnati, OH | 3.0 | 1.0 | 1852 | $1,500 | $0.81 | 2d | 1 | 1.42mi |
| 916 Fairbanks Ave Cincinnati, OH | 4.0 | 1.0 | 1438 | $1,695 | $1.18 | 23d | 1 | 1.46mi |
| 862 Academy Ave Unit 2 Cincinnati, OH | 4.0 | 1.0 | 1627 | $1,450 | $0.89 | 16d | 1 | 1.49mi |
| 1723 Tuxworth Ave Cincinnati, OH | 3.0 | 2.0 | 1587 | $1,800 | $1.13 | 23d | 1 | 1.49mi |
Listing history 36 events
-
2026-06-18days on market $142,000 Active 52 DOM
-
2026-06-17days on market $142,000 Active 51 DOM
-
2026-06-16days on market $142,000 Active 50 DOM
-
2026-06-15days on market $142,000 Active 49 DOM
-
2026-06-13days on market $142,000 Active 47 DOM
-
2026-06-13days on market $142,000 Active 46 DOM
-
2026-06-09days on market $142,000 Active 43 DOM
-
2026-06-08days on market $142,000 Active 42 DOM
-
2026-06-07days on market $142,000 Active 41 DOM
-
2026-06-03days on market $142,000 Active 37 DOM
-
2026-06-02days on market $142,000 Active 36 DOM
-
2026-06-01days on market $142,000 Active 35 DOM
-
2026-05-31days on market $142,000 Active 34 DOM
-
2026-04-27$142,000 Active
-
2025-08-31historical 398-char remark
Show marketing remark (398 chars)
Solid duplex in South Fairmount, backing to Lick Run Greenway Project in an area of major redevelopment. Huge potential. Fully occupied, tenants on month to month leases. The first floor is a 1 bedroom one bath unit, and a 2 bedroom one bath unit occupies the second and third floors. Could be converted to a single family. Off Street parking. Separate water heaters and furnaces. Owner pays water.
-
2025-04-10status Active 398-char remark
Show marketing remark (398 chars)
Solid duplex in South Fairmount, backing to Lick Run Greenway Project in an area of major redevelopment. Huge potential. Fully occupied, tenants on month to month leases. The first floor is a 1 bedroom one bath unit, and a 2 bedroom one bath unit occupies the second and third floors. Could be converted to a single family. Off Street parking. Separate water heaters and furnaces. Owner pays water.
-
2025-04-03historical Contingency Pending 398-char remark
Show marketing remark (398 chars)
Solid duplex in South Fairmount, backing to Lick Run Greenway Project in an area of major redevelopment. Huge potential. Fully occupied, tenants on month to month leases. The first floor is a 1 bedroom one bath unit, and a 2 bedroom one bath unit occupies the second and third floors. Could be converted to a single family. Off Street parking. Separate water heaters and furnaces. Owner pays water.
-
2025-03-21$145,000 Active 398-char remark
Show marketing remark (398 chars)
Solid duplex in South Fairmount, backing to Lick Run Greenway Project in an area of major redevelopment. Huge potential. Fully occupied, tenants on month to month leases. The first floor is a 1 bedroom one bath unit, and a 2 bedroom one bath unit occupies the second and third floors. Could be converted to a single family. Off Street parking. Separate water heaters and furnaces. Owner pays water.
-
2024-10-31historical 360-char remark
Show marketing remark (360 chars)
Solid duplex in South Fairmount, backing to Lick Run Greenway Project in an area of major redevelopment. Huge potential. Fully occupied, tenants on month to month leases. The first floor is a 1 bedroom one bath unit, and a 2 bedroom one bath unit occupies the second and third floors. Off Street parking. Separate water heaters and furnaces. Owner pays water.
-
2024-10-09status Active 360-char remark
Show marketing remark (360 chars)
Solid duplex in South Fairmount, backing to Lick Run Greenway Project in an area of major redevelopment. Huge potential. Fully occupied, tenants on month to month leases. The first floor is a 1 bedroom one bath unit, and a 2 bedroom one bath unit occupies the second and third floors. Off Street parking. Separate water heaters and furnaces. Owner pays water.
-
2024-10-02historical Contingency Pending 360-char remark
Show marketing remark (360 chars)
Solid duplex in South Fairmount, backing to Lick Run Greenway Project in an area of major redevelopment. Huge potential. Fully occupied, tenants on month to month leases. The first floor is a 1 bedroom one bath unit, and a 2 bedroom one bath unit occupies the second and third floors. Off Street parking. Separate water heaters and furnaces. Owner pays water.
-
2024-04-19$149,900 Active 360-char remark
Show marketing remark (360 chars)
Solid duplex in South Fairmount, backing to Lick Run Greenway Project in an area of major redevelopment. Huge potential. Fully occupied, tenants on month to month leases. The first floor is a 1 bedroom one bath unit, and a 2 bedroom one bath unit occupies the second and third floors. Off Street parking. Separate water heaters and furnaces. Owner pays water.
-
2019-12-17historical
-
2019-10-16price $60,000
-
2019-10-16status Active
-
2019-08-30historical Contingency Pending
-
2019-07-22status Active
-
2019-07-18historical Contingency Pending
-
2019-06-27$69,900 Active
-
2017-10-05soldstatus $52,000
-
2004-09-18historical
-
2003-09-17$59,900
-
1997-07-31soldstatus $16,800
-
1997-07-31soldstatus $33,500
-
1997-07-30soldstatus $33,500
-
1997-02-03$34,500
ⓘ Source: listings_history table (triggers on properties + properties_extension) + one-shot
backfill from property_details.listing_events for pre-trigger history.
Tax reassessment forecast OH · Partial reset (capped growth)
- Current annual tax
- $1,260 · $105/mo
- Projected year-2 tax
- $1,737 · $145/mo
- Expected delta
- +$478/yr (+$40/mo · 37.9%)
ⓘ Screening estimate from a state-policy table — verify with the county assessor before closing.
Climate risk First Street
- Flood 10/10 Extreme FEMA zone X (unshaded) · 99% chance over 30 yrs
- Wildfire 1/10 Low
- Heat 4/10 Moderate 7 d/yr ≥103°F today · 19 d/yr by 30 yrs out
- Wind 2/10 Low 100% chance of damaging wind over 30 yrs
- Air quality 3/10 Moderate 3 unhealthy d/yr today · 5 by 30 yrs out
Nearby sold comps map
Loading sold comps map…
Walkable amenities ~0.75 mi
Loading nearby amenities…
Taxation est. · year 1
- Rental income
- $33,744
- − Mortgage interest
- −$7,954
- − Property taxes
- −$1,260
- − Insurance
- −$1,376
- − Repairs & maintenance
- −$2,700
- − Management
- −$2,700
- − Depreciation
- −$4,131
- Taxable income
- $13,624
- Est. tax owed @ 24.0%
- −$3,270
- After-tax cash flow
- $11,816/yr
For passive investors: Depreciation is non-cash, so a rental often shows a tax loss while cash-flowing — sheltering income. Rental losses are passive: they offset passive income freely, and up to $25,000/yr can offset ordinary (W-2) income if you actively participate and your MAGI is under $100k (phasing out to $0 by $150k); unused losses carry forward. On sale, claimed depreciation is recaptured at up to 25%, and gains may owe capital-gains tax (a 1031 exchange can defer both). Figures are a year-1 estimate at your 24.0% rate — not tax advice; consult a CPA.
Schools (NCES district)
- District
- Cincinnati Public Schools
- NCES district ID
- 3904375
- Math proficiency
- 25% ▼ -19.00%
- Reading proficiency
- 36% ▼ -14.00%
- Median HH income
- $35,743
- Composite
- 25.21/100
- National rank
- #7508
- State rank
- #581 of 656 in OH
Livability — Cincinnati
- Score
- 80/100
- State rank
- #130
- US rank
- #1856
Category grades
Schools grade is shown separately in the Schools card above.
Census & demographics
- Census place
- Cincinnati, OH
- County
- Hamilton County · 701,295 people
- City population
- 505,555
- Metro
- Cincinnati, OH-KY-IN
- Population (ZIP)
- 8,630
- Household income
- $27,852
- Rent vs Own
- Severe rent burden
- 857.0
Population outlook (Hamilton County) Hauer SSP2
- Today (2025)
- 826,054 people
- By 2030
- 830,947 · +0.6%
- By 2040
- 832,319 · +0.8%
- By 2050
- 822,428 · -0.4%
- By 2075
- 788,688 · -4.5%
- By 2100
- 710,674 · -14.0%
Race, ethnicity, and origin ACS 2023
- Neighborhood character
- Majority Black (63%)
- Race & ethnicity
- Black 63% White 27% Two or more races 7% Hispanic / Latino 3%
- Common ancestry
- Romanian 1%
- Foreign-born
- 2% · Canada
- Languages at home
- 97% English-only · Spanish 1% Other Indo-European 1%
Political lean MEDSL · Hamilton
- 2024 margin
- D (+14.9) · D 57.0% · R 42.1%
- 2008→2024 swing
- +7.9pp toward D · 2008: 7.0pp · 2024: 14.9pp
- All cycles
- 2024: D+14.9 2020: D+15.9 2016: D+9.5 2012: D+4.9 2008: D+7.0
Not yet ingested
- Civics
- —
Market trends
- HPI YoY
- ▲ 15.01%
- Current HPI
- 433.2346
- Rent YoY
- ▲ 8.09%
- Metro
- Cincinnati, OH-KY-IN
- State GDP YoY
- ▲ 1.98%
- F500 in state
- 48
Industry mix (Fortune 500 HQ in OH)
| Industry | F500 HQs | Revenue |
|---|---|---|
| Insurance | 3 | $145B |
|
||
| Industrial Machinery | 3 | $49B |
|
||
| Financial Services | 3 | $24B |
|
||
| Consumer Goods | 2 | $93B |
|
||
| Aerospace / Defense | 2 | $47B |
|
||
| Utilities | 2 | $33B |
|
||
Price history
+311.6% since first listed23 events — show timeline
- 2026-04-27 Listed $142,000 Cincy MLS
- 2025-08-31 Listing Removed — Cincy MLS
- 2025-04-10 Relisted — Cincy MLS
- 2025-04-03 Contingent — Cincy MLS
- 2025-03-21 Listed $145,000 Cincy MLS
- 2024-10-31 Listing Removed — Cincy MLS
- 2024-10-09 Relisted — Cincy MLS
- 2024-10-02 Contingent — Cincy MLS
- 2024-04-19 Listed $149,900 Cincy MLS
- 2019-12-17 Listing Removed — Cincy MLS
- 2019-10-16 Price Changed $60,000 Cincy MLS
- 2019-10-16 Relisted — Cincy MLS
- 2019-08-30 Contingent — Cincy MLS
- 2019-07-22 Relisted — Cincy MLS
- 2019-07-18 Contingent — Cincy MLS
- 2019-06-27 Listed $69,900 Cincy MLS
- 2017-10-05 Sold (Public Records) $52,000 Public Records
- 2004-09-18 Listing Removed — Cincy MLS
- 2003-09-17 Listed $59,900 Cincy MLS
- 1997-07-31 Sold (Public Records) $33,500 Public Records
- 1997-07-31 Sold (Public Records) $16,800 Public Records
- 1997-07-30 Sold (MLS) $33,500 Cincy MLS
- 1997-02-03 Listed $34,500 Cincy MLS
Property tax history
+13.8%/yrLatest (2025): $1,260 · +0.7% YoY. Source: county tax records.
Cash-flow waterfall
monthlySold comps — $/sqft
last 12 mo · ≤1 miLoading sold comps…