6960 W Peoria Ave W #156 · Peoria, AZ
Flood risk No data
- FEMA flood zone
- —
- Chance of flooding over 30 yrs
- —
- Est. flood insurance / yr
- —
Fire risk No data
- Est. fire insurance / yr
- —
Heat risk No data
- Hot days now (above threshold)
- —
- Hot days in 30 yrs
- —
Wind risk No data
- Chance of severe wind over 30 yrs
- —
Air-quality risk No data
- Unhealthy air days now
- —
- Unhealthy air days in 30 yrs
- —
Risk factors via First Street. Map © Google.
Why this score? — see what drove the B- grade
The composite is a weighted blend of 9 inputs, each scored 0–100. Each bar is that input's sub-score; the figure is the points it added to the 100-point composite (weight × sub-score).
- Cash flow +30.0/30.0
- 1% rule +10.0/10.0
- DSCR +10.0/10.0
- ARV discount +7.5/15.0
- Livability +3.8/5.0
- Schools +3.5/10.0
- Rent growth +2.7/5.0
- Condition / age +2.2/5.0
- Appreciation +0.0/10.0
$65,900
🖨 Deal sheet (PDF) 📄 Offer letter ✓ Due diligence
Listing remarks MLS
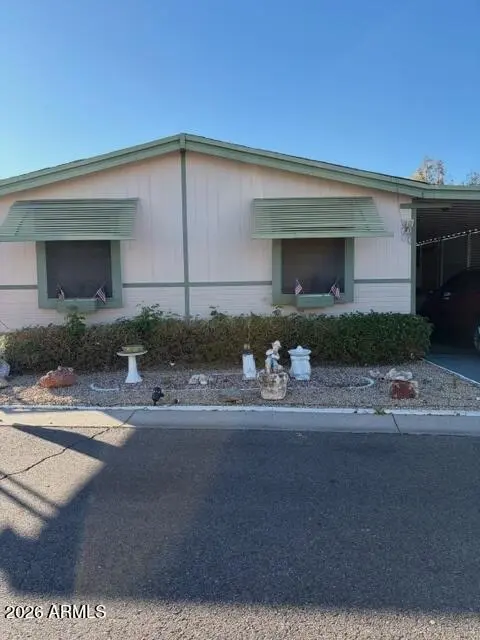
Discover Your New Home in Casa Del Sol East! Welcome to this charming 3-bedroom, 2-bathroom home, perfectly nestled in the vibrant, gated community of Casa Del Sol East. Step inside and you'll immediately notice the spacious living area with vaulted ceilings, creating an open and airy feel throughout. The laminate flooring beautifully complements the expansive floor plan, which includes a generously sized primary bathroom, a relaxing screened-in patio, a private white vinyl fenced yard, and ample storage space for all your needs. You'll also appreciate the peace of mind that comes with recent updates to the roof and heating system. Beyond your doorstep, Casa Del Sol East offers an array of fantastic amenities. Enjoy access to refreshing swimming pools, a fun billiards room, and more
Key facts
- Gated community
- Billiards room
- Screened in patio
Tags
Neighborhood map
What this means for you Summary
Snapshot
- This is a 3-bed/2.0-bath manufactured listed at $66k. Condition is rated fair.
Deal economics
- At list price, monthly cash flow is $1k ($13k/yr) — positive.
- The deal already cash-flows at list — no discount required.
- Meets the 1% rule at list price ($2k rent vs $66k).
- Recommended offer: $58k (12.0% below list) — sets the bar for market timing.
- Cap rate 26.2% vs local median 3.3% in Peoria — top-decile yield for the area; either an underpriced asset or a hidden risk that comps aren't pricing in. Stress-test before assuming the spread holds.
Location & tenants
- Location reads 76/100 on livability (#14 in AZ, #3,603 nationally) — a middle-class / working-renter tenant base. Strengths: housing A+, commute A, employment A; Watch: cost of living C-, amenities D, health & safety F.
- Peoria Unified School District (4237) (suburban): math 36% / reading 42% proficiency, ranked #64 of 249 in AZ (top 26%) — families likely to look elsewhere, expect single-tenant / working-renter base with shorter leases.
- Market conditions: Rents flat; 333 active listings in the ZIP; 36,011 units permitted in Maricopa County in 2024 (12,801 in 5+ unit buildings).
- This rent runs 35% of the median local income ($67k/yr) — at the standard rent-burdened threshold; future hikes will face affordability resistance.
Forward outlook
- Local home prices are declining (-3.0%/yr); year-one equity from $456 of loan paydown is wiped out by about $2k of value loss. Plan a longer hold.
- Maricopa County population projected at +38% by 2050 — long-run rental-demand tailwind backs the buy-and-hold thesis.
- At projected returns (-3.0% appreciation + 0.6% rent growth), your $18k cash investment doubles in ~2 years — after that, you're playing with house money.
Negotiation context
- It's been on market 159 days — a 12% lower offer ($58k) is reasonable based on typical stale-listing flexibility.
- 4 sale attempts since 2y ago with the ask held roughly flat each time — persistent listings suggest the price (not the market) is what's stuck; bring a comps-based counter.
Questions for the listing agent
- It's been on market 159 days. Have you received any prior offers? Is the seller open to a 12% concession, seller financing, or rate buy-down credit?
- Have any recent inspections been done? Can we get a copy of the seller's disclosures and any deferred-maintenance estimates?
- Why hasn't it sold? Are there any deal-killer items the seller is aware of (foundation, flood, title, zoning, code violations)?
- Is there a deadline driving the sale (1031 exchange, divorce, estate, relocation)? That informs how much negotiation room exists.
- Schools are B-rated — typically a magnet for longer-tenancy family renters. What's the average tenant stay here, and is there a school-zone premium baked into asking?
- What's the average days-on-market for RENTAL listings here right now (not sales)? A rising rental-DOM trend means longer vacancies and softer asking-rent achievability than the comps imply.
- What's the recent tenant-quality profile in this submarket — average credit score on applications, eviction rate, late-payment / NSF rate, and stable-employment percentage? A property-management company in the area should have these aggregated.
- How much new for-sale + rental construction is in the pipeline within 1–3 miles? Heavy new supply typically softens prices + rents 12–24 months out; constrained supply supports both.
Investment metrics
- 1% rule
- 2.97% ✓
- Cap rate
- 26.18%
- Cash-on-cash
- 71.04%
- DSCR
- 4.16
- GRM
- 2.8
CMA / ARV
No comps found within radius.
Projected returns pro-forma
-3.0% appreciation · 0.62% rent growth · sell at horizon
- IRR
- 67.9%
- Equity multiple
- 3.95×
- Total profit
- $54,341
- Equity at exit
- $9,826
- IRR
- 71.4%
- Equity multiple
- 7.45×
- Total profit
- $119,096
- Equity at exit
- $5,698
Cash invested: $18,452 (down + closing). Projections, not guarantees.
Landlord ↔ Tenant lean methodology
- Overall (STATE)
- 87 Strongly Landlord-Friendly
- State Arizona
- 87 Strongly Landlord-Friendly · R+3
- County
- — inherits STATE
- City
- — inherits STATE
ZIP-level market 85345
- Home prices YoY
- -19.8%
- Rents YoY
- 0.6%
- Active inventory
- 333
- Price-to-rent
- 2.8×
Monthly cashflow live
- Estimated rent
- $1,959 medium interval (Pro) →
- Mortgage (P&I)
- −$346
- Tax est. 1.5%
- −$82 /mo · $988/yr
- Insurance
- −$27
- HOA
- −$0
- Vacancy / Maint / Mgmt
- −$411
- Net cashflow
- $1,092
Break-even live
Sensitivity live
| Price | -10% $1,138 | -5% $1,115 | +0% $1,092 | +5% $1,070 | +10% $1,047 |
|---|---|---|---|---|---|
| Rent | -10% $938 | -5% $1,015 | +0% $1,092 | +5% $1,170 | +10% $1,247 |
| Rate | -1.0pp $1,126 | -0.5pp $1,109 | base $1,092 | +0.5pp $1,075 | +1.0pp $1,058 |
UW: 25.0% down · 7.5% · 30yr · 1.5% tax · 5.0% vac · 8.0% maint · 8.0% mgmt
Financing live
Cash to close
- Down payment
- $16,475
- Closing costs
- $1,977
- Reserves months
- —
- Total cash needed
- —
Loan-product check · same deal, 3 products live
Conventional
25% down · 7.5% · 30yr
- Down + closing
- —
- Monthly P&I
- —
- Monthly cashflow
- —
- DSCR
- —
- Eligible?
- —
Personal DTI + credit; lowest rate.
DSCR
20% down · 8.5% · 30yr
- Down + closing
- —
- Monthly P&I
- —
- Monthly cashflow
- —
- DSCR
- —
- Eligible?
- —
No personal income docs; deal must DSCR.
Hard money
10% down · 12.0% · 12mo
- Down + closing
- —
- Monthly P&I
- —
- Monthly cashflow
- —
- DSCR
- —
- Eligible?
- —
Short-term bridge; refi at stabilization.
Listing history 29 events
-
2026-06-21days on market $65,900 Active 159 DOM
-
2026-06-18days on market $65,900 Active 156 DOM
-
2026-06-17days on market $65,900 Active 155 DOM
-
2026-06-16days on market $65,900 Active 154 DOM
-
2026-06-15days on market $65,900 Active 153 DOM
-
2026-06-13days on market $65,900 Active 151 DOM
-
2026-06-13days on market $65,900 Active 150 DOM
-
2026-06-09days on market $65,900 Active 147 DOM
-
2026-06-08days on market $65,900 Active 146 DOM
-
2026-06-07days on market $65,900 Active 145 DOM
-
2026-06-04days on market $65,900 Active 142 DOM
-
2026-06-03days on market $65,900 Active 141 DOM
-
2026-06-02days on market $65,900 Active 140 DOM
-
2026-06-01days on market $65,900 Active 139 DOM
-
2026-05-31days on market $65,900 Active 138 DOM
-
2026-01-13historical
-
2026-01-12$65,900 Active 793-char remark
Show marketing remark (793 chars)
Discover Your New Home in Casa Del Sol East! Welcome to this charming 3-bedroom, 2-bathroom home, perfectly nestled in the vibrant, gated community of Casa Del Sol East. Step inside and you'll immediately notice the spacious living area with vaulted ceilings, creating an open and airy feel throughout. The laminate flooring beautifully complements the expansive floor plan, which includes a generously sized primary bathroom, a relaxing screened-in patio, a private white vinyl fenced yard, and ample storage space for all your needs. You'll also appreciate the peace of mind that comes with recent updates to the roof and heating system. Beyond your doorstep, Casa Del Sol East offers an array of fantastic amenities. Enjoy access to refreshing swimming pools, a fun billiards room, and more
-
2025-12-20price $65,900
-
2025-09-06price $70,000
-
2025-06-24$75,000 Active
-
2025-05-01historical
-
2025-03-12price $79,950
-
2025-01-09price $85,000
-
2024-11-25price $95,000
-
2024-10-03$99,999 Active
-
2024-09-28historical
-
2024-05-10price $110,000
-
2024-04-18price $125,000
-
2024-03-27$135,000 Active
ⓘ Source: listings_history table (triggers on properties + properties_extension) + one-shot
backfill from property_details.listing_events for pre-trigger history.
Nearby sold comps map
Loading sold comps map…
Walkable amenities ~0.75 mi
Loading nearby amenities…
Taxation est. · year 1
- Rental income
- $23,511
- − Mortgage interest
- −$3,691
- − Property taxes
- −$988
- − Insurance
- −$330
- − Repairs & maintenance
- −$1,881
- − Management
- −$1,881
- − Depreciation
- −$1,917
- Taxable income
- $12,822
- Est. tax owed @ 24.0%
- −$3,077
- After-tax cash flow
- $10,031/yr
For passive investors: Depreciation is non-cash, so a rental often shows a tax loss while cash-flowing — sheltering income. Rental losses are passive: they offset passive income freely, and up to $25,000/yr can offset ordinary (W-2) income if you actively participate and your MAGI is under $100k (phasing out to $0 by $150k); unused losses carry forward. On sale, claimed depreciation is recaptured at up to 25%, and gains may owe capital-gains tax (a 1031 exchange can defer both). Figures are a year-1 estimate at your 24.0% rate — not tax advice; consult a CPA.
Condition & rehab AI · 13 photos
This manufactured home has fair exterior condition with recent updates to the roof and heating system. It requires minor repairs and maintenance to improve its curb appeal and value.
Repairs flagged
- Minor exterior siding — Light wear and tear
- Minor interior paint — Some wear visible
Value-add opportunities
- Both paint exterior — Enhances curb appeal and value
- Both paint interior — Improves aesthetics and value
- Both update flooring — Modernizes and increases value
Renovation cost estimate screening
| Repair item | Severity | Est. cost |
|---|---|---|
| exterior siding · Light wear and tear | Minor | $500–3,000 |
| interior paint · Some wear visible | Minor | $500–3,000 |
| Total estimated repair cost · 2 items | $1,000–6,000 |
Value-add ROI direction
- Both paint exterior — Enhances curb appeal and value ↑
- Both paint interior — Improves aesthetics and value ↑
- Both update flooring — Modernizes and increases value ↑
ⓘ Cost ranges are severity-bucket heuristics (US national rule-of-thumb). Get contractor quotes + a written scope before underwriting a rehab budget.
Schools (NCES district)
- District
- Peoria Unified School District (4237)
- NCES district ID
- 0406250
- Math proficiency
- 36% ▼ -14.00%
- Reading proficiency
- 42% ▼ -8.00%
- Median HH income
- $60,171
- Composite
- 34.62/100
- National rank
- #5152
- State rank
- #64 of 249 in AZ
Livability — Peoria
- Score
- 76/100
- State rank
- #14
- US rank
- #3603
Category grades
Schools grade is shown separately in the Schools card above.
Census & demographics
- Census place
- Peoria, AZ
- County
- Maricopa County · 4,537,380 people
- City population
- 206,687
- Metro
- Phoenix-Mesa-Chandler, AZ
- Population (ZIP)
- 60,918
- Household income
- $67,380
- Rent vs Own
- Severe rent burden
- 1879.0
Population outlook (Maricopa County) Hauer SSP2
- Today (2025)
- 4,979,203 people
- By 2030
- 5,378,229 · +8.0%
- By 2040
- 6,156,598 · +23.6%
- By 2050
- 6,872,376 · +38.0%
- By 2075
- 8,401,270 · +68.7%
- By 2100
- 9,247,439 · +85.7%
Race, ethnicity, and origin ACS 2023
- Neighborhood character
- Diverse neighborhood (Simpson 0.62)
- Race & ethnicity
- White 51% Hispanic / Latino 34% Two or more races 14% Black 5% Asian 4% Native American 2%
- Hispanic origin (detail)
- Mexican 29%
- Common ancestry
- Romanian 2% Italian 2% Slovak 1%
- Foreign-born
- 13% · Canada, Vietnam
- Languages at home
- 76% English-only · Spanish 18% Other Indo-European 1% Vietnamese 1%
Political lean MEDSL · Maricopa
- 2024 margin
- Toss-up / Even · D 47.7% · R 51.2% · Other 1.1%
- 2008→2024 swing
- +7.1pp toward D · 2008: -10.6pp · 2024: -3.5pp
- All cycles
- 2024: R+3.5 2020: D+2.2 2016: R+3.5 2012: R+12.0 2008: R+10.6
Not yet ingested
- Civics
- —
Market trends
- HPI YoY
- ▼ -80.77%
- Current HPI
- 328.1069
- Rent YoY
- ▲ 0.62%
- Metro
- Phoenix-Mesa-Chandler, AZ
- State GDP YoY
- ▲ 4.54%
- F500 in state
- 20
Industry mix (Fortune 500 HQ in AZ)
| Industry | F500 HQs | Revenue |
|---|---|---|
| Technology | 2 | $13B |
|
||
| Mining / Metals | 1 | $23B |
|
||
| Environmental Services | 1 | $16B |
|
||
| Metals / Steel | 1 | $14B |
|
||
| Technology Distribution | 1 | $9B |
|
||
| Homebuilding | 1 | $8B |
|
||
Price history
-51.2% since first listed14 events — show timeline
- 2026-01-13 Listing Removed — ARMLS
- 2026-01-12 Listed $65,900 ARMLS
- 2025-12-20 Price Changed $65,900 ARMLS
- 2025-09-06 Price Changed $70,000 ARMLS
- 2025-06-24 Listed $75,000 ARMLS
- 2025-05-01 Listing Removed — ARMLS
- 2025-03-12 Price Changed $79,950 ARMLS
- 2025-01-09 Price Changed $85,000 ARMLS
- 2024-11-25 Price Changed $95,000 ARMLS
- 2024-10-03 Listed $99,999 ARMLS
- 2024-09-28 Listing Removed — ARMLS
- 2024-05-10 Price Changed $110,000 ARMLS
- 2024-04-18 Price Changed $125,000 ARMLS
- 2024-03-27 Listed $135,000 ARMLS
Cash-flow waterfall
monthlySold comps — $/sqft
last 12 mo · ≤1 miLoading sold comps…