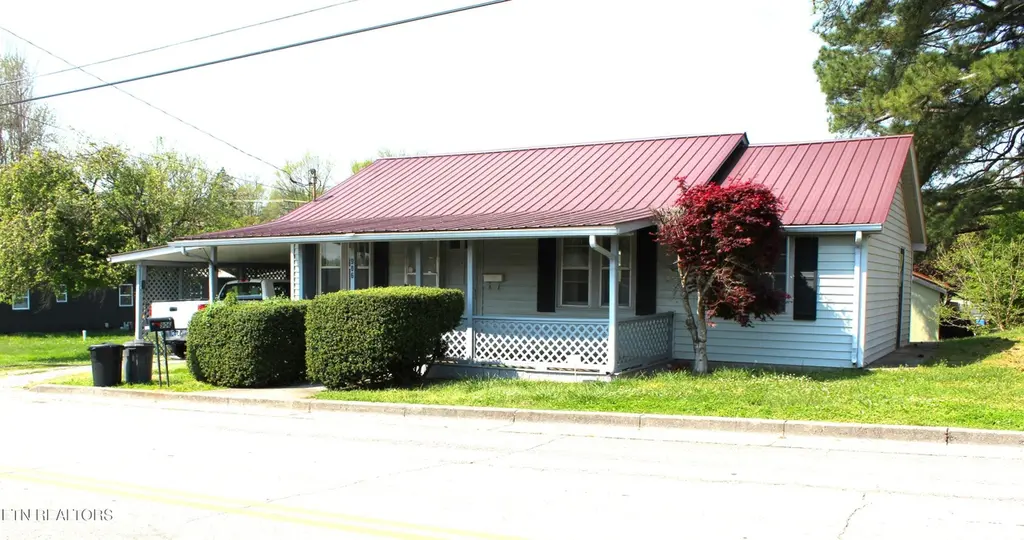
906 Cannon Ave · Sweetwater, TN
Flood risk 1/10 · Minimal
- FEMA flood zone
- X (unshaded)
- Chance of flooding over 30 yrs
- 0.0%
- Est. flood insurance / yr
- $507 – $1,088
Fire risk 4/10 · Minor
- Est. fire insurance / yr
- $949 – $1,763
Heat risk 6/10 · Moderate
- Hot days now (above 104°F)
- 7 days/yr
- Hot days in 30 yrs
- 22 days/yr
Wind risk 2/10 · Minimal
- Chance of severe wind over 30 yrs
- 1.0%
Air-quality risk 3/10 · Minor
- Unhealthy air days now
- 2 days/yr
- Unhealthy air days in 30 yrs
- 2 days/yr
Risk factors via First Street. Map © Google.
Why this score? — see what drove the D grade
The composite is a weighted blend of 9 inputs, each scored 0–100. Each bar is that input's sub-score; the figure is the points it added to the 100-point composite (weight × sub-score).
- Cash flow +16.6/30.0
- ARV discount +7.5/15.0
- DSCR +5.1/10.0
- 1% rule +3.4/10.0
- Livability +3.3/5.0
- Rent growth +2.5/5.0
- Condition / age +2.5/5.0
- Schools +2.0/10.0
- Appreciation +0.0/10.0
$131,000
🖨 Deal sheet (PDF) 📄 Offer letter ✓ Due diligence
Listing remarks MLS
Foreclosure. As is. Great investment property or starter home. Large front porch. Needs TLC and updating. Buyer/buyer s agent to confirm all information.
Key facts
- Covered front porch
- New metal roof
- 3,485 sq ft lot
Tags
Property features AI
Exterior
- Parking: Attached carport (1 space); Off-street parking on main level
- Utilities: Public sewer
- Home design: Detached property; Single-story (entry at main level)
- Construction: Frame and other construction materials; Built area: 858 (per tax records); Crawl space foundation
- Exterior features: Irregular, level lot; City view; Sidewalks
Interior
- Kitchen: Eat-in kitchen
- Flooring: Laminate flooring; Vinyl flooring
- Bathrooms: 1 full bathroom
- Heating & cooling: Central heating (natural gas and electric); Central cooling; Ceiling fan(s)
- Interior features: Eat-in kitchen; Total of 5 rooms
Neighborhood map
What this means for you Summary
Snapshot
- This is a 2-bed/1.0-bath single-family listed at $131k.
Deal economics
- At list price, monthly cash flow is $78 ($941/yr) — positive.
- The deal already cash-flows at list — no discount required.
- To meet the 1% rule (rent ≥ 1% of price), the offer needs to be $110k (16.2% below list).
- Recommended offer: $110k (16.2% below list) — sets the bar for 1% rule.
- Cap rate 7.0% vs local median 4.1% in Sweetwater — top-decile yield for the area; either an underpriced asset or a hidden risk that comps aren't pricing in. Stress-test before assuming the spread holds.
Location & tenants
- Location reads 66/100 on livability (#134 in TN) — a middle-class / working-renter tenant base. Strengths: cost of living A+, housing A+; Watch: health & safety C-, amenities F, commute F.
- Sweetwater (rural): math 25% / reading 24% proficiency, ranked #94 of 139 in TN (top 68%) — low school quality limits family demand, transient renter base, plan for 1-2y turnover; 61% free/reduced lunch — lower-income household profile, screen leases tightly.
- Zoned schools: Sweetwater Elementary (math 40% / reading 35%, grade F, #269 of 952 statewide, top 28%, 299 students, 0% FRL); Sweetwater Jr High School (math 11% / reading 18%, grade F, #231 of 333 statewide, top 70%, 322 students, 0% FRL) — zoned schools average 0% FRL vs 61% district-wide (61 pts lower); this property's tenant base skews higher-income than the district average.
- Market conditions: 142 active listings in the ZIP; 157 units permitted in Monroe County in 2024 (0 in 5+ unit buildings).
Forward outlook
- Local home prices are declining (-3.0%/yr); year-one equity from $906 of loan paydown is wiped out by about $4k of value loss. Plan a longer hold.
Negotiation context
- It's been on market 75 days — a 6% lower offer ($123k) is reasonable based on typical stale-listing flexibility.
- 3 sale attempts since 16y ago; this cycle's ask has dropped $8k (6%) from the opening price — seller is motivated, your offer sets the floor, not the list.
- Current owner paid $16k; list at $131k implies a 719% gain — meaningful room to come down on a strong offer.
Risks & watch-outs
- Watch-outs: built in 1950 — expect roof / HVAC / electrical / plumbing capex.
- Climate carrying-cost: extreme-heat days projected 7→22/yr by 2055 (HVAC capex compounding) — expect insurance premiums to compound above CPI over the hold.
Questions for the listing agent
- It's been on market 75 days. Have you received any prior offers? Is the seller open to a 16% concession, seller financing, or rate buy-down credit?
- Built in 1950 — when were the roof, HVAC, electrical panel, plumbing, and water heater last replaced?
- Why hasn't it sold? Are there any deal-killer items the seller is aware of (foundation, flood, title, zoning, code violations)?
- Is there a deadline driving the sale (1031 exchange, divorce, estate, relocation)? That informs how much negotiation room exists.
- Schools are F-rated, which usually means shorter tenancies and higher turnover. Who's the typical renter profile here, and what's been the actual vacancy rate?
- The area grade is low — what's the realistic commute time and amenity access for the typical tenant pool here? Any planned neighborhood developments (good or bad) we should know about?
- What's the average days-on-market for RENTAL listings here right now (not sales)? A rising rental-DOM trend means longer vacancies and softer asking-rent achievability than the comps imply.
- What's the recent tenant-quality profile in this submarket — average credit score on applications, eviction rate, late-payment / NSF rate, and stable-employment percentage? A property-management company in the area should have these aggregated.
- How much new for-sale + rental construction is in the pipeline within 1–3 miles? Heavy new supply typically softens prices + rents 12–24 months out; constrained supply supports both.
Investment metrics
- 1% rule
- 0.84% ✗
- Cap rate
- 7.01%
- Cash-on-cash
- 2.57%
- DSCR
- 1.11
- GRM
- 9.9
CMA / ARV
No comps found within radius.
Projected returns pro-forma
-3.0% appreciation · 3.0% rent growth · sell at horizon
- IRR
- -12.3%
- Equity multiple
- 0.56×
- Total profit
- $-16,288
- Equity at exit
- $19,533
- IRR
- -3.3%
- Equity multiple
- 0.78×
- Total profit
- $-7,977
- Equity at exit
- $11,326
Cash invested: $36,680 (down + closing). Projections, not guarantees.
Landlord ↔ Tenant lean methodology
- Overall (STATE)
- 87 Strongly Landlord-Friendly
- State Tennessee
- 87 Strongly Landlord-Friendly · R+13
- County
- — inherits STATE
- City
- — inherits STATE
ZIP-level market 37874
- Home prices YoY
- -5.4%
- Active inventory
- 142
- Price-to-rent
- 9.9×
Monthly cashflow live
- Estimated rent
- $1,097 medium interval (Pro) →
- Mortgage (P&I)
- −$687
- Tax from tax record
- −$47 /mo · $563/yr
- Insurance
- −$55
- HOA
- −$0
- Vacancy / Maint / Mgmt
- −$230
- Net cashflow
- $78
Break-even live
Sensitivity live
| Price | -10% $153 | -5% $115 | +0% $78 | +5% $41 | +10% $4 |
|---|---|---|---|---|---|
| Rent | -10% $-8 | -5% $35 | +0% $78 | +5% $122 | +10% $165 |
| Rate | -1.0pp $144 | -0.5pp $112 | base $78 | +0.5pp $44 | +1.0pp $10 |
UW: 25.0% down · 7.5% · 30yr · 1.5% tax · 5.0% vac · 8.0% maint · 8.0% mgmt
Financing live
Cash to close
- Down payment
- $32,750
- Closing costs
- $3,930
- Reserves months
- —
- Total cash needed
- —
Loan-product check · same deal, 3 products live
Conventional
25% down · 7.5% · 30yr
- Down + closing
- —
- Monthly P&I
- —
- Monthly cashflow
- —
- DSCR
- —
- Eligible?
- —
Personal DTI + credit; lowest rate.
DSCR
20% down · 8.5% · 30yr
- Down + closing
- —
- Monthly P&I
- —
- Monthly cashflow
- —
- DSCR
- —
- Eligible?
- —
No personal income docs; deal must DSCR.
Hard money
10% down · 12.0% · 12mo
- Down + closing
- —
- Monthly P&I
- —
- Monthly cashflow
- —
- DSCR
- —
- Eligible?
- —
Short-term bridge; refi at stabilization.
Listing history 23 events
-
2026-06-21days on market $131,000 Active 75 DOM
-
2026-06-21days on market $131,000 Active 74 DOM
-
2026-06-18days on market $131,000 Active 72 DOM
-
2026-06-17days on market $131,000 Active 71 DOM
-
2026-06-16days on market $131,000 Active 70 DOM
-
2026-06-15days on market $131,000 Active 69 DOM
-
2026-06-13days on market $131,000 Active 67 DOM
-
2026-06-12days on market $131,000 Active 66 DOM
-
2026-06-09days on market $131,000 Active 63 DOM
-
2026-06-08days on market $131,000 Active 62 DOM
-
2026-06-08days on market $131,000 Active 61 DOM
-
2026-06-07days on market $131,000 Active 60 DOM
-
2026-06-03days on market $131,000 Active 57 DOM
-
2026-06-02days on market $131,000 Active 56 DOM
-
2026-06-01days on market $131,000 Active 55 DOM
-
2026-05-31days on market $131,000 Active 54 DOM
-
2026-05-06status Active
-
2026-04-25historical Pending - Continue to Show
-
2026-04-07$139,000 Active
-
2010-08-18soldstatus $16,000 153-char remark
Show marketing remark (153 chars)
Foreclosure. As is. Great investment property or starter home. Large front porch. Needs TLC and updating. Buyer/buyer s agent to confirm all information.
-
2010-07-26$24,900 153-char remark
Show marketing remark (153 chars)
Foreclosure. As is. Great investment property or starter home. Large front porch. Needs TLC and updating. Buyer/buyer s agent to confirm all information.
-
2002-07-12soldstatus $10,500
-
1994-08-16soldstatus $11,326
ⓘ Source: listings_history table (triggers on properties + properties_extension) + one-shot
backfill from property_details.listing_events for pre-trigger history.
Tax reassessment forecast TN · Resets to sale price
- Current annual tax
- $563 · $47/mo
- Projected year-2 tax
- $930 · $78/mo
- Expected delta
- +$367/yr (+$31/mo · 65.1%)
ⓘ Screening estimate from a state-policy table — verify with the county assessor before closing.
Climate risk First Street
- Flood 1/10 Low FEMA zone X (unshaded) · 0% chance over 30 yrs
- Wildfire 4/10 Moderate
- Heat 6/10 Major 7 d/yr ≥104°F today · 22 d/yr by 30 yrs out
- Wind 2/10 Low 100% chance of damaging wind over 30 yrs
- Air quality 3/10 Moderate 2 unhealthy d/yr today · 2 by 30 yrs out
Nearby sold comps map
Loading sold comps map…
Walkable amenities ~0.75 mi
Loading nearby amenities…
Taxation est. · year 1
- Rental income
- $13,169
- − Mortgage interest
- −$7,338
- − Property taxes
- −$563
- − Insurance
- −$655
- − Repairs & maintenance
- −$1,053
- − Management
- −$1,053
- − Depreciation
- −$3,811
- Taxable loss
- −$1,306
- Est. tax savings @ 24.0%
- +$313
- After-tax cash flow
- $1,254/yr
For passive investors: Depreciation is non-cash, so a rental often shows a tax loss while cash-flowing — sheltering income. Rental losses are passive: they offset passive income freely, and up to $25,000/yr can offset ordinary (W-2) income if you actively participate and your MAGI is under $100k (phasing out to $0 by $150k); unused losses carry forward. On sale, claimed depreciation is recaptured at up to 25%, and gains may owe capital-gains tax (a 1031 exchange can defer both). Figures are a year-1 estimate at your 24.0% rate — not tax advice; consult a CPA.
Schools (NCES district)
- District
- Sweetwater
- NCES district ID
- 4704050
- Math proficiency
- 25% ▼ -9.00%
- Reading proficiency
- 24% ▼ -4.00%
- Median HH income
- $36,993
- Composite
- 20.41/100
- National rank
- #8586
- State rank
- #94 of 139 in TN
Livability — Sweetwater
- Score
- 66/100
- State rank
- #134
- US rank
- #12256
Category grades
Schools grade is shown separately in the Schools card above.
Census & demographics
- Census place
- Sweetwater, TN
- City population
- 16,640
- Population (ZIP)
- 16,640
Population outlook (Monroe County) Hauer SSP2
- Today (2025)
- 47,571 people
- By 2030
- 48,155 · +1.2%
- By 2040
- 48,772 · +2.5%
- By 2050
- 48,698 · +2.4%
- By 2075
- 48,558 · +2.1%
- By 2100
- 47,543 · -0.1%
Race, ethnicity, and origin ACS 2023
- Neighborhood character
- Predominantly White (84%)
- Race & ethnicity
- White 84% Hispanic / Latino 7% Two or more races 7% Black 2%
- Hispanic origin (detail)
- Mexican 6%
- Common ancestry
- Italian 3% Iranian 2% Lithuanian 2%
- Foreign-born
- 3% · Canada, Jamaica, China
- Languages at home
- 94% English-only · Spanish 5%
Political lean MEDSL · Monroe
- 2024 margin
- Solid R (+66.8) · D 16.2% · R 83.0%
- 2008→2024 swing
- -28.5pp toward R · 2008: -38.3pp · 2024: -66.8pp
- All cycles
- 2024: R+66.8 2020: R+62.6 2016: R+59.7 2012: R+45.0 2008: R+38.3
Not yet ingested
- Civics
- —
Market trends
- HPI YoY
- ▼ -19.36%
- Current HPI
- 336.2084
- Rent YoY
- —
- Metro
- —
- State GDP YoY
- ▲ 2.78%
- F500 in state
- 22
Industry mix (Fortune 500 HQ in TN)
| Industry | F500 HQs | Revenue |
|---|---|---|
| Healthcare | 3 | $91B |
|
||
| Retail | 3 | $72B |
|
||
| Transportation / Logistics | 1 | $88B |
|
||
| Paper / Packaging | 1 | $19B |
|
||
| Insurance | 1 | $13B |
|
||
| Energy | 1 | $12B |
|
||
Price history
+1127.3% since first listed7 events — show timeline
- 2026-05-06 Relisted — Knoxville MLS
- 2026-04-25 Contingent — Knoxville MLS
- 2026-04-07 Listed $139,000 Knoxville MLS
- 2010-08-18 Sold (MLS) $16,000 Knoxville MLS
- 2010-07-26 Listed $24,900 Knoxville MLS
- 2002-07-12 Sold (Public Records) $10,500 Public Records
- 1994-08-16 Sold (Public Records) $11,326 Public Records
Property tax history
+4.3%/yrLatest (2025): $563 · +0.1% YoY. Source: county tax records.
Cash-flow waterfall
monthlySold comps — $/sqft
last 12 mo · ≤1 miLoading sold comps…