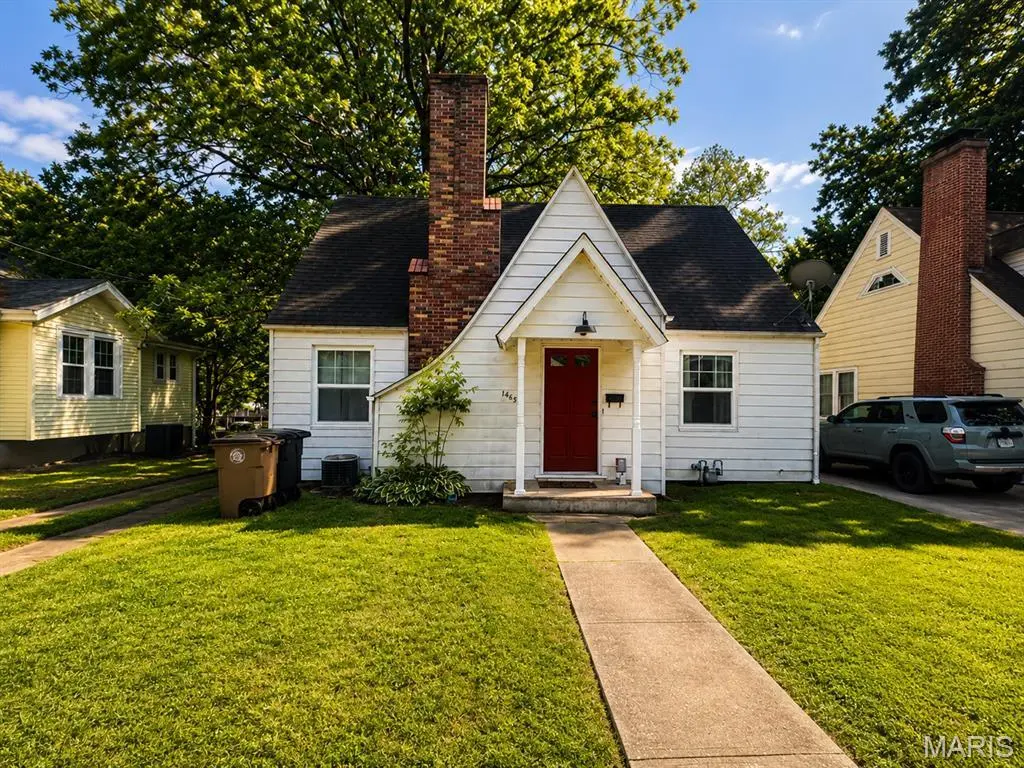
1465 Rose St · Cape Girardeau, MO
Flood risk 1/10 · Minimal
- FEMA flood zone
- X (unshaded)
- Chance of flooding over 30 yrs
- 0.0%
- Est. flood insurance / yr
- $473 – $860
Fire risk 1/10 · Minimal
- Est. fire insurance / yr
- $1,054 – $1,958
Heat risk 5/10 · Moderate
- Hot days now (above 108°F)
- 7 days/yr
- Hot days in 30 yrs
- 21 days/yr
Wind risk 2/10 · Minimal
- Chance of severe wind over 30 yrs
- 3.0%
Air-quality risk 2/10 · Minimal
- Unhealthy air days now
- 0 days/yr
- Unhealthy air days in 30 yrs
- 2 days/yr
Risk factors via First Street. Map © Google.
Why this score? — see what drove the D+ grade
The composite is a weighted blend of 9 inputs, each scored 0–100. Each bar is that input's sub-score; the figure is the points it added to the 100-point composite (weight × sub-score).
- Cash flow +15.0/30.0
- ARV discount +15.0/15.0
- DSCR +4.6/10.0
- Rent growth +3.3/5.0
- Livability +3.2/5.0
- Schools +3.1/10.0
- 1% rule +3.0/10.0
- Condition / age +2.5/5.0
- Appreciation +0.0/10.0
$180,000
🖨 Deal sheet 📄 Offer letter ✓ Due diligence
Listing remarks MLS
Catch A Catfish Game From the Backyard. Charming 1.5 story home located near city park. This home features hardwood flooring. The kitchen has breakfast bar and eat in area with built in bench. Large living room: upstairs are two large bedroom with half bath. Basement partially finished with possible sleeping areas or office setting and full bath.
Key facts
- 6,882 sq ft lot
- Built 1942
- Listed 3 days
Property features AI
Exterior
- Utilities: Public water; Public sewer; 220-volt electric service; Cable available
- Home design: Single family residence; One and one-half levels; Residential property
- Construction: Vinyl siding
- Exterior features: Front yard; Back yard
Interior
- Kitchen: Kitchen on main level
- Bedrooms: 3 bedrooms total (1 on main level, 2 on upper level)
- Bathrooms: 2 full bathrooms; 1 half bathroom; Main level full bathroom; Upper level half bathroom; Lower level full bathroom (basement)
- Heating & cooling: Natural gas heating; Central air conditioning; Electric cooling; Ceiling fans
- Interior features: Living room with fireplace; Partially finished basement with sleeping area and bathroom; 9 total rooms
Neighborhood map
What this means for you Summary
Snapshot
- This is a 3-bed/2.0-bath single-family listed at $180k.
Deal economics
- At list price, monthly cash flow is $55 ($662/yr) — positive.
- The deal already cash-flows at list — no discount required.
- To meet the 1% rule (rent ≥ 1% of price), the offer needs to be $144k (20.1% below list).
- Recommended offer: $144k (20.1% below list) — sets the bar for 1% rule.
- Cap rate 6.7% vs local median 3.9% in Cape Girardeau — top-decile yield for the area; either an underpriced asset or a hidden risk that comps aren't pricing in. Stress-test before assuming the spread holds.
Location & tenants
- Location reads 64/100 on livability (#297 in MO) — a middle-class / working-renter tenant base. Strengths: cost of living A+, housing A+; Watch: employment D+, crime F, amenities F.
- Cape Girardeau 63 (urban): math 33% / reading 42% proficiency, ranked #188 of 324 in MO (top 58%) — families likely to look elsewhere, expect single-tenant / working-renter base with shorter leases; 60% free/reduced lunch — lower-income household profile, screen leases tightly.
- Zoned schools: Franklin Elem. (math 32% / reading 37%, grade F, #676 of 1,115 statewide, top 66%, 217 students, 0% FRL); Central High (math 36% / reading 47%, grade F, #234 of 521 statewide, top 45%, 1,341 students, 0% FRL) — zoned schools average 0% FRL vs 60% district-wide (60 pts lower); this property's tenant base skews higher-income than the district average.
- Market conditions: Rents rising (+3.3%/yr); 326 active listings in the ZIP; 3 comparable units currently listed for rent nearby; rentals lingering (median 44d on market — plan ~5-8 weeks vacancy on turnover, expect pricing pressure); 100% of comp listings sitting > 30 days — soft ceiling on asking rent; 81 units permitted in Cape Girardeau County in 2024 (0 in 5+ unit buildings).
Forward outlook
- Local home prices are declining (-3.0%/yr); year-one equity from $1k of loan paydown is wiped out by about $5k of value loss. Plan a longer hold.
- Cape Girardeau County population projected at +17% by 2050 — long-run rental-demand tailwind backs the buy-and-hold thesis.
Negotiation context
- Only 3 days on market — expect competitive offers; lowballing is unlikely to land.
- 3 sale attempts since 6y ago with the ask held roughly flat each time — persistent listings suggest the price (not the market) is what's stuck; bring a comps-based counter.
Risks & watch-outs
- Watch-outs: built in 1942 — expect roof / HVAC / electrical / plumbing capex.
- Climate carrying-cost: extreme-heat days projected 7→21/yr by 2055 (HVAC capex compounding) — expect insurance premiums to compound above CPI over the hold.
Questions for the listing agent
- Built in 1942 — when were the roof, HVAC, electrical panel, plumbing, and water heater last replaced?
- Is there a deadline driving the sale (1031 exchange, divorce, estate, relocation)? That informs how much negotiation room exists.
- Crime grade is F in this area — have there been break-ins, vandalism, or insurance claims at this property in the last 3 years? What carrier currently insures it and at what premium?
- The area grade is low — what's the realistic commute time and amenity access for the typical tenant pool here? Any planned neighborhood developments (good or bad) we should know about?
- What's the average days-on-market for RENTAL listings here right now (not sales)? A rising rental-DOM trend means longer vacancies and softer asking-rent achievability than the comps imply.
- What's the recent tenant-quality profile in this submarket — average credit score on applications, eviction rate, late-payment / NSF rate, and stable-employment percentage? A property-management company in the area should have these aggregated.
- How much new for-sale + rental construction is in the pipeline within 1–3 miles? Heavy new supply typically softens prices + rents 12–24 months out; constrained supply supports both.
Investment metrics
- 1% rule
- 0.80% ✗
- Cap rate
- 6.66%
- Cash-on-cash
- 1.31%
- DSCR
- 1.06
- GRM
- 10.4
CMA / ARV
- ARV (on-the-fly)
- $222,992
- Comps found
- 12
Show comp detail 12 sales within ~0.75 mi
| Address | Dist | Beds/Ba | Sqft | Sold | Price | $/sf | Match |
|---|---|---|---|---|---|---|---|
| 1465 Rose St | 0.00mi | 3/2.5 | 1,916 (-4%) | 0mo | $180,000 | $94 | 91 |
| 381 N Park Ave | 0.26mi | 3/1.5 | 1,890 (-5%) | 1mo | $256,900 | $136 | 77 |
| 678 Highland Dr | 0.20mi | 3/2.0 | 2,231 (+12%) | 4mo | $225,000 | $101 | 67 |
| 1553 Whitener St | 0.61mi | 3/2.0 | 2,083 (+5%) | 1mo | $95,000 | $46 | 63 |
| 1814 Recardo Dr | 0.57mi | 3/2.5 | 1,920 (-4%) | 4mo | $214,900 | $112 | 62 |
| 1455 Whitener St | 0.60mi | 2/2.0 (-1) | 2,026 (+2%) | 6mo | $127,000 | $63 | 59 |
| 1210 Perryville Rd | 0.48mi | 3/2.5 | 1,778 (-11%) | 3mo | $213,000 | $120 | 55 |
| 1941 Benjamin Ct | 0.52mi | 3/2.5 | 1,769 (-11%) | 2mo | $229,900 | $130 | 54 |
| 1823 Lawanda Dr | 0.63mi | 3/2.0 | 2,216 (+11%) | 1mo | $220,000 | $99 | 50 |
| 456 Marie St | 0.71mi | 4/2.0 (+1) | 1,870 (-6%) | 4mo | $219,900 | $118 | 49 |
| 1826 Recardo Dr | 0.60mi | 4/2.5 (+1) | 1,804 (-9%) | 1mo | $189,900 | $105 | 49 |
| 1609 Themis St | 0.56mi | 3/2.0 | 1,694 (-15%) | 1mo | $229,900 | $136 | 48 |
Match score weights: distance 35% · size 25% · config 20% · recency 20%. Top-matched comps best support the ARV.
Projected returns pro-forma
-3.0% appreciation · 3.27% rent growth · sell at horizon
- IRR
- -14.0%
- Equity multiple
- 0.50×
- Total profit
- $-25,340
- Equity at exit
- $26,839
- IRR
- -4.9%
- Equity multiple
- 0.68×
- Total profit
- $-16,243
- Equity at exit
- $15,563
Cash invested: $50,400 (down + closing). Projections, not guarantees.
Landlord ↔ Tenant lean methodology
- Overall (STATE)
- 81 Strongly Landlord-Friendly
- State Missouri
- 81 Strongly Landlord-Friendly · R+10
- County
- — inherits STATE
- City
- — inherits STATE
ZIP-level market 63701
- Rents YoY
- 3.3%
- Active inventory
- 326
- Price-to-rent
- 10.4×
Monthly cashflow live
- Estimated rent
- $1,439 medium interval (Pro) →
- Mortgage (P&I)
- −$944
- Tax from tax record
- −$62 /mo · $748/yr
- Insurance
- −$75
- HOA
- −$0
- Vacancy / Maint / Mgmt
- −$302
- Net cashflow
- $55
Break-even live
UW: 25.0% down · 7.5% · 30yr · 1.5% tax · 5.0% vac · 8.0% maint · 8.0% mgmt
Financing live
Cash to close
- Down payment
- $45,000
- Closing costs
- $5,400
- Reserves months
- —
- Total cash needed
- —
Loan-product check · same deal, 3 products live
Conventional
25% down · 7.5% · 30yr
- Down + closing
- —
- Monthly P&I
- —
- Monthly cashflow
- —
- DSCR
- —
- Eligible?
- —
Personal DTI + credit; lowest rate.
DSCR
20% down · 8.5% · 30yr
- Down + closing
- —
- Monthly P&I
- —
- Monthly cashflow
- —
- DSCR
- —
- Eligible?
- —
No personal income docs; deal must DSCR.
Hard money
10% down · 12.0% · 12mo
- Down + closing
- —
- Monthly P&I
- —
- Monthly cashflow
- —
- DSCR
- —
- Eligible?
- —
Short-term bridge; refi at stabilization.
Rent comps 3 comps
| Address | Beds | Baths | Sqft | Rent | $/sqft | DOM | Units | Dist |
|---|---|---|---|---|---|---|---|---|
| 2581 Fairlane Dr Cape Girardeau, MO | 4.0 | 2.0 | 2223 | $2,250 | $1.01 | 43d | 1 | 1.14mi |
| 1710 N Sprigg St Cape Girardeau, MO | 2.0–4.0 | 2.0–4.0 | 1208 | $604 | $0.50 | 43d | 1 | 1.19mi |
| Cape Girardeau Cape Girardeau, MO | 1.0–3.0 | 1.0–2.0 | 931 | $1,000 | $1.07 | 43d | 7 | 1.21mi |
Listing history 9 events
-
2026-05-10status Pending
-
2026-05-07$180,000 Active
-
2023-08-03soldstatus Closed 353-char remark
Show marketing remark (353 chars)
Catch A Catfish Game From the Backyard. Charming 1.5 story home located near city park. This home features hardwood flooring. The kitchen has breakfast bar and eat in area with built in bench. Large living room: upstairs are two large bedroom with half bath. Basement partially finished with possible sleeping areas or office setting and full bath.
-
2023-07-03status Pending 353-char remark
Show marketing remark (353 chars)
Catch A Catfish Game From the Backyard. Charming 1.5 story home located near city park. This home features hardwood flooring. The kitchen has breakfast bar and eat in area with built in bench. Large living room: upstairs are two large bedroom with half bath. Basement partially finished with possible sleeping areas or office setting and full bath.
-
2023-06-27$158,900 Active 353-char remark
Show marketing remark (353 chars)
Catch A Catfish Game From the Backyard. Charming 1.5 story home located near city park. This home features hardwood flooring. The kitchen has breakfast bar and eat in area with built in bench. Large living room: upstairs are two large bedroom with half bath. Basement partially finished with possible sleeping areas or office setting and full bath.
-
2021-01-14soldstatus Closed 906-char remark
Show marketing remark (906 chars)
The living room has original hardwood flooring and a wood burning fireplace surrounded in brick and topped with a mantle. This room opens to the large dining room also with hardwood flooring. Continue to the kitchen with tile floor, new laminate countertop, and tile backsplash. NEW Refrigerator and Gas Stove Sept 2020. There is a large eat in area with a window overlooking the backyard. Also, on the main level is a bedroom with a large window overlooking the back yard and a full hall bathroom. The bath has dual sink vanity and a tiled floor. The second level has two bedrooms with hardwood flooring and a half bath. There is a large linen closet in the hall. The basement has a potential family room area, storage, laundry with sink area, and a full bath with a walk-in shower. This maintenance free aluminum sided home is located near Capaha Park (home of Cape Catfish Baseball) and SEMO University.
-
2020-12-11$129,900 906-char remark
Show marketing remark (906 chars)
The living room has original hardwood flooring and a wood burning fireplace surrounded in brick and topped with a mantle. This room opens to the large dining room also with hardwood flooring. Continue to the kitchen with tile floor, new laminate countertop, and tile backsplash. NEW Refrigerator and Gas Stove Sept 2020. There is a large eat in area with a window overlooking the backyard. Also, on the main level is a bedroom with a large window overlooking the back yard and a full hall bathroom. The bath has dual sink vanity and a tiled floor. The second level has two bedrooms with hardwood flooring and a half bath. There is a large linen closet in the hall. The basement has a potential family room area, storage, laundry with sink area, and a full bath with a walk-in shower. This maintenance free aluminum sided home is located near Capaha Park (home of Cape Catfish Baseball) and SEMO University.
-
2020-10-06price $119,999
-
2020-07-27price $124,900
ⓘ Source: listings_history table (triggers on properties + properties_extension) + one-shot
backfill from property_details.listing_events for pre-trigger history.
Tax reassessment forecast MO · Resets to sale price
- Current annual tax
- $748 · $62/mo
- Projected year-2 tax
- $1,746 · $146/mo
- Expected delta
- +$998/yr (+$83/mo · 133.3%)
ⓘ Screening estimate from a state-policy table — verify with the county assessor before closing.
Climate risk First Street
- Flood 1/10 Low FEMA zone X (unshaded) · 0% chance over 30 yrs
- Wildfire 1/10 Low
- Heat 5/10 Major 7 d/yr ≥108°F today · 21 d/yr by 30 yrs out
- Wind 2/10 Low 3% chance of damaging wind over 30 yrs
- Air quality 2/10 Low 0 unhealthy d/yr today · 2 by 30 yrs out
Nearby sold comps map
Loading sold comps map…
Walkable amenities ~0.75 mi
Loading nearby amenities…
Taxation est. · year 1
- Rental income
- $17,263
- − Mortgage interest
- −$10,083
- − Property taxes
- −$748
- − Insurance
- −$900
- − Repairs & maintenance
- −$1,381
- − Management
- −$1,381
- − Depreciation
- −$5,236
- Taxable loss
- −$2,467
- Est. tax savings @ 24.0%
- +$592
- After-tax cash flow
- $1,254/yr
For passive investors: Depreciation is non-cash, so a rental often shows a tax loss while cash-flowing — sheltering income. Rental losses are passive: they offset passive income freely, and up to $25,000/yr can offset ordinary (W-2) income if you actively participate and your MAGI is under $100k (phasing out to $0 by $150k); unused losses carry forward. On sale, claimed depreciation is recaptured at up to 25%, and gains may owe capital-gains tax (a 1031 exchange can defer both). Figures are a year-1 estimate at your 24.0% rate — not tax advice; consult a CPA.
Schools (NCES district)
- District
- Cape Girardeau 63
- NCES district ID
- 2907120
- Math proficiency
- 33% ▼ -6.00%
- Reading proficiency
- 42% ▼ -7.00%
- Median HH income
- $40,543
- Composite
- 31.49/100
- National rank
- #5974
- State rank
- #188 of 324 in MO
Livability — Cape Girardeau
- Score
- 64/100
- State rank
- #297
- US rank
- #13759
Category grades
Schools grade is shown separately in the Schools card above.
Census & demographics
- Census place
- Cape Girardeau, MO
- County
- Cape Girardeau County · 75,175 people
- City population
- 47,546
- Metro
- Cape Girardeau, MO-IL
- Population (ZIP)
- 39,345
- Household income
- $66,654
- Rent vs Own
- Severe rent burden
- 1300.0
Population outlook (Cape Girardeau County) Hauer SSP2
- Today (2025)
- 84,807 people
- By 2030
- 88,016 · +3.8%
- By 2040
- 93,914 · +10.7%
- By 2050
- 99,541 · +17.4%
- By 2075
- 114,527 · +35.0%
- By 2100
- 121,718 · +43.5%
Race, ethnicity, and origin ACS 2023
- Neighborhood character
- Predominantly White (79%)
- Race & ethnicity
- White 79% Black 12% Two or more races 4% Hispanic / Latino 3% Asian 3%
- Common ancestry
- Italian 2% Slovak 2% Lithuanian 2%
- Foreign-born
- 3% · China, Canada
- Languages at home
- 95% English-only · Spanish 1% Other Indo-European 1% Other Asian/Pacific 1%
Political lean MEDSL · Cape Girardeau
- 2024 margin
- Solid R (+46.5) · D 26.2% · R 72.7% · Other 1.1%
- 2008→2024 swing
- -12.9pp toward R · 2008: -33.6pp · 2024: -46.5pp
- All cycles
- 2024: R+46.5 2020: R+45.0 2016: R+50.1 2012: R+43.8 2008: R+33.6
Not yet ingested
- Civics
- —
Market trends
- HPI YoY
- ▼ -177.04%
- Current HPI
- 156.0433
- Rent YoY
- ▲ 3.27%
- Metro
- Cape Girardeau, MO-IL
- State GDP YoY
- ▲ 1.84%
- F500 in state
- 20
Industry mix (Fortune 500 HQ in MO)
| Industry | F500 HQs | Revenue |
|---|---|---|
| Healthcare | 1 | $163B |
|
||
| Insurance | 1 | $21B |
|
||
| Industrial Technology | 1 | $17B |
|
||
| Retail | 1 | $16B |
|
||
| Industrial Distribution | 1 | $10B |
|
||
| Utilities | 1 | $9B |
|
||
Price history
+44.1% since first listed9 events — show timeline
- 2026-05-10 Pending — MARIS as Distributed by MLS Grid
- 2026-05-07 Listed $180,000 MARIS as Distributed by MLS Grid
- 2023-08-03 Sold (MLS) — MARIS as Distributed by MLS Grid
- 2023-07-03 Pending — MARIS as Distributed by MLS Grid
- 2023-06-27 Listed $158,900 MARIS as Distributed by MLS Grid
- 2021-01-14 Sold (MLS) — MARIS as Distributed by MLS Grid
- 2020-12-11 Listed $129,900 MARIS as Distributed by MLS Grid
- 2020-10-06 Price Changed $119,999 MARIS as Distributed by MLS Grid
- 2020-07-27 Price Changed $124,900 MARIS as Distributed by MLS Grid
Property tax history
+1.2%/yrLatest (2025): $748 · +5.4% YoY. Source: county tax records.
Cash-flow waterfall
monthlySold comps — $/sqft
last 12 mo · ≤1 miLoading sold comps…