 Duplex
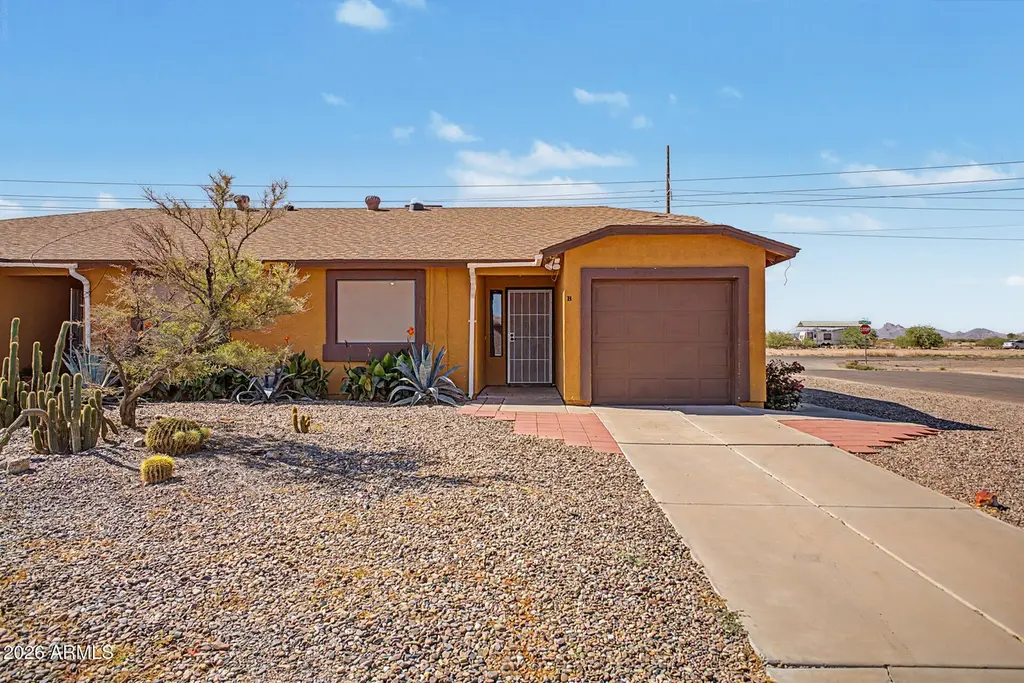
8391 W Mystery Dr · Arizona City, AZ
Flood risk 1/10 · Minimal
- FEMA flood zone
- X (unshaded)
- Chance of flooding over 30 yrs
- 0.0%
- Est. flood insurance / yr
- $507 – $1,088
Fire risk 5/10 · Moderate
- Est. fire insurance / yr
- $610 – $1,132
Heat risk 9/10 · Severe
- Hot days now (above 112°F)
- 7 days/yr
- Hot days in 30 yrs
- 19 days/yr
Wind risk 1/10 · Minimal
- Chance of severe wind over 30 yrs
- —
Air-quality risk 1/10 · Minimal
- Unhealthy air days now
- 0 days/yr
- Unhealthy air days in 30 yrs
- 0 days/yr
Risk factors via First Street. Map © Google.
Why this score? — see what drove the D- grade
The composite is a weighted blend of 9 inputs, each scored 0–100. Each bar is that input's sub-score; the figure is the points it added to the 100-point composite (weight × sub-score).
- Cash flow +12.3/30.0
- ARV discount +7.5/15.0
- DSCR +3.7/10.0
- Livability +2.8/5.0
- Rent growth +2.5/5.0
- Condition / age +2.5/5.0
- 1% rule +2.2/10.0
- Schools +1.5/10.0
- Appreciation +0.3/10.0
$359,999
🖨 Deal sheet (PDF) 📄 Offer letter ✓ Due diligence
Multi-family units
County records classify this as Multi-Family (2-4 Unit). Listing-text estimate: 2 units. confirmed
Listing remarks
Don't miss this great investment opportunity in Arizona City! Well-maintained duplex featuring two 3 bed/2 bath units, each with a 1-car garage and private yard. Major updates include a new roof (2023), exterior paint (2023), newer HVAC units (2019 & 2021), and updated hot water heaters (2024). Unit B features fresh interior paint, newer appliances, and owned solar. One unit is tenant-occupied with a lease in place through May 2027, providing immediate income stability. Both units offer covered patios with awnings. Ideal for investors seeking a low-maintenance, cash-flowing asset.
Key facts
- Exterior paint
- Covered patios
- Newer hvac units
Tags
Property features AI
Exterior
- Parking: 2 parking spaces total; 1 covered parking space; 1 open parking space; Garage door opener; On-street parking
- Utilities: Electricity from APS with solar; Public sewer; City water (city franchise)
- Home design: Fee simple ownership; One building
- Construction: Wood frame and stucco construction; Composition roof
- Exterior features: Asphalt road access; No pool
Interior
- Kitchen: Built-in electric oven
- Flooring: Tile flooring; Wood flooring
- Heating & cooling: Solar and electric heating; Central air; Ceiling fans
- Interior features: Built-in electric oven
Neighborhood map
What this means for you Summary
Snapshot
- This is a 2 × 3-bed/2-bath units multifamily listed at $360k.
Deal economics
- At list price, monthly cash flow is $-64 ($-765/yr) — negative. Per door: $-32/mo.
- To cash-flow at today's rent, offer at most $349k (3.1% below list).
- To meet the 1% rule (rent ≥ 1% of price), the offer needs to be $260k (27.7% below list).
- Recommended offer: $260k (27.7% below list) — sets the bar for 1% rule.
- Cap rate 6.1% vs local median 4.2% in Arizona City — top-decile yield for the area; either an underpriced asset or a hidden risk that comps aren't pricing in. Stress-test before assuming the spread holds.
Location & tenants
- Location reads 56/100 on livability (#246 in AZ) — a working-class tenant base; expect higher turnover. Strengths: cost of living A+, housing A+; Watch: health & safety D, crime D-, amenities F.
- Casa Grande Union High School District (4453) (suburban): math 14% / reading 21% proficiency, ranked #193 of 249 in AZ (top 78%) — low school quality limits family demand, transient renter base, plan for 1-2y turnover.
- Zoned schools: Arizona City Elementary School (math 6% / reading 15%, grade F, #993 of 1,109 statewide, top 91%, 744 students, 87% FRL); Casa Grande Union High School (math 18% / reading 25%, grade F, #217 of 381 statewide, top 57%, 2,132 students, 52% FRL).
- Market conditions: 311 active listings in the ZIP; 5 comparable units currently listed for rent nearby; rentals leasing fast (median 0d on market — plan ~1-2 weeks tenant-placement turnaround); 9,504 units permitted in Pinal County in 2024 (776 in 5+ unit buildings).
- At $2,604/mo this rent would consume 45% of the median local household income ($69k/yr) (locally 172% of renters already pay >50% of income on rent) — very limited rent-growth headroom before tenants either downsize or default.
Forward outlook
- Local home prices are declining (-3.0%/yr); year-one equity from $2k of loan paydown is wiped out by about $11k of value loss. Plan a longer hold.
Negotiation context
- It's been on market 60 days — a 3% lower offer ($349k) is reasonable based on typical stale-listing flexibility.
- 7 sale attempts since 21y ago with the ask held roughly flat each time — persistent listings suggest the price (not the market) is what's stuck; bring a comps-based counter.
- Current owner paid $42k; list at $360k implies a 757% gain — meaningful room to come down on a strong offer.
Risks & watch-outs
- Climate carrying-cost: moderate wildfire risk; extreme-heat days projected 7→19/yr by 2055 (HVAC capex compounding) — expect insurance premiums to compound above CPI over the hold.
Questions for the listing agent
- What do current leases actually rent for vs. the listed asking? Can we see a recent rent roll and the last 12 months of T-12 income?
- It's been on market 60 days. Have you received any prior offers? Is the seller open to a 28% concession, seller financing, or rate buy-down credit?
- Can we see the unit-by-unit rent roll, current vacancy, and any below-market leases? What's the average tenancy length?
- What capital expenditures (roof, boiler, parking lot, exteriors) have been made in the last 5 years, and what's planned in the next 2?
- Is there a deadline driving the sale (1031 exchange, divorce, estate, relocation)? That informs how much negotiation room exists.
- Schools are F-rated, which usually means shorter tenancies and higher turnover. Who's the typical renter profile here, and what's been the actual vacancy rate?
- Crime grade is D in this area — have there been break-ins, vandalism, or insurance claims at this property in the last 3 years? What carrier currently insures it and at what premium?
- The area grade is low — what's the realistic commute time and amenity access for the typical tenant pool here? Any planned neighborhood developments (good or bad) we should know about?
- What's the average days-on-market for RENTAL listings here right now (not sales)? A rising rental-DOM trend means longer vacancies and softer asking-rent achievability than the comps imply.
- What's the recent tenant-quality profile in this submarket — average credit score on applications, eviction rate, late-payment / NSF rate, and stable-employment percentage? A property-management company in the area should have these aggregated.
- How much new apartment / multifamily construction is in the pipeline within 1–3 miles? Heavy new supply (>2% of stock underway) typically softens rents 12–24 months out; light construction supports rent growth.
Investment metrics
- 1% rule
- 0.72% ✗
- Cap rate
- 6.08%
- Cash-on-cash
- -0.76%
- DSCR
- 0.97
- GRM
- 11.5
CMA / ARV
No comps found within radius.
Projected returns pro-forma
-3.0% appreciation · 3.0% rent growth · sell at horizon
- IRR
- -17.6%
- Equity multiple
- 0.38×
- Total profit
- $-62,579
- Equity at exit
- $53,677
- IRR
- -9.8%
- Equity multiple
- 0.40×
- Total profit
- $-60,475
- Equity at exit
- $31,126
Cash invested: $100,800 (down + closing). Projections, not guarantees.
Landlord ↔ Tenant lean methodology
- Overall (STATE)
- 87 Strongly Landlord-Friendly
- State Arizona
- 87 Strongly Landlord-Friendly · R+3
- County
- — inherits STATE
- City
- — inherits STATE
ZIP-level market 85123
- Home prices YoY
- -3.2%
- Active inventory
- 311
- Price-to-rent
- 23.0×
Monthly cashflow live
- Estimated rent
- $2,604 medium interval (Pro) →
- Mortgage (P&I)
- −$1,888
- Tax from tax record
- −$83 /mo · $996/yr
- Insurance
- −$150
- HOA
- −$0
- Vacancy / Maint / Mgmt
- −$547
- Net cashflow
- $-64
Break-even live
Sensitivity live
| Price | -10% $140 | -5% $38 | +0% $-64 | +5% $-166 | +10% $-267 |
|---|---|---|---|---|---|
| Rent | -10% $-269 | -5% $-167 | +0% $-64 | +5% $39 | +10% $142 |
| Rate | -1.0pp $118 | -0.5pp $28 | base $-64 | +0.5pp $-157 | +1.0pp $-252 |
2-unit breakdown (identical units grouped — click to expand)
| Units | Beds | Baths | Est. rent |
|---|---|---|---|
| 2× units | 3 | 2 | $2,604 |
| #1 | 3 | 2 | $1,302 |
| #2 | 3 | 2 | $1,302 |
| Total (2 units) | $2,604 | ||
UW: 25.0% down · 7.5% · 30yr · 1.5% tax · 5.0% vac · 8.0% maint · 8.0% mgmt
Financing live
Cash to close
- Down payment
- $90,000
- Closing costs
- $10,800
- Reserves months
- —
- Total cash needed
- —
Loan-product check · same deal, 3 products live
Conventional
25% down · 7.5% · 30yr
- Down + closing
- —
- Monthly P&I
- —
- Monthly cashflow
- —
- DSCR
- —
- Eligible?
- —
Personal DTI + credit; lowest rate.
DSCR
20% down · 8.5% · 30yr
- Down + closing
- —
- Monthly P&I
- —
- Monthly cashflow
- —
- DSCR
- —
- Eligible?
- —
No personal income docs; deal must DSCR.
Hard money
10% down · 12.0% · 12mo
- Down + closing
- —
- Monthly P&I
- —
- Monthly cashflow
- —
- DSCR
- —
- Eligible?
- —
Short-term bridge; refi at stabilization.
Rent comps 5 comps
| Address | Beds | Baths | Sqft | Rent | $/sqft | DOM | Units | Dist |
|---|---|---|---|---|---|---|---|---|
| 9088 W Rafael Dr Arizona City, AZ | 3.0 | 2.0 | 1336 | $1,550 | $1.16 | 0d | 1 | 0.54mi |
| 15310 S Kline Pl Arizona City, AZ | 3.0 | 2.5 | 1826 | $2,150 | $1.18 | 0d | 1 | 0.80mi |
| 15610 S Moon Valley Rd Arizona City, AZ | 3.0 | 2.0 | 1656 | $1,600 | $0.97 | 0d | 1 | 0.82mi |
| 15147 S Yava Rd Unit A Arizona City, AZ | 3.0 | 2.5 | 1422 | $1,450 | $1.02 | 22d | 1 | 1.06mi |
| 9301 W Century Dr Unit A (273) Arizona City, AZ | 3.0 | 2.0 | 1500 | $1,450 | $0.97 | 7d | 1 | 1.48mi |
Listing history 32 events
-
2026-06-21days on market $359,999 Active 60 DOM
-
2026-06-18days on market $359,999 Active 57 DOM
-
2026-06-17days on market $359,999 Active 56 DOM
-
2026-06-16days on market $359,999 Active 55 DOM
-
2026-06-15days on market $359,999 Active 54 DOM
-
2026-06-13days on market $359,999 Active 52 DOM
-
2026-06-13days on market $359,999 Active 51 DOM
-
2026-06-09days on market $359,999 Active 48 DOM
-
2026-06-08days on market $359,999 Active 47 DOM
-
2026-06-07days on market $359,999 Active 46 DOM
-
2026-06-04days on market $359,999 Active 43 DOM
-
2026-06-03days on market $359,999 Active 42 DOM
-
2026-06-02days on market $359,999 Active 41 DOM
-
2026-06-01days on market $359,999 Active 40 DOM
-
2026-05-31days on market $359,999 Active 39 DOM
-
2026-04-22$359,999 Active
-
2025-11-04historical
-
2025-11-04historical
-
2025-04-01$365,000 Active
-
2025-04-01$365,000 Active
-
2009-10-30soldstatus $42,000
-
2009-09-02historical
-
2009-05-25$47,900
-
2009-05-14historical
-
2009-03-16historical
-
2009-03-13$69,900
-
2008-10-08$72,900
-
2006-01-12soldstatus $190,000
-
2005-12-30soldstatus $190,000
-
2005-12-22historical
-
2005-08-26$190,000
-
2003-12-12soldstatus $130,800
ⓘ Source: listings_history table (triggers on properties + properties_extension) + one-shot
backfill from property_details.listing_events for pre-trigger history.
Tax reassessment forecast AZ · Resets to sale price
- Current annual tax
- $996 · $83/mo
- Projected year-2 tax
- $2,376 · $198/mo
- Expected delta
- +$1,380/yr (+$115/mo · 138.6%)
ⓘ Screening estimate from a state-policy table — verify with the county assessor before closing.
Climate risk First Street
- Flood 1/10 Low FEMA zone X (unshaded) · 0% chance over 30 yrs
- Wildfire 5/10 Major
- Heat 9/10 Extreme 7 d/yr ≥112°F today · 19 d/yr by 30 yrs out
- Wind 1/10 Low
- Air quality 1/10 Low 0 unhealthy d/yr today · 0 by 30 yrs out
Nearby sold comps map
Loading sold comps map…
Walkable amenities ~0.75 mi
Loading nearby amenities…
Taxation est. · year 1
- Rental income
- $31,248
- − Mortgage interest
- −$20,166
- − Property taxes
- −$996
- − Insurance
- −$1,800
- − Repairs & maintenance
- −$2,500
- − Management
- −$2,500
- − Depreciation
- −$10,473
- Taxable loss
- −$7,186
- Est. tax savings @ 24.0%
- +$1,725
- After-tax cash flow
- $960/yr
For passive investors: Depreciation is non-cash, so a rental often shows a tax loss while cash-flowing — sheltering income. Rental losses are passive: they offset passive income freely, and up to $25,000/yr can offset ordinary (W-2) income if you actively participate and your MAGI is under $100k (phasing out to $0 by $150k); unused losses carry forward. On sale, claimed depreciation is recaptured at up to 25%, and gains may owe capital-gains tax (a 1031 exchange can defer both). Figures are a year-1 estimate at your 24.0% rate — not tax advice; consult a CPA.
Schools (NCES district)
- District
- Casa Grande Union High School District (4453)
- NCES district ID
- 0401740
- Math proficiency
- 14% ▼ -15.00%
- Reading proficiency
- 21% ▼ -10.00%
- Median HH income
- $45,373
- Composite
- 15.38/100
- National rank
- #9319
- State rank
- #193 of 249 in AZ
Livability — Arizona City
- Score
- 56/100
- State rank
- #246
- US rank
- #22768
Category grades
Schools grade is shown separately in the Schools card above.
Census & demographics
- Census place
- Arizona City, AZ
- County
- Pinal County · 399,947 people
- City population
- 10,003
- Metro
- Phoenix-Mesa-Chandler, AZ
- Population (ZIP)
- 10,003
- Household income
- $69,137
- Rent vs Own
- Severe rent burden
- 172.0
Population outlook (Pinal County) Hauer SSP2
- Today (2025)
- 437,574 people
- By 2030
- 446,903 · +2.1%
- By 2040
- 452,589 · +3.4%
- By 2050
- 444,126 · +1.5%
- By 2075
- 430,300 · -1.7%
- By 2100
- 393,536 · -10.1%
Race, ethnicity, and origin ACS 2023
- Neighborhood character
- Majority White (60%)
- Race & ethnicity
- White 60% Hispanic / Latino 32% Two or more races 11% Black 3%
- Hispanic origin (detail)
- Mexican 23% Puerto Rican 6%
- Common ancestry
- Lithuanian 3% Italian 2% Scottish 2%
- Foreign-born
- 8% · Canada, Jamaica
- Languages at home
- 81% English-only · Spanish 19%
Political lean MEDSL · Pinal
- 2024 margin
- Strong R (+22.1) · D 38.5% · R 60.6%
- 2008→2024 swing
- -7.6pp toward R · 2008: -14.5pp · 2024: -22.1pp
- All cycles
- 2024: R+22.1 2020: R+17.3 2016: R+19.3 2012: R+17.1 2008: R+14.5
Not yet ingested
- Civics
- —
Market trends
- HPI YoY
- ▼ -9.30%
- Current HPI
- 283.5405
- Rent YoY
- —
- Metro
- Phoenix-Mesa-Chandler, AZ
- State GDP YoY
- ▲ 4.54%
- F500 in state
- 20
Industry mix (Fortune 500 HQ in AZ)
| Industry | F500 HQs | Revenue |
|---|---|---|
| Technology | 2 | $13B |
|
||
| Mining / Metals | 1 | $23B |
|
||
| Environmental Services | 1 | $16B |
|
||
| Metals / Steel | 1 | $14B |
|
||
| Technology Distribution | 1 | $9B |
|
||
| Homebuilding | 1 | $8B |
|
||
Price history
+175.2% since first listed17 events — show timeline
- 2026-04-22 Listed $359,999 ARMLS
- 2025-11-04 Listing Removed — ARMLS
- 2025-11-04 Listing Removed — MLSSAZ
- 2025-04-01 Listed $365,000 ARMLS
- 2025-04-01 Listed $365,000 MLSSAZ
- 2009-10-30 Sold (MLS) $42,000 ARMLS
- 2009-09-02 Listing Removed — ARMLS
- 2009-05-25 Listed $47,900 ARMLS
- 2009-05-14 Listing Removed — ARMLS
- 2009-03-16 Listing Removed — ARMLS
- 2009-03-13 Listed $69,900 ARMLS
- 2008-10-08 Listed $72,900 ARMLS
- 2006-01-12 Sold (Public Records) $190,000 Public Records
- 2005-12-30 Sold (MLS) $190,000 ARMLS
- 2005-12-22 Listing Removed — ARMLS
- 2005-08-26 Listed $190,000 ARMLS
- 2003-12-12 Sold (Public Records) $130,800 Public Records
Property tax history
-4.4%/yrLatest (2025): $996 · +4.5% YoY. Source: county tax records.
Cash-flow waterfall
monthlySold comps — $/sqft
last 12 mo · ≤1 miLoading sold comps…