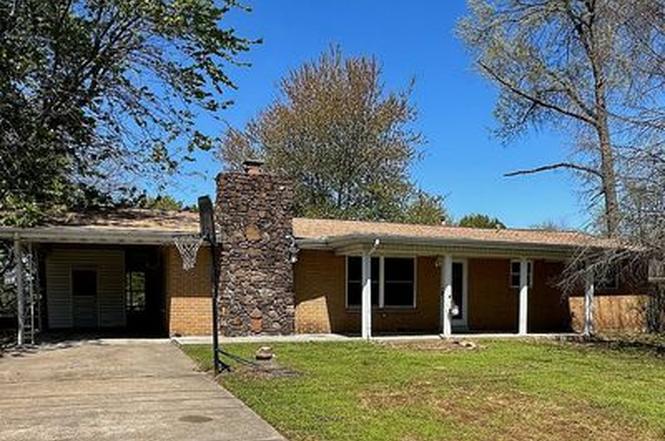
302 E Center St · Prairie Grove, AR
Flood risk 1/10 · Minimal
- FEMA flood zone
- X (unshaded)
- Chance of flooding over 30 yrs
- 0.0%
- Est. flood insurance / yr
- $507 – $1,088
Fire risk 5/10 · Moderate
- Est. fire insurance / yr
- $1,499 – $2,785
Heat risk 5/10 · Moderate
- Hot days now (above 105°F)
- 7 days/yr
- Hot days in 30 yrs
- 20 days/yr
Wind risk 2/10 · Minimal
- Chance of severe wind over 30 yrs
- 3.0%
Air-quality risk 2/10 · Minimal
- Unhealthy air days now
- 1 days/yr
- Unhealthy air days in 30 yrs
- 1 days/yr
Risk factors via First Street. Map © Google.
Why this score? — see what drove the D+ grade
The composite is a weighted blend of 9 inputs, each scored 0–100. Each bar is that input's sub-score; the figure is the points it added to the 100-point composite (weight × sub-score).
- ARV discount +15.0/15.0
- Cash flow +13.8/30.0
- DSCR +4.2/10.0
- Schools +3.6/10.0
- Livability +3.4/5.0
- 1% rule +3.3/10.0
- Rent growth +2.5/5.0
- Condition / age +2.5/5.0
- Appreciation +0.0/10.0
$219,000
🖨 Deal sheet 📄 Offer letter ✓ Due diligence
Listing remarks MLS
Brick home on large lot in established neighborhood near schools and shopping. Super large kitchen w/ lots of counter space! 2 living areas. One with fireplace. Many updates including new roof 12/16, paint, ceramic tile, paint & vinyl windows. Covered patio in back for entertaining! Backyard is fenced and has 2 outbuildings. Both are wired with electricity. Home was constructed in 1972.
Key facts
- Wired for workshop
- Separate living area
- Storage buildings
Tags
Neighborhood map
What this means for you Summary
Snapshot
- This is a 3-bed/1.5-bath single-family listed at $219k.
Deal economics
- At list price, monthly cash flow is $22 ($259/yr) — positive.
- The deal already cash-flows at list — no discount required.
- To meet the 1% rule (rent ≥ 1% of price), the offer needs to be $182k (16.8% below list).
- Recommended offer: $182k (16.8% below list) — sets the bar for 1% rule.
- Cap rate 6.4% vs local median 3.7% in Prairie Grove — top-decile yield for the area; either an underpriced asset or a hidden risk that comps aren't pricing in. Stress-test before assuming the spread holds.
Location & tenants
- Location reads 67/100 on livability (#99 in AR) — a middle-class / working-renter tenant base. Strengths: crime A+, cost of living A+, housing A+; Watch: amenities F, commute F, health & safety F.
- Prairie Grove School District (town): math 43% / reading 39% proficiency, ranked #50 of 238 in AR (top 21%) — families likely to look elsewhere, expect single-tenant / working-renter base with shorter leases.
- Market conditions: 283 active listings in the ZIP; 21 comparable units currently listed for rent nearby; rentals at typical pace (median 14d on market — plan ~3-4 weeks tenant-placement turnaround); 3,494 units permitted in Washington County in 2024 (1,497 in 5+ unit buildings).
- This rent runs 31% of the median local income ($71k/yr) — at the standard rent-burdened threshold; future hikes will face affordability resistance.
Forward outlook
- Local home prices are declining (-3.0%/yr); year-one equity from $2k of loan paydown is wiped out by about $7k of value loss. Plan a longer hold.
- Washington County population projected at +47% by 2050 — long-run rental-demand tailwind backs the buy-and-hold thesis.
Negotiation context
- Only 2 days on market — expect competitive offers; lowballing is unlikely to land.
- 2 sale attempts since 9y ago with the ask held roughly flat each time — persistent listings suggest the price (not the market) is what's stuck; bring a comps-based counter.
- Current owner paid $156k; 40% above their basis — modest negotiation headroom, anchor on the comps not their cost.
Risks & watch-outs
- Watch-outs: built in 1956 — expect roof / HVAC / electrical / plumbing capex.
- Climate carrying-cost: moderate wildfire risk; extreme-heat days projected 7→20/yr by 2055 (HVAC capex compounding) — expect insurance premiums to compound above CPI over the hold.
Questions for the listing agent
- Built in 1956 — when were the roof, HVAC, electrical panel, plumbing, and water heater last replaced?
- Is there a deadline driving the sale (1031 exchange, divorce, estate, relocation)? That informs how much negotiation room exists.
- The area grade is low — what's the realistic commute time and amenity access for the typical tenant pool here? Any planned neighborhood developments (good or bad) we should know about?
- What's the average days-on-market for RENTAL listings here right now (not sales)? A rising rental-DOM trend means longer vacancies and softer asking-rent achievability than the comps imply.
- What's the recent tenant-quality profile in this submarket — average credit score on applications, eviction rate, late-payment / NSF rate, and stable-employment percentage? A property-management company in the area should have these aggregated.
- How much new for-sale + rental construction is in the pipeline within 1–3 miles? Heavy new supply typically softens prices + rents 12–24 months out; constrained supply supports both.
Investment metrics
- 1% rule
- 0.83% ✗
- Cap rate
- 6.41%
- Cash-on-cash
- 0.42%
- DSCR
- 1.02
- GRM
- 10.0
CMA / ARV
- ARV (on-the-fly)
- $266,928
- Comps found
- 12
Show comp detail 12 sales within ~0.75 mi
| Address | Dist | Beds/Ba | Sqft | Sold | Price | $/sf | Match |
|---|---|---|---|---|---|---|---|
| 303 E Center St | 0.03mi | 3/2.0 | 1,568 (-2%) | 4mo | $260,000 | $166 | 89 |
| 201 E Douglas St | 0.08mi | 4/1.5 (+1) | 1,620 (+1%) | 7mo | $257,000 | $159 | 84 |
| 216 Jenkins Rd | 0.45mi | 3/2.0 | 1,670 (+4%) | 6mo | $320,000 | $192 | 66 |
| 204 Armstrong St | 0.29mi | 3/2.0 | 1,394 (-13%) | 3mo | $240,000 | $172 | 60 |
| 106 Jenkins Rd | 0.38mi | 3/2.0 | 1,410 (-12%) | 4mo | $290,000 | $206 | 57 |
| 304 N Battle St | 0.33mi | 3/3.0 | 1,835 (+14%) | 2mo | $270,000 | $147 | 54 |
| 728A Parks St | 0.61mi | 3/2.0 | 1,707 (+6%) | 7mo | $262,500 | $154 | 54 |
| 900 Parks St | 0.72mi | 3/1.5 | 1,533 (-5%) | 8mo | $125,000 | $82 | 52 |
| 605 Jenkins Rd | 0.67mi | 3/2.0 | 1,476 (-8%) | 3mo | $269,000 | $182 | 51 |
| 308 E Cleveland St | 0.56mi | 2/1.0 (-1) | 1,476 (-8%) | 3mo | $215,000 | $146 | 50 |
| 809 Linda St | 0.53mi | 3/2.0 | 1,404 (-13%) | 4mo | $230,000 | $164 | 48 |
| 306 S Ozark St | 0.70mi | 4/2.0 (+1) | 1,492 (-7%) | 0mo | $269,900 | $181 | 48 |
Match score weights: distance 35% · size 25% · config 20% · recency 20%. Top-matched comps best support the ARV.
Projected returns pro-forma
-3.0% appreciation · 3.0% rent growth · sell at horizon
- IRR
- -15.6%
- Equity multiple
- 0.44×
- Total profit
- $-34,143
- Equity at exit
- $32,654
- IRR
- -7.2%
- Equity multiple
- 0.54×
- Total profit
- $-28,087
- Equity at exit
- $18,935
Cash invested: $61,320 (down + closing). Projections, not guarantees.
Landlord ↔ Tenant lean methodology
- Overall (STATE)
- 92 Strongly Landlord-Friendly
- State Arkansas
- 92 Strongly Landlord-Friendly · R+14
- County
- — inherits STATE
- City
- — inherits STATE
ZIP-level market 72753
- Home prices YoY
- -15.1%
- Active inventory
- 283
- Price-to-rent
- 10.0×
Monthly cashflow live
- Estimated rent
- $1,822 high interval (Pro) →
- Mortgage (P&I)
- −$1,148
- Tax from tax record
- −$178 /mo · $2,134/yr
- Insurance
- −$91
- HOA
- −$0
- Vacancy / Maint / Mgmt
- −$383
- Net cashflow
- $22
Break-even live
UW: 25.0% down · 7.5% · 30yr · 1.5% tax · 5.0% vac · 8.0% maint · 8.0% mgmt
Financing live
Cash to close
- Down payment
- $54,750
- Closing costs
- $6,570
- Reserves months
- —
- Total cash needed
- —
Loan-product check · same deal, 3 products live
Conventional
25% down · 7.5% · 30yr
- Down + closing
- —
- Monthly P&I
- —
- Monthly cashflow
- —
- DSCR
- —
- Eligible?
- —
Personal DTI + credit; lowest rate.
DSCR
20% down · 8.5% · 30yr
- Down + closing
- —
- Monthly P&I
- —
- Monthly cashflow
- —
- DSCR
- —
- Eligible?
- —
No personal income docs; deal must DSCR.
Hard money
10% down · 12.0% · 12mo
- Down + closing
- —
- Monthly P&I
- —
- Monthly cashflow
- —
- DSCR
- —
- Eligible?
- —
Short-term bridge; refi at stabilization.
Rent comps 21 comps
| Address | Beds | Baths | Sqft | Rent | $/sqft | DOM | Units | Dist |
|---|---|---|---|---|---|---|---|---|
| 222 Nebo St Prairie Grove, AR | 2.0 | 2.5 | 1500 | $1,800 | $1.20 | 43d | 1 | 0.79mi |
| 951 Sugar Loaf St Unit NA Prairie Grove, AR | 4.0 | 2.0 | 1761 | $2,100 | $1.19 | 21d | 1 | 0.91mi |
| 951 Sugar Loaf St Prairie Grove, AR | 4.0 | 2.0 | 1761 | $2,100 | $1.19 | 14d | 1 | 0.91mi |
| 361 Captain Hopkins St Prairie Grove, AR | 3.0 | 2.0 | 1604 | $1,830 | $1.14 | 23d | 1 | 0.92mi |
| 361 Captain Hopkins St Prairie Grove, AR | 3.0 | 2.0 | 1604 | $1,799 | $1.12 | 14d | 1 | 0.92mi |
| 201 Hindman Dr #2 Prairie Grove, AR | 3.0 | 2.0 | 1200 | $1,325 | $1.10 | 43d | 1 | 0.93mi |
| 1101 Brigade Blvd Prairie Grove, AR | 4.0 | 2.0 | 1589 | $1,845 | $1.16 | 43d | 1 | 0.96mi |
| 681 Kendra St Prairie Grove, AR | 4.0 | 2.0 | 1550 | $1,695 | $1.09 | 14d | 1 | 1.03mi |
| 701 S Mock St Unit E1 Prairie Grove, AR | 2.0 | 2.0 | 1285 | $2,500 | $1.95 | 14d | 1 | 1.06mi |
| 1032 PEBBLE Dr Prairie Grove, AR | 3.0 | 2.0 | 1637 | $1,825 | $1.11 | 14d | 1 | 1.09mi |
| 540 Mac St Prairie Grove, AR | 4.0 | 2.0 | 1788 | $1,700 | $0.95 | 14d | 1 | 1.10mi |
| 560 Mac St Prairie Grove, AR | 4.0 | 2.0 | 1788 | $1,700 | $0.95 | 21d | 1 | 1.12mi |
| 1681 Viney Grove Rd Prairie Grove, AR | 3.0 | 2.0 | 1532 | $1,900 | $1.24 | 14d | 1 | 1.14mi |
| 590 Mac St Prairie Grove, AR | 4.0 | 2.0 | 1655 | $1,650 | $1.00 | 43d | 1 | 1.15mi |
| 541 Shepherd St Prairie Grove, AR | 4.0 | 2.0 | 1788 | $1,725 | $0.96 | 13d | 1 | 1.15mi |
| 1071 Emerald St Prairie Grove, AR | 3.0 | 2.0 | 1589 | $1,800 | $1.13 | 14d | 1 | 1.16mi |
| 551 Shepherd St Prairie Grove, AR | 3.0 | 2.0 | 1404 | $1,700 | $1.21 | 13d | 1 | 1.16mi |
| 1441 General Parson Dr Prairie Grove, AR | 3.0 | 2.0 | 1174 | $1,595 | $1.36 | 13d | 1 | 1.21mi |
| 941 Seabiscuit Dr Prairie Grove, AR | 3.0 | 2.0 | 1273 | $1,550 | $1.22 | 14d | 1 | 1.34mi |
| 1718 Charismatic Dr Prairie Grove, AR | 3.0 | 2.0 | 1517 | $1,795 | $1.18 | 14d | 1 | 1.46mi |
| 1741 Charismatic Dr Prairie Grove, AR | 3.0 | 2.0 | 1409 | $1,800 | $1.28 | 23d | 1 | 1.47mi |
Listing history 3 events
-
2026-06-18days on market $219,000 Active 2 DOM
-
2026-06-17remarks 663-char remark
-
2026-06-17$219,000 Active 1 DOM
ⓘ Source: listings_history table (triggers on properties + properties_extension) + one-shot
backfill from property_details.listing_events for pre-trigger history.
Tax reassessment forecast AR · Resets to sale price
- Current annual tax
- $2,134 · $178/mo
- Projected year-2 tax
- $2,134 · $178/mo
- Expected delta
- $0/yr ($0/mo · 0.0%)
ⓘ Screening estimate from a state-policy table — verify with the county assessor before closing.
Climate risk First Street
- Flood 1/10 Low FEMA zone X (unshaded) · 0% chance over 30 yrs
- Wildfire 5/10 Major
- Heat 5/10 Major 7 d/yr ≥105°F today · 20 d/yr by 30 yrs out
- Wind 2/10 Low 3% chance of damaging wind over 30 yrs
- Air quality 2/10 Low 1 unhealthy d/yr today · 1 by 30 yrs out
Nearby sold comps map
Loading sold comps map…
Walkable amenities ~0.75 mi
Loading nearby amenities…
Taxation est. · year 1
- Rental income
- $21,861
- − Mortgage interest
- −$12,267
- − Property taxes
- −$2,134
- − Insurance
- −$1,095
- − Repairs & maintenance
- −$1,749
- − Management
- −$1,749
- − Depreciation
- −$6,371
- Taxable loss
- −$3,505
- Est. tax savings @ 24.0%
- +$841
- After-tax cash flow
- $1,100/yr
For passive investors: Depreciation is non-cash, so a rental often shows a tax loss while cash-flowing — sheltering income. Rental losses are passive: they offset passive income freely, and up to $25,000/yr can offset ordinary (W-2) income if you actively participate and your MAGI is under $100k (phasing out to $0 by $150k); unused losses carry forward. On sale, claimed depreciation is recaptured at up to 25%, and gains may owe capital-gains tax (a 1031 exchange can defer both). Figures are a year-1 estimate at your 24.0% rate — not tax advice; consult a CPA.
Schools (NCES district)
- District
- Prairie Grove School District
- NCES district ID
- 0511760
- Math proficiency
- 43% ▼ -13.00%
- Reading proficiency
- 39% ▼ -10.00%
- Median HH income
- $55,896
- Composite
- 35.91/100
- National rank
- #4808
- State rank
- #50 of 238 in AR
Livability — Prairie Grove
- Score
- 67/100
- State rank
- #99
- US rank
- #10475
Category grades
Schools grade is shown separately in the Schools card above.
Census & demographics
- Census place
- Prairie Grove, AR
- County
- Washington County · 252,056 people
- City population
- 10,744
- Metro
- Fayetteville-Springdale-Rogers, AR
- Population (ZIP)
- 10,744
- Household income
- $70,985
- Rent vs Own
- Severe rent burden
- 94.0
Population outlook (Washington County) Hauer SSP2
- Today (2025)
- 271,748 people
- By 2030
- 296,414 · +9.1%
- By 2040
- 346,874 · +27.6%
- By 2050
- 398,552 · +46.7%
- By 2075
- 523,309 · +92.6%
- By 2100
- 615,280 · +126.4%
Race, ethnicity, and origin ACS 2023
- Neighborhood character
- Predominantly White (74%)
- Race & ethnicity
- White 74% Two or more races 20% Hispanic / Latino 5% Native American 1%
- Hispanic origin (detail)
- Mexican 5%
- Common ancestry
- Italian 3% Portuguese 3% Iranian 2%
- Foreign-born
- 2% · Canada
- Languages at home
- 97% English-only · Spanish 2%
Political lean MEDSL · Washington
- 2024 margin
- Lean R (+6.7) · D 45.1% · R 51.7% · Other 3.2%
- 2008→2024 swing
- +6.4pp toward D · 2008: -13.1pp · 2024: -6.7pp
- All cycles
- 2024: R+6.7 2020: R+3.9 2016: R+10.4 2012: R+16.3 2008: R+13.1
Not yet ingested
- Civics
- —
Market trends
- HPI YoY
- ▼ -58.17%
- Current HPI
- 326.3868
- Rent YoY
- —
- Metro
- Fayetteville-Springdale-Rogers, AR
- State GDP YoY
- ▲ 3.80%
- F500 in state
- 10
Industry mix (Fortune 500 HQ in AR)
| Industry | F500 HQs | Revenue |
|---|---|---|
| Retail | 1 | $681B |
|
||
| Food / Agriculture | 1 | $53B |
|
||
| Retail / Energy | 1 | $22B |
|
||
| Transportation / Logistics | 1 | $12B |
|
||
| Energy | 1 | $4B |
|
||
Price history
+265.0% since first listed8 events — show timeline
- 2026-06-17 Listed $219,000 FSBO.com
- 2023-04-05 Sold (Public Records) $155,966 Public Records
- 2017-08-09 Sold (Public Records) $129,900 Public Records
- 2017-08-07 Sold (MLS) $129,900 NWARMLS
- 2017-03-25 Listed $129,900 NWARMLS
- 2006-09-05 Sold (Public Records) $123,000 Public Records
- 2006-05-08 Sold (Public Records) $130,000 Public Records
- 1994-05-27 Sold (Public Records) $60,000 Public Records
Property tax history
+9.6%/yrLatest (2025): $2,134 · +1.4% YoY. Source: county tax records.
Cash-flow waterfall
monthlySold comps — $/sqft
last 12 mo · ≤1 miLoading sold comps…