 🏷️ Likely Rental
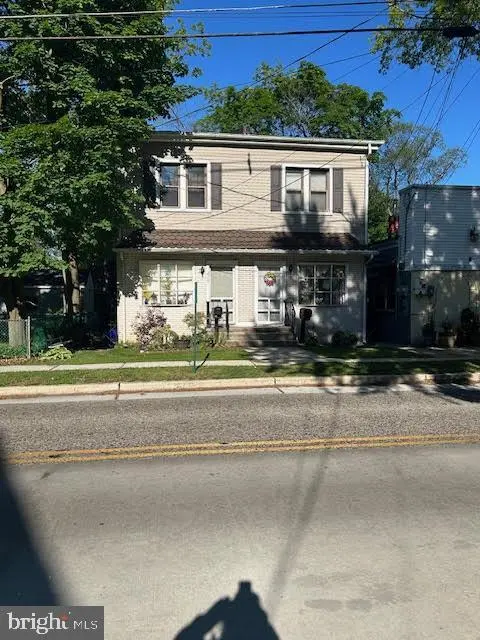
210 N Centre St · Merchantville, NJ
Flood risk No data
- FEMA flood zone
- —
- Chance of flooding over 30 yrs
- —
- Est. flood insurance / yr
- —
Fire risk No data
- Est. fire insurance / yr
- —
Heat risk No data
- Hot days now (above threshold)
- —
- Hot days in 30 yrs
- —
Wind risk No data
- Chance of severe wind over 30 yrs
- —
Air-quality risk No data
- Unhealthy air days now
- —
- Unhealthy air days in 30 yrs
- —
Risk factors via First Street. Map © Google.
Why this score? — see what drove the B- grade
The composite is a weighted blend of 9 inputs, each scored 0–100. Each bar is that input's sub-score; the figure is the points it added to the 100-point composite (weight × sub-score).
- Cash flow +30.0/30.0
- DSCR +10.0/10.0
- 1% rule +9.9/10.0
- ARV discount +7.5/15.0
- Livability +4.2/5.0
- Schools +3.2/10.0
- Rent growth +2.5/5.0
- Condition / age +2.2/5.0
- Appreciation +0.0/10.0
$250,000
🖨 Deal sheet 📄 Offer letter ✓ Due diligence
Multi-family units
County records classify this as Multi-Family (2-4 Unit). Listing-text estimate: 2 units. confirmed
Listing remarks
Duplex (Multi-Family) to be sold together with 210 Centre St. Each side is a duplex and 212 N Centre is one deed and 210 N Centre is another deed but to be sold at same time. All are tenant occupied and long term tenants. 210B is an upper unit (enter from rear) 2 Bedroom 1 bath 2 story unit 210A (enter from front) has basement access. 1 Bed 1 Bath 2 Gas Meters 2 electric meters
Key facts
- 2,222 sq ft lot
- Built 1926
- Listed 13 days
Property features AI
Finance
- Other: Fee simple ownership
Exterior
- Parking: On-street parking
- Utilities: Public water; Public sewer; Electric for cooling; Natural gas for heating and hot water
- Home design: Semi-detached property; Above-grade finished living area reported (1,372 finished)
- Construction: Vinyl siding with brick front; Foundation: Other; Other structures noted above grade and below grade; Built year reported by assessor
- Exterior features: Lot approximately 18.5 x 120 feet; No tidal water
Interior
- Bedrooms: One 1-bedroom unit; One 2-bedroom unit
- Flooring: Hardwood
- Heating & cooling: Forced air heating (natural gas); Central air conditioning (electric); Natural gas hot water
- Interior features: Hardwood flooring; Two-unit layout (Unit 1 and Unit 2)
Neighborhood map
What this means for you Summary
Snapshot
- This is a 2 × 3-bed/1.0-bath units multifamily listed at $250k. Condition is rated fair.
Deal economics
- At list price, monthly cash flow is $1k ($14k/yr) — positive. Per door: $604/mo.
- The deal already cash-flows at list — no discount required.
- Meets the 1% rule at list price ($4k rent vs $250k).
- Cap rate 12.1% vs local median 4.2% in Merchantville — top-decile yield for the area; either an underpriced asset or a hidden risk that comps aren't pricing in. Stress-test before assuming the spread holds.
Location & tenants
- Location reads 84/100 on livability (#30 in NJ, #773 nationally) — a professional / high-income tenant draw. Strengths: employment A+, housing A+, crime A; Watch: cost of living D+.
- Merchantville School District (suburban): math 23% / reading 48% proficiency, ranked #272 of 472 in NJ (top 58%) — families likely to look elsewhere, expect single-tenant / working-renter base with shorter leases.
- Market conditions: 76 active listings in the ZIP; solid renter incomes; 1,018 units permitted in Camden County in 2024 (509 in 5+ unit buildings).
- At $3,715/mo this rent would consume 49% of the median local household income ($90k/yr) (locally 874% of renters already pay >50% of income on rent) — very limited rent-growth headroom before tenants either downsize or default.
Forward outlook
- Local home prices are declining (-3.0%/yr); year-one equity from $2k of loan paydown is wiped out by about $8k of value loss. Plan a longer hold.
- Camden County population projected to shrink 8% by 2050 — rents likely to lag national; underwrite the cash flow, not the appreciation.
- At projected returns (-3.0% appreciation + 3.0% rent growth), your $70k cash investment doubles in ~6 years — after that, you're playing with house money.
Negotiation context
- Only 13 days on market — expect competitive offers; lowballing is unlikely to land.
Risks & watch-outs
- Watch-outs: built in 1926 — expect roof / HVAC / electrical / plumbing capex.
Questions for the listing agent
- Can we see the unit-by-unit rent roll, current vacancy, and any below-market leases? What's the average tenancy length?
- What capital expenditures (roof, boiler, parking lot, exteriors) have been made in the last 5 years, and what's planned in the next 2?
- Have any recent inspections been done? Can we get a copy of the seller's disclosures and any deferred-maintenance estimates?
- Built in 1926 — when were the roof, HVAC, electrical panel, plumbing, and water heater last replaced?
- Is there a deadline driving the sale (1031 exchange, divorce, estate, relocation)? That informs how much negotiation room exists.
- What's the average days-on-market for RENTAL listings here right now (not sales)? A rising rental-DOM trend means longer vacancies and softer asking-rent achievability than the comps imply.
- What's the recent tenant-quality profile in this submarket — average credit score on applications, eviction rate, late-payment / NSF rate, and stable-employment percentage? A property-management company in the area should have these aggregated.
- How much new apartment / multifamily construction is in the pipeline within 1–3 miles? Heavy new supply (>2% of stock underway) typically softens rents 12–24 months out; light construction supports rent growth.
Investment metrics
- 1% rule
- 1.49% ✓
- Cap rate
- 12.09%
- Cash-on-cash
- 20.69%
- DSCR
- 1.92
- GRM
- 5.6
CMA / ARV
- ARV (on-the-fly)
- $580,356
- Comps found
- 1
Show comp detail 1 sale within ~0.75 mi
| Address | Dist | Beds/Ba | Sqft | Sold | Price | $/sf | Match |
|---|---|---|---|---|---|---|---|
| 6136 Magnolia Ave | 0.73mi | 6/— | 1,490 (+9%) | 8mo | $630,000 | $423 | 45 |
Match score weights: distance 35% · size 25% · config 20% · recency 20%. Top-matched comps best support the ARV.
Projected returns pro-forma
-3.0% appreciation · 3.0% rent growth · sell at horizon
- IRR
- 13.1%
- Equity multiple
- 1.52×
- Total profit
- $36,430
- Equity at exit
- $37,276
- IRR
- 21.9%
- Equity multiple
- 2.87×
- Total profit
- $130,951
- Equity at exit
- $21,615
Cash invested: $70,000 (down + closing). Projections, not guarantees.
Landlord ↔ Tenant lean methodology
- Overall (STATE)
- 21 Tenant-Leaning
- State New Jersey
- 21 Tenant-Leaning · D+6
- County
- — inherits STATE
- City
- — inherits STATE
ZIP-level market 08109
- Active inventory
- 76
- Price-to-rent
- 11.2×
Monthly cashflow live
- Estimated rent
- $3,715 medium interval (Pro) →
- Mortgage (P&I)
- −$1,311
- Tax est. 1.5%
- −$312 /mo · $3,750/yr
- Insurance
- −$104
- HOA
- −$0
- Vacancy / Maint / Mgmt
- −$780
- Net cashflow
- $1,207
Break-even live
2-unit breakdown (identical units grouped — click to expand)
| Units | Beds | Baths | Est. rent |
|---|---|---|---|
| 2× units | 3 | 1 | $3,714 |
| #1 | 3 | 1 | $1,857 |
| #2 | 3 | 1 | $1,857 |
| Total (2 units) | $3,715 | ||
UW: 25.0% down · 7.5% · 30yr · 1.5% tax · 5.0% vac · 8.0% maint · 8.0% mgmt
Financing live
Cash to close
- Down payment
- $62,500
- Closing costs
- $7,500
- Reserves months
- —
- Total cash needed
- —
Loan-product check · same deal, 3 products live
Conventional
25% down · 7.5% · 30yr
- Down + closing
- —
- Monthly P&I
- —
- Monthly cashflow
- —
- DSCR
- —
- Eligible?
- —
Personal DTI + credit; lowest rate.
DSCR
20% down · 8.5% · 30yr
- Down + closing
- —
- Monthly P&I
- —
- Monthly cashflow
- —
- DSCR
- —
- Eligible?
- —
No personal income docs; deal must DSCR.
Hard money
10% down · 12.0% · 12mo
- Down + closing
- —
- Monthly P&I
- —
- Monthly cashflow
- —
- DSCR
- —
- Eligible?
- —
Short-term bridge; refi at stabilization.
Listing history 4 events
-
2026-06-07status $250,000 Pending 13 DOM
-
2026-06-01statusdays on market $250,000 Active Under Contract 13 DOM
-
2026-05-31days on market $250,000 Active 12 DOM
-
2026-05-19$250,000 Active
ⓘ Source: listings_history table (triggers on properties + properties_extension) + one-shot
backfill from property_details.listing_events for pre-trigger history.
Nearby sold comps map
Loading sold comps map…
Walkable amenities ~0.75 mi
Loading nearby amenities…
Taxation est. · year 1
- Rental income
- $44,580
- − Mortgage interest
- −$14,004
- − Property taxes
- −$3,750
- − Insurance
- −$1,250
- − Repairs & maintenance
- −$3,566
- − Management
- −$3,566
- − Depreciation
- −$7,273
- Taxable income
- $11,171
- Est. tax owed @ 24.0%
- −$2,681
- After-tax cash flow
- $11,805/yr
For passive investors: Depreciation is non-cash, so a rental often shows a tax loss while cash-flowing — sheltering income. Rental losses are passive: they offset passive income freely, and up to $25,000/yr can offset ordinary (W-2) income if you actively participate and your MAGI is under $100k (phasing out to $0 by $150k); unused losses carry forward. On sale, claimed depreciation is recaptured at up to 25%, and gains may owe capital-gains tax (a 1031 exchange can defer both). Figures are a year-1 estimate at your 24.0% rate — not tax advice; consult a CPA.
Condition & rehab AI · 8 photos
A moderate rehab project is needed to bring this multi-family property up to a fair condition. Upgrades in paint, landscaping, and appliances would significantly enhance its value.
Repairs flagged
- Minor exterior siding — Light wear
- Minor interior paint — Some wear
- Minor kitchen appliances — Standard wear
- Minor bathroom fixtures — Standard wear
- Minor HVAC units — Standard wear
Value-add opportunities
- Both paint interior and exterior — Fresh paint enhances curb appeal and interior aesthetics
- Both landscaping and curb appeal — Improved landscaping increases curb appeal and property value
- Both HVAC maintenance — Fresh HVAC units improve comfort and energy efficiency
- Both kitchen appliances — Upgraded appliances increase functionality and appeal
- Both bathroom fixtures — Modern fixtures enhance functionality and appeal
Renovation cost estimate screening
| Repair item | Severity | Est. cost |
|---|---|---|
| exterior siding · Light wear | Minor | $500–3,000 |
| interior paint · Some wear | Minor | $500–3,000 |
| kitchen appliances · Standard wear | Minor | $500–3,000 |
| bathroom fixtures · Standard wear | Minor | $500–3,000 |
| HVAC units · Standard wear | Minor | $500–3,000 |
| Total estimated repair cost · 5 items | $2,500–15,000 |
Value-add ROI direction
- Both paint interior and exterior — Fresh paint enhances curb appeal and interior aesthetics ↑
- Both landscaping and curb appeal — Improved landscaping increases curb appeal and property value ↑
- Both HVAC maintenance — Fresh HVAC units improve comfort and energy efficiency ↑
- Both kitchen appliances — Upgraded appliances increase functionality and appeal ↑
- Both bathroom fixtures — Modern fixtures enhance functionality and appeal ↑
ⓘ Cost ranges are severity-bucket heuristics (US national rule-of-thumb). Get contractor quotes + a written scope before underwriting a rehab budget.
Schools (NCES district)
- District
- Merchantville School District
- NCES district ID
- 3409960
- Math proficiency
- 23% ▼ -24.00%
- Reading proficiency
- 48% ▼ -4.00%
- Median HH income
- $65,130
- Composite
- 32.11/100
- National rank
- #5802
- State rank
- #272 of 472 in NJ
Livability — Merchantville
- Score
- 84/100
- State rank
- #30
- US rank
- #773
Category grades
Schools grade is shown separately in the Schools card above.
Census & demographics
- Census place
- Merchantville, NJ
- County
- Camden County · 407,624 people
- City population
- 24,022
- Metro
- Philadelphia-Camden-Wilmington, PA-NJ-DE-MD
- Population (ZIP)
- 24,022
- Household income
- $90,242
- Rent vs Own
- Severe rent burden
- 874.0
Population outlook (Camden County) Hauer SSP2
- Today (2025)
- 507,964 people
- By 2030
- 502,182 · -1.1%
- By 2040
- 485,602 · -4.4%
- By 2050
- 465,630 · -8.3%
- By 2075
- 419,986 · -17.3%
- By 2100
- 369,492 · -27.3%
Race, ethnicity, and origin ACS 2023
- Neighborhood character
- Highly diverse neighborhood (Simpson 0.72)
- Race & ethnicity
- White 39% Hispanic / Latino 31% Black 18% Two or more races 11% Asian 9%
- Hispanic origin (detail)
- Puerto Rican 16% Dominican 6%
- Common ancestry
- Romanian 5% Lithuanian 1% Subsaharan African 1%
- Foreign-born
- 12% · Canada, Vietnam, China
- Languages at home
- 72% English-only · Spanish 20% Vietnamese 4% Other Indo-European 1%
Political lean MEDSL · Camden
- 2024 margin
- Strong D (+27.4) · D 63.0% · R 35.5% · Other 1.5%
- 2008→2024 swing
- -8.8pp toward R · 2008: 36.2pp · 2024: 27.4pp
- All cycles
- 2024: D+27.4 2020: D+33.5 2016: D+32.4 2012: D+36.6 2008: D+36.2
Not yet ingested
- Civics
- —
Market trends
- HPI YoY
- ▼ -197.50%
- Current HPI
- 331.3072
- Rent YoY
- —
- Metro
- Philadelphia-Camden-Wilmington, PA-NJ-DE-MD
- State GDP YoY
- ▲ 2.05%
- F500 in state
- 34
Industry mix (Fortune 500 HQ in NJ)
| Industry | F500 HQs | Revenue |
|---|---|---|
| Consumer Goods | 3 | $31B |
|
||
| Pharmaceuticals | 2 | $153B |
|
||
| Technology | 2 | $21B |
|
||
| Insurance | 2 | $20B |
|
||
| Healthcare | 2 | $19B |
|
||
| Financial Services | 1 | $70B |
|
||
Price history
1 event — show timeline
- 2026-05-19 Listed $250,000 BRIGHT MLS
Cash-flow waterfall
monthlySold comps — $/sqft
last 12 mo · ≤1 miLoading sold comps…