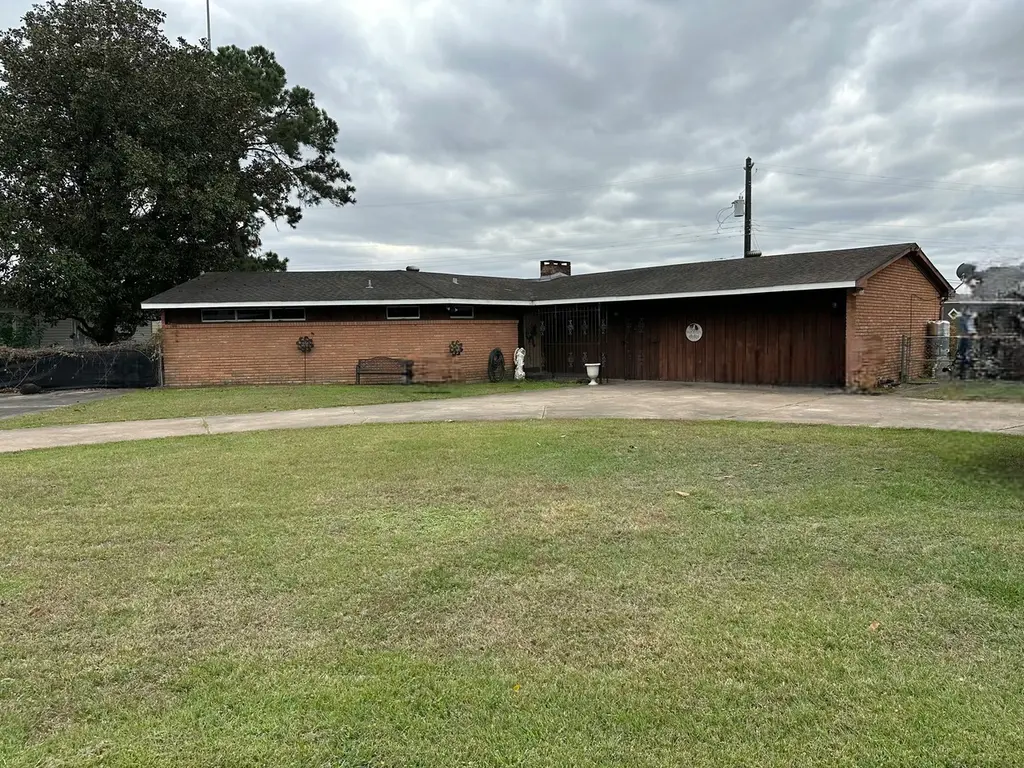
188 Grammar Rd · Pearland, TX
Flood risk 1/10 · Minimal
- FEMA flood zone
- X (unshaded)
- Chance of flooding over 30 yrs
- 0.0%
- Est. flood insurance / yr
- $507 – $1,088
Fire risk 2/10 · Minimal
- Est. fire insurance / yr
- $1,222 – $2,270
Heat risk 9/10 · Severe
- Hot days now (above 110°F)
- 7 days/yr
- Hot days in 30 yrs
- 23 days/yr
Wind risk 9/10 · Severe
- Chance of severe wind over 30 yrs
- 99.0%
Air-quality risk 2/10 · Minimal
- Unhealthy air days now
- 2 days/yr
- Unhealthy air days in 30 yrs
- 2 days/yr
Risk factors via First Street. Map © Google.
Why this score? — see what drove the C- grade
The composite is a weighted blend of 9 inputs, each scored 0–100. Each bar is that input's sub-score; the figure is the points it added to the 100-point composite (weight × sub-score).
- Cash flow +19.0/30.0
- ARV discount +11.8/15.0
- DSCR +6.0/10.0
- 1% rule +4.5/10.0
- Livability +4.0/5.0
- Schools +2.7/10.0
- Condition / age +2.5/5.0
- Rent growth +2.4/5.0
- Appreciation +0.0/10.0
$260,000
🖨 Deal sheet 📄 Offer letter ✓ Due diligence
Listing remarks
Spacious 3BR/2BA home offering 1,912 sq ft of living space on over 1/4 acre. Features include a huge living room, bonus game room/guest room, and a private pool. Nestled at the end of a quiet dead-end road providing added privacy. No flooding history. Property is zoned for residential/commercial use, offering flexibility for a home-based or small business (buyer to verify permitted uses). Generous yard space ideal for outdoor enjoyment with a versatile layout and room to entertain.
Key facts
- Private pool
- Generous yard space
- Bonus game room
Tags
Property features AI
Finance
- Other: Seller disclosure available
Exterior
- Utilities: Septic tank
- Home design: Residential property; Single-story (first-floor primary and bedrooms)
- Construction: Brick construction; Built in 1956; Slab foundation; Composition roof
- Exterior features: Private gunite pool; Lot largely cleared
Interior
- Bedrooms: Primary bedroom on the first floor, approximately 16 x 16; Bedroom on the first floor, approximately 14 x 14; Bedroom on the first floor, approximately 14 x 14
- Bathrooms: 2 full bathrooms
- Heating & cooling: Central heating (electric); Central air conditioning (electric)
- Interior features: One fireplace; Total of 3 rooms
Neighborhood map
What this means for you Summary
Snapshot
- This is a 3-bed/2.0-bath single-family listed at $260k.
Deal economics
- At list price, monthly cash flow is $271 ($3k/yr) — positive.
- The deal already cash-flows at list — no discount required.
- To meet the 1% rule (rent ≥ 1% of price), the offer needs to be $247k (5.1% below list).
- Recommended offer: $247k (5.1% below list) — sets the bar for 1% rule.
- Cap rate 7.5% vs local median 3.0% in Pearland — top-decile yield for the area; either an underpriced asset or a hidden risk that comps aren't pricing in. Stress-test before assuming the spread holds.
Location & tenants
- Location reads 81/100 on livability (#32 in TX, #1,539 nationally) — a professional / high-income tenant draw. Strengths: employment A+, housing A+, crime A; Watch: amenities D-, commute F.
- Houston ISD (urban): math 27% / reading 35% proficiency, ranked #593 of 826 in TX (top 72%) — families likely to look elsewhere, expect single-tenant / working-renter base with shorter leases; 71% free/reduced lunch — lower-income household profile, screen leases tightly.
- Zoned schools: Lawson Middle (math 21% / reading 27%, grade F, #1,301 of 1,662 statewide, top 79%, 1,274 students, 96% FRL); Worthing H S (math 22% / reading 21%, grade F, #1,377 of 1,632 statewide, top 85%, 827 students, 96% FRL) — zoned schools average 96% FRL vs 71% district-wide (25 pts higher); higher-poverty schools than district average — tighter screening recommended.
- Market conditions: Rents soft (-0.2%/yr); 280 active listings in the ZIP; 5 comparable units currently listed for rent nearby; rentals leasing fast (median 2d on market — plan ~1-2 weeks tenant-placement turnaround); 40% of comp listings sitting > 30 days — soft ceiling on asking rent; solid renter incomes; 29,883 units permitted in Harris County in 2024 (8,621 in 5+ unit buildings).
- This rent runs 38% of the median local income ($79k/yr) — at the standard rent-burdened threshold; future hikes will face affordability resistance.
Forward outlook
- Local home prices are declining (-3.0%/yr); year-one equity from $2k of loan paydown is wiped out by about $8k of value loss. Plan a longer hold.
- Harris County population projected at +47% by 2050 — long-run rental-demand tailwind backs the buy-and-hold thesis.
Negotiation context
- It's been on market 44 days — a 3% lower offer ($252k) is reasonable based on typical stale-listing flexibility.
- 2 sale attempts with the ask held roughly flat each time — persistent listings suggest the price (not the market) is what's stuck; bring a comps-based counter.
Risks & watch-outs
- Watch-outs: built in 1956 — expect roof / HVAC / electrical / plumbing capex.
- Climate carrying-cost: severe wind risk, 99% chance of damaging wind over 30y; extreme-heat days projected 7→23/yr by 2055 (HVAC capex compounding) — expect insurance premiums to compound above CPI over the hold.
Questions for the listing agent
- It's been on market 44 days. Have you received any prior offers? Is the seller open to a 5% concession, seller financing, or rate buy-down credit?
- Built in 1956 — when were the roof, HVAC, electrical panel, plumbing, and water heater last replaced?
- Is there a deadline driving the sale (1031 exchange, divorce, estate, relocation)? That informs how much negotiation room exists.
- Schools are A-rated — typically a magnet for longer-tenancy family renters. What's the average tenant stay here, and is there a school-zone premium baked into asking?
- What's the average days-on-market for RENTAL listings here right now (not sales)? A rising rental-DOM trend means longer vacancies and softer asking-rent achievability than the comps imply.
- What's the recent tenant-quality profile in this submarket — average credit score on applications, eviction rate, late-payment / NSF rate, and stable-employment percentage? A property-management company in the area should have these aggregated.
- How much new for-sale + rental construction is in the pipeline within 1–3 miles? Heavy new supply typically softens prices + rents 12–24 months out; constrained supply supports both.
Investment metrics
- 1% rule
- 0.95% ✗
- Cap rate
- 7.54%
- Cash-on-cash
- 4.47%
- DSCR
- 1.20
- GRM
- 8.8
CMA / ARV
- ARV (median comp)
- $287,761
- List price
- $260,000
- Delta
- -9.65%
- Verdict
- FAIR
- Comps
- 20 within 1.0 mi
Show comp detail 6 sales within ~0.75 mi
| Address | Dist | Beds/Ba | Sqft | Sold | Price | $/sf | Match |
|---|---|---|---|---|---|---|---|
| 230 Grammar Rd | 0.14mi | 3/2.0 | 1,888 (-1%) | 14mo | $250,000 | $132 | 79 |
| 14111 Bridgeport | 0.35mi | 3/2.5 | 1,806 (-6%) | 1mo | $334,000 | $185 | 71 |
| 14109 Bridgeport | 0.36mi | 3/2.5 | 1,806 (-6%) | 3mo | $334,000 | $185 | 70 |
| 14113 Bridgeport | 0.36mi | 3/2.5 | 1,806 (-6%) | 3mo | $334,000 | $185 | 69 |
| 14113A Bridgeport | 0.35mi | 3/2.5 | 1,806 (-6%) | 5mo | $334,000 | $185 | 69 |
| 402 Grammar Rd | 0.24mi | 3/2.0 | 1,651 (-14%) | 17mo | $299,900 | $182 | 52 |
Match score weights: distance 35% · size 25% · config 20% · recency 20%. Top-matched comps best support the ARV.
Projected returns pro-forma
-3.0% appreciation · 0.0% rent growth · sell at horizon
- IRR
- -12.6%
- Equity multiple
- 0.56×
- Total profit
- $-32,140
- Equity at exit
- $38,767
- IRR
- -8.5%
- Equity multiple
- 0.54×
- Total profit
- $-33,849
- Equity at exit
- $22,480
Cash invested: $72,800 (down + closing). Projections, not guarantees.
Landlord ↔ Tenant lean methodology
- Overall (STATE)
- 87 Strongly Landlord-Friendly
- State Texas
- 87 Strongly Landlord-Friendly · R+5
- County
- — inherits STATE
- City
- — inherits STATE
ZIP-level market 77047
- Home prices YoY
- -10.1%
- Rents YoY
- -0.2%
- Active inventory
- 280
- Price-to-rent
- 8.8×
Monthly cashflow live
- Estimated rent
- $2,467 high interval (Pro) →
- Mortgage (P&I)
- −$1,363
- Tax from tax record
- −$206 /mo · $2,471/yr
- Insurance
- −$108
- HOA
- −$0
- Vacancy / Maint / Mgmt
- −$518
- Net cashflow
- $271
Break-even live
UW: 25.0% down · 7.5% · 30yr · 1.5% tax · 5.0% vac · 8.0% maint · 8.0% mgmt
Financing live
Cash to close
- Down payment
- $65,000
- Closing costs
- $7,800
- Reserves months
- —
- Total cash needed
- —
Loan-product check · same deal, 3 products live
Conventional
25% down · 7.5% · 30yr
- Down + closing
- —
- Monthly P&I
- —
- Monthly cashflow
- —
- DSCR
- —
- Eligible?
- —
Personal DTI + credit; lowest rate.
DSCR
20% down · 8.5% · 30yr
- Down + closing
- —
- Monthly P&I
- —
- Monthly cashflow
- —
- DSCR
- —
- Eligible?
- —
No personal income docs; deal must DSCR.
Hard money
10% down · 12.0% · 12mo
- Down + closing
- —
- Monthly P&I
- —
- Monthly cashflow
- —
- DSCR
- —
- Eligible?
- —
Short-term bridge; refi at stabilization.
Rent comps 5 comps
| Address | Beds | Baths | Sqft | Rent | $/sqft | DOM | Units | Dist |
|---|---|---|---|---|---|---|---|---|
| 1930 Kingsley Dr Pearland, TX | 1.0–3.0 | 1.0–3.0 | 1123 | $2,426 | $2.16 | 1d | 22 | 1.27mi |
| 12635 Shadow Creek Pkwy Pearland, TX | 1.0–2.0 | 1.0–2.0 | 1019 | $3,344 | $3.28 | 1d | 33 | 1.32mi |
| 13013 Fair Breeze Ln Pearland, TX | 3.0 | 2.0 | 1471 | $2,549 | $1.73 | 43d | 1 | 1.36mi |
| 14435 Acuna Ln Houston, TX | 3.0 | 2.0 | 1496 | $1,805 | $1.21 | 43d | 1 | 1.41mi |
| 12900 Shadow Creek Pkwy Pearland, TX | 1.0–2.0 | 1.0–2.0 | 964 | $2,318 | $2.40 | 1d | 24 | 1.43mi |
Listing history 18 events
-
2026-06-18days on market $260,000 Active 44 DOM
-
2026-06-17days on market $260,000 Active 43 DOM
-
2026-06-16days on market $260,000 Active 42 DOM
-
2026-06-15days on market $260,000 Active 41 DOM
-
2026-06-13days on market $260,000 Active 39 DOM
-
2026-06-10days on market $260,000 Active 35 DOM
-
2026-06-08days on market $260,000 Active 34 DOM
-
2026-06-07days on market $260,000 Active 33 DOM
-
2026-06-04days on market $260,000 Active 30 DOM
-
2026-06-01days on market $260,000 Active 27 DOM
-
2026-05-31days on market $260,000 Active 26 DOM
-
2026-05-05historical
-
2026-05-05$260,000 Active 486-char remark
-
2026-03-17price $280,000
-
2026-01-09price $310,000
-
2025-12-26$325,000 Active
-
2017-05-22soldstatus
-
1995-03-24soldstatus
ⓘ Source: listings_history table (triggers on properties + properties_extension) + one-shot
backfill from property_details.listing_events for pre-trigger history.
Tax reassessment forecast TX · Resets to sale price
- Current annual tax
- $2,471 · $206/mo
- Projected year-2 tax
- $4,758 · $396/mo
- Expected delta
- +$2,287/yr (+$191/mo · 92.5%)
ⓘ Screening estimate from a state-policy table — verify with the county assessor before closing.
Climate risk First Street
- Flood 1/10 Low FEMA zone X (unshaded) · 0% chance over 30 yrs
- Wildfire 2/10 Low
- Heat 9/10 Extreme 7 d/yr ≥110°F today · 23 d/yr by 30 yrs out
- Wind 9/10 Extreme 99% chance of damaging wind over 30 yrs
- Air quality 2/10 Low 2 unhealthy d/yr today · 2 by 30 yrs out
Nearby sold comps map
Loading sold comps map…
Walkable amenities ~0.75 mi
Loading nearby amenities…
Taxation est. · year 1
- Rental income
- $29,600
- − Mortgage interest
- −$14,564
- − Property taxes
- −$2,471
- − Insurance
- −$1,300
- − Repairs & maintenance
- −$2,368
- − Management
- −$2,368
- − Depreciation
- −$7,564
- Taxable loss
- −$1,035
- Est. tax savings @ 24.0%
- +$248
- After-tax cash flow
- $3,500/yr
For passive investors: Depreciation is non-cash, so a rental often shows a tax loss while cash-flowing — sheltering income. Rental losses are passive: they offset passive income freely, and up to $25,000/yr can offset ordinary (W-2) income if you actively participate and your MAGI is under $100k (phasing out to $0 by $150k); unused losses carry forward. On sale, claimed depreciation is recaptured at up to 25%, and gains may owe capital-gains tax (a 1031 exchange can defer both). Figures are a year-1 estimate at your 24.0% rate — not tax advice; consult a CPA.
Schools (NCES district)
- District
- Houston ISD
- NCES district ID
- 4823640
- Math proficiency
- 27% ▼ -18.00%
- Reading proficiency
- 35% ▼ -6.00%
- Median HH income
- $46,054
- Composite
- 26.63/100
- National rank
- #7173
- State rank
- #593 of 826 in TX
Livability — Pearland
- Score
- 81/100
- State rank
- #32
- US rank
- #1539
Category grades
Schools grade is shown separately in the Schools card above.
Census & demographics
- County
- Harris County · 4,702,590 people
- City population
- 142,397
- Metro
- Houston-The Woodlands-Sugar Land, TX
- Population (ZIP)
- 34,987
- Household income
- $78,538
- Rent vs Own
- Severe rent burden
- 1109.0
Population outlook (Harris County) Hauer SSP2
- Today (2025)
- 5,571,493 people
- By 2030
- 6,089,821 · +9.3%
- By 2040
- 7,142,806 · +28.2%
- By 2050
- 8,185,864 · +46.9%
- By 2075
- 10,574,329 · +89.8%
- By 2100
- 12,109,958 · +117.4%
Race, ethnicity, and origin ACS 2023
- Neighborhood character
- Diverse neighborhood (Simpson 0.58)
- Race & ethnicity
- Black 57% Hispanic / Latino 29% Two or more races 15% White 6% Asian 3% Pacific Islander 1%
- Hispanic origin (detail)
- Mexican 24% Puerto Rican 1%
- Common ancestry
- Lithuanian 1%
- Foreign-born
- 15% · Canada, Vietnam
- Languages at home
- 70% English-only · Spanish 23% Vietnamese 1% Other Indo-European 1%
Political lean MEDSL · Harris
- 2024 margin
- Lean D (+5.5) · D 52.0% · R 46.4% · Other 1.6%
- 2008→2024 swing
- +3.9pp toward D · 2008: 1.6pp · 2024: 5.5pp
- All cycles
- 2024: D+5.5 2020: D+13.3 2016: D+12.4 2012: D+0.1 2008: D+1.6
Not yet ingested
- Civics
- —
Market trends
- HPI YoY
- ▼ -26.76%
- Current HPI
- 239.2287
- Rent YoY
- ▼ -0.21%
- Metro
- Houston-The Woodlands-Sugar Land, TX
- State GDP YoY
- ▲ 3.95%
- F500 in state
- 110
Industry mix (Fortune 500 HQ in TX)
| Industry | F500 HQs | Revenue |
|---|---|---|
| Energy | 16 | $1,198B |
|
||
| Technology | 5 | $198B |
|
||
| Engineering / Construction | 4 | $72B |
|
||
| Energy Services | 3 | $60B |
|
||
| Utilities | 3 | $41B |
|
||
| Healthcare | 2 | $330B |
|
||
Price history
-20.0% since first listed7 events — show timeline
- 2026-05-05 Listed $260,000 HARMLS
- 2026-05-05 Listing Removed — HARMLS
- 2026-03-17 Price Changed $280,000 HARMLS
- 2026-01-09 Price Changed $310,000 HARMLS
- 2025-12-26 Listed $325,000 HARMLS
- 2017-05-22 Sold (Public Records) — Public Records
- 1995-03-24 Sold (Public Records) — Public Records
Property tax history
+8.4%/yrLatest (2025): $2,471 · +12.3% YoY. Source: county tax records.
Cash-flow waterfall
monthlySold comps — $/sqft
last 12 mo · ≤1 miLoading sold comps…