 🏷️ Likely Rental
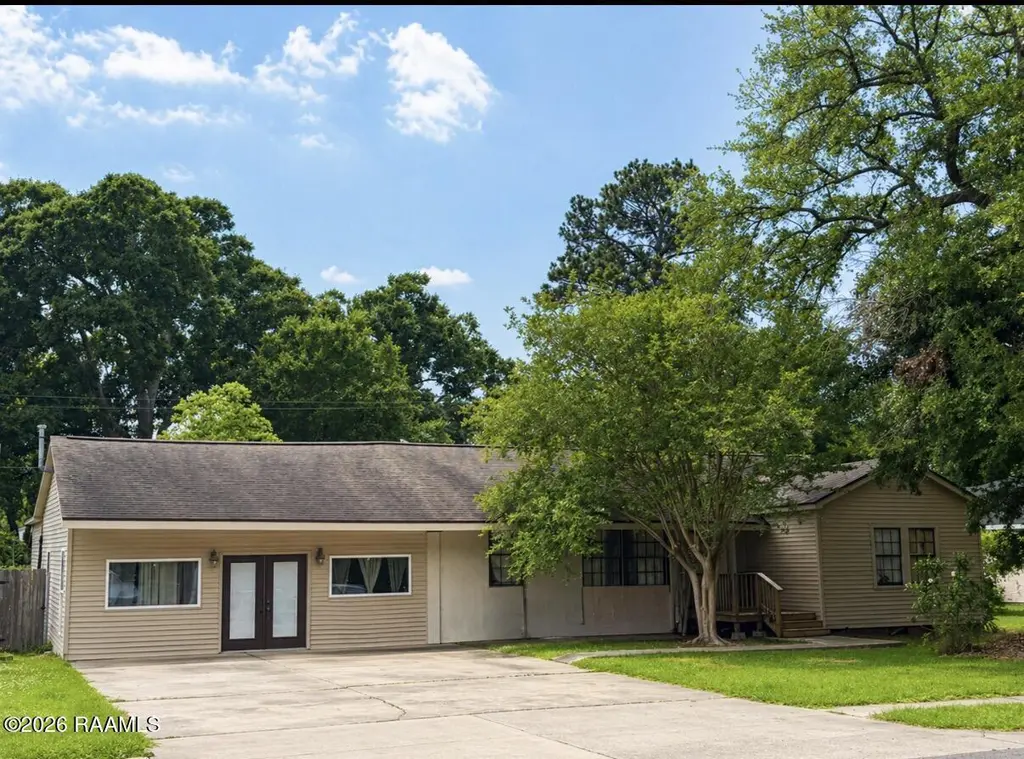
205 Arnould Blvd · Lafayette, LA
Flood risk 1/10 · Minimal
- FEMA flood zone
- X (unshaded)
- Chance of flooding over 30 yrs
- 0.0%
- Est. flood insurance / yr
- $507 – $1,088
Fire risk 1/10 · Minimal
- Est. fire insurance / yr
- $1,269 – $2,357
Heat risk 8/10 · Major
- Hot days now (above 108°F)
- 6 days/yr
- Hot days in 30 yrs
- 19 days/yr
Wind risk 9/10 · Severe
- Chance of severe wind over 30 yrs
- 99.0%
Air-quality risk 1/10 · Minimal
- Unhealthy air days now
- 0 days/yr
- Unhealthy air days in 30 yrs
- 0 days/yr
Risk factors via First Street. Map © Google.
Why this score? — see what drove the C- grade
The composite is a weighted blend of 9 inputs, each scored 0–100. Each bar is that input's sub-score; the figure is the points it added to the 100-point composite (weight × sub-score).
- Cash flow +15.8/30.0
- ARV discount +15.0/15.0
- DSCR +4.9/10.0
- 1% rule +3.8/10.0
- Schools +3.6/10.0
- Rent growth +3.5/5.0
- Livability +3.5/5.0
- Condition / age +2.5/5.0
- Appreciation +0.0/10.0
$220,000
🖨 Deal sheet 📄 Offer letter ✓ Due diligence
Listing remarks
Occupied investment property, tenant paying on time. Month-to-month lease, buyer can renew, convert, or repurpose. Immediate cash flow from day one. No vacancy risk, turnkey rentalThis classic ranch-style residence in the established Arnould Heights neighborhood offers an expansive 2,900 square feet of living space on a generous 0.34-acre lot and is a great investment opportunity. The interior features a versatile floor plan with three spacious bedrooms and three-and-a-half bathrooms, providing ample room for various living arrangements. Large windows throughout the home allow for abundant natural light, highlighting the functional flow between the central living areas and the updated kitch
Key facts
- 3,484 sq ft lot
- Parking
- Listed 48 days
Property features AI
Exterior
- Parking: Open parking
- Utilities: Electric service from city
- Home design: Single family residence
- Construction: Vinyl siding construction
- Exterior features: Vinyl siding; Public sewer
Interior
- Kitchen: Electric cooktop
- Bathrooms: 3 full bathrooms
- Heating & cooling: Central heating; Central air conditioning
- Interior features: Electric cooktop; Central heating and central air conditioning
Neighborhood map
What this means for you Summary
Snapshot
- This is a 3-bed/3.0-bath single-family listed at $220k.
Deal economics
- At list price, monthly cash flow is $101 ($1k/yr) — positive.
- The deal already cash-flows at list — no discount required.
- To meet the 1% rule (rent ≥ 1% of price), the offer needs to be $193k (12.3% below list).
- Recommended offer: $193k (12.3% below list) — sets the bar for 1% rule.
- Cap rate 6.8% vs local median 4.7% in Lafayette — top-decile yield for the area; either an underpriced asset or a hidden risk that comps aren't pricing in. Stress-test before assuming the spread holds.
Location & tenants
- Location reads 70/100 on livability (#63 in LA) — a middle-class / working-renter tenant base. Strengths: cost of living A+, housing A+, health & safety A+; Watch: amenities C-, employment C-, crime F.
- Lafayette Parish (urban): math 38% / reading 46% proficiency, ranked #19 of 98 in LA (top 19%) — families likely to look elsewhere, expect single-tenant / working-renter base with shorter leases.
- Zoned schools: Woodvale Elementary School (math 56% / reading 59%, grade C+, #76 of 646 statewide, top 12%, 890 students, 56% FRL); L.J. Alleman Middle School (math 48% / reading 56%, grade C+, #23 of 218 statewide, top 10%, 952 students, 54% FRL); Lafayette High School (math 57% / reading 51%, grade C-, #28 of 265 statewide, top 11%, 1,852 students, 52% FRL) — zoned schools at 54% FRL track the district average.
- Zoned-school proficiency averages 54% at this address vs 42% district-wide (+12 pts) — the actual schools serving this property are materially stronger than the Lafayette Parish average implies; a family-tenant draw the district grade alone would hide.
- Market conditions: Rents rising fast (+4.1%/yr); 404 active listings in the ZIP; 6 comparable units currently listed for rent nearby; rentals lingering (median 44d on market — plan ~5-8 weeks vacancy on turnover, expect pricing pressure); 67% of comp listings sitting > 30 days — soft ceiling on asking rent; 1,585 units permitted in Lafayette Parish in 2024 (10 in 5+ unit buildings).
- This rent runs 40% of the median local income ($57k/yr) — at the standard rent-burdened threshold; future hikes will face affordability resistance.
Forward outlook
- Local home prices are declining (-3.0%/yr); year-one equity from $2k of loan paydown is wiped out by about $7k of value loss. Plan a longer hold.
- Lafayette County population projected at +34% by 2050 — long-run rental-demand tailwind backs the buy-and-hold thesis.
Negotiation context
- It's been on market 48 days — a 3% lower offer ($213k) is reasonable based on typical stale-listing flexibility.
Risks & watch-outs
- Watch-outs: built in 1952 — expect roof / HVAC / electrical / plumbing capex.
- Climate carrying-cost: severe wind risk, 99% chance of damaging wind over 30y; extreme-heat days projected 6→19/yr by 2055 (HVAC capex compounding) — expect insurance premiums to compound above CPI over the hold.
Questions for the listing agent
- It's been on market 48 days. Have you received any prior offers? Is the seller open to a 12% concession, seller financing, or rate buy-down credit?
- Built in 1952 — when were the roof, HVAC, electrical panel, plumbing, and water heater last replaced?
- Is there a deadline driving the sale (1031 exchange, divorce, estate, relocation)? That informs how much negotiation room exists.
- Schools are B-rated — typically a magnet for longer-tenancy family renters. What's the average tenant stay here, and is there a school-zone premium baked into asking?
- Crime grade is F in this area — have there been break-ins, vandalism, or insurance claims at this property in the last 3 years? What carrier currently insures it and at what premium?
- What's the average days-on-market for RENTAL listings here right now (not sales)? A rising rental-DOM trend means longer vacancies and softer asking-rent achievability than the comps imply.
- What's the recent tenant-quality profile in this submarket — average credit score on applications, eviction rate, late-payment / NSF rate, and stable-employment percentage? A property-management company in the area should have these aggregated.
- How much new for-sale + rental construction is in the pipeline within 1–3 miles? Heavy new supply typically softens prices + rents 12–24 months out; constrained supply supports both.
Investment metrics
- 1% rule
- 0.88% ✗
- Cap rate
- 6.84%
- Cash-on-cash
- 1.96%
- DSCR
- 1.09
- GRM
- 9.5
CMA / ARV
- ARV (median comp)
- $294,783
- List price
- $220,000
- Delta
- -25.37%
- Verdict
- UNDERPRICED
- Comps
- 20 within 1.0 mi
Show comp detail 9 sales within ~0.75 mi
| Address | Dist | Beds/Ba | Sqft | Sold | Price | $/sf | Match |
|---|---|---|---|---|---|---|---|
| 200 Felicie Dr | 0.15mi | 4/2.0 (+1) | 2,600 (-8%) | 12mo | $300,000 | $115 | 61 |
| 105 Tours Dr | 0.43mi | 4/2.0 (+1) | 2,831 (+0%) | 14mo | $358,000 | $126 | 59 |
| 217 Kim Dr | 0.68mi | 2/3.5 (-1) | 2,869 (+2%) | 2mo | $295,000 | $103 | 57 |
| 208 Foreman Dr | 0.11mi | 4/2.0 (+1) | 2,437 (-14%) | 8mo | $226,500 | $93 | 57 |
| 105 Woodcrest Dr | 0.62mi | 4/3.0 (+1) | 2,694 (-5%) | 10mo | $326,000 | $121 | 50 |
| 308 Monteigne Dr | 0.71mi | 3/2.5 | 3,117 (+10%) | 4mo | $523,500 | $168 | 44 |
| 300 Claymore Dr | 0.74mi | 4/3.0 (+1) | 2,525 (-11%) | 3mo | $245,500 | $97 | 40 |
| 105 Club View Dr | 0.75mi | 2/2.5 (-1) | 2,669 (-6%) | 13mo | $550,000 | $206 | 38 |
| 216 Live Oak Dr | 0.67mi | 3/2.5 | 2,570 (-9%) | 20mo | $360,000 | $140 | 35 |
Match score weights: distance 35% · size 25% · config 20% · recency 20%. Top-matched comps best support the ARV.
Projected returns pro-forma
-3.0% appreciation · 4.12% rent growth · sell at horizon
- IRR
- -12.0%
- Equity multiple
- 0.56×
- Total profit
- $-27,072
- Equity at exit
- $32,803
- IRR
- -1.4%
- Equity multiple
- 0.90×
- Total profit
- $-6,220
- Equity at exit
- $19,022
Cash invested: $61,600 (down + closing). Projections, not guarantees.
Landlord ↔ Tenant lean methodology
- Overall (STATE)
- 90 Strongly Landlord-Friendly
- State Louisiana
- 90 Strongly Landlord-Friendly · R+12
- County
- — inherits STATE
- City
- — inherits STATE
ZIP-level market 70506
- Home prices YoY
- -34.8%
- Rents YoY
- 4.1%
- Active inventory
- 404
- Price-to-rent
- 9.5×
Monthly cashflow live
- Estimated rent
- $1,928 high interval (Pro) →
- Mortgage (P&I)
- −$1,154
- Tax from tax record
- −$177 /mo · $2,129/yr
- Insurance
- −$92
- HOA
- −$0
- Vacancy / Maint / Mgmt
- −$405
- Net cashflow
- $101
Break-even live
UW: 25.0% down · 7.5% · 30yr · 1.5% tax · 5.0% vac · 8.0% maint · 8.0% mgmt
Financing live
Cash to close
- Down payment
- $55,000
- Closing costs
- $6,600
- Reserves months
- —
- Total cash needed
- —
Loan-product check · same deal, 3 products live
Conventional
25% down · 7.5% · 30yr
- Down + closing
- —
- Monthly P&I
- —
- Monthly cashflow
- —
- DSCR
- —
- Eligible?
- —
Personal DTI + credit; lowest rate.
DSCR
20% down · 8.5% · 30yr
- Down + closing
- —
- Monthly P&I
- —
- Monthly cashflow
- —
- DSCR
- —
- Eligible?
- —
No personal income docs; deal must DSCR.
Hard money
10% down · 12.0% · 12mo
- Down + closing
- —
- Monthly P&I
- —
- Monthly cashflow
- —
- DSCR
- —
- Eligible?
- —
Short-term bridge; refi at stabilization.
Rent comps 6 comps
| Address | Beds | Baths | Sqft | Rent | $/sqft | DOM | Units | Dist |
|---|---|---|---|---|---|---|---|---|
| 506 Kees Cir Lafayette, LA | 4.0 | 2.0 | 2433 | $1,900 | $0.78 | 20d | 1 | 1.06mi |
| 204 Dublin Cir Unit A Lafayette, LA | 3.0 | 2.5 | 2200 | $1,895 | $0.86 | 13d | 1 | 1.24mi |
| 300 Highland Dr Lafayette, LA | 4.0 | 2.0 | 2200 | $1,900 | $0.86 | 43d | 1 | 1.26mi |
| 504 Alonda Dr Lafayette, LA | 4.0 | 2.0 | 2617 | $2,700 | $1.03 | 43d | 1 | 1.28mi |
| 611 Dutton Dr Lafayette, LA | 4.0 | 2.0 | 1960 | $1,725 | $0.88 | 43d | 1 | 1.33mi |
| 101 Chateau Pl Lafayette, LA | 3.0 | 2.0 | 2285 | $1,800 | $0.79 | 43d | 1 | 1.48mi |
Listing history 17 events
-
2026-06-18days on market $220,000 Active 48 DOM
-
2026-06-17days on market $220,000 Active 47 DOM
-
2026-06-16days on market $220,000 Active 46 DOM
-
2026-06-15days on market $220,000 Active 45 DOM
-
2026-06-14days on market $220,000 Active 43 DOM
-
2026-06-13days on market $220,000 Active 42 DOM
-
2026-06-10days on market $220,000 Active 40 DOM
-
2026-06-09days on market $220,000 Active 39 DOM
-
2026-06-08days on market $220,000 Active 38 DOM
-
2026-06-07days on market $220,000 Active 37 DOM
-
2026-06-05days on market $220,000 Active 34 DOM
-
2026-06-03days on market $220,000 Active 33 DOM
-
2026-06-02days on market $220,000 Active 32 DOM
-
2026-06-01pricedays on market $220,000 Active 31 DOM
-
2026-05-31days on market $225,000 Active 30 DOM
-
2026-05-30days on market $225,000 Active 29 DOM
-
2026-05-01$225,000 Active 1413-char remark
ⓘ Source: listings_history table (triggers on properties + properties_extension) + one-shot
backfill from property_details.listing_events for pre-trigger history.
Tax reassessment forecast LA · Resets to sale price
- Current annual tax
- $2,129 · $177/mo
- Projected year-2 tax
- $2,129 · $177/mo
- Expected delta
- $0/yr ($0/mo · 0.0%)
ⓘ Screening estimate from a state-policy table — verify with the county assessor before closing.
Climate risk First Street
- Flood 1/10 Low FEMA zone X (unshaded) · 0% chance over 30 yrs
- Wildfire 1/10 Low
- Heat 8/10 Severe 6 d/yr ≥108°F today · 19 d/yr by 30 yrs out
- Wind 9/10 Extreme 99% chance of damaging wind over 30 yrs
- Air quality 1/10 Low 0 unhealthy d/yr today · 0 by 30 yrs out
Nearby sold comps map
Loading sold comps map…
Walkable amenities ~0.75 mi
Loading nearby amenities…
Taxation est. · year 1
- Rental income
- $23,141
- − Mortgage interest
- −$12,323
- − Property taxes
- −$2,129
- − Insurance
- −$1,100
- − Repairs & maintenance
- −$1,851
- − Management
- −$1,851
- − Depreciation
- −$6,400
- Taxable loss
- −$2,514
- Est. tax savings @ 24.0%
- +$603
- After-tax cash flow
- $1,811/yr
For passive investors: Depreciation is non-cash, so a rental often shows a tax loss while cash-flowing — sheltering income. Rental losses are passive: they offset passive income freely, and up to $25,000/yr can offset ordinary (W-2) income if you actively participate and your MAGI is under $100k (phasing out to $0 by $150k); unused losses carry forward. On sale, claimed depreciation is recaptured at up to 25%, and gains may owe capital-gains tax (a 1031 exchange can defer both). Figures are a year-1 estimate at your 24.0% rate — not tax advice; consult a CPA.
Schools (NCES district)
- District
- Lafayette Parish
- NCES district ID
- 2200870
- Math proficiency
- 38% ▼ -32.00%
- Reading proficiency
- 46% ▼ -24.00%
- Median HH income
- $50,238
- Composite
- 36.15/100
- National rank
- #4741
- State rank
- #19 of 98 in LA
Livability — Lafayette
- Score
- 70/100
- State rank
- #63
- US rank
- #8133
Category grades
Schools grade is shown separately in the Schools card above.
Census & demographics
- Census place
- Lafayette, LA
- County
- Lafayette Parish · 207,544 people
- City population
- 8,670
- Metro
- Lafayette, LA
- Population (ZIP)
- 42,318
- Household income
- $57,379
- Rent vs Own
- Severe rent burden
- 2095.0
Population outlook (Lafayette County) Hauer SSP2
- Today (2025)
- 280,930 people
- By 2030
- 301,092 · +7.2%
- By 2040
- 339,456 · +20.8%
- By 2050
- 375,156 · +33.5%
- By 2075
- 451,672 · +60.8%
- By 2100
- 497,203 · +77.0%
Race, ethnicity, and origin ACS 2023
- Neighborhood character
- Diverse neighborhood (Simpson 0.58)
- Race & ethnicity
- White 60% Black 20% Hispanic / Latino 13% Two or more races 13% Asian 3%
- Hispanic origin (detail)
- Mexican 4%
- Common ancestry
- Lithuanian 18% Armenian 1% Slovak 1%
- Foreign-born
- 12% · Canada, Vietnam
- Languages at home
- 83% English-only · Spanish 9% French/Haitian/Cajun 3% Vietnamese 1%
Political lean MEDSL · Lafayette
- 2024 margin
- Solid R (+31.4) · D 33.5% · R 64.8% · Other 1.7%
- 2008→2024 swing
- -0.1pp no change · 2008: -31.3pp · 2024: -31.4pp
- All cycles
- 2024: R+31.4 2020: R+28.7 2016: R+33.6 2012: R+33.7 2008: R+31.3
Not yet ingested
- Civics
- —
Market trends
- HPI YoY
- ▼ -75.28%
- Current HPI
- 140.8445
- Rent YoY
- ▲ 4.12%
- Metro
- Lafayette, LA
- State GDP YoY
- ▲ 3.29%
- F500 in state
- 10
Industry mix (Fortune 500 HQ in LA)
| Industry | F500 HQs | Revenue |
|---|---|---|
| Telecommunications | 2 | $23B |
|
||
| Utilities | 1 | $12B |
|
||
| Wholesale / Distribution | 1 | $5B |
|
||
| Advertising | 1 | $2B |
|
||
Price history
-2.2% since first listed2 events — show timeline
- 2026-06-01 Price Changed $220,000 AcadianaMLS
- 2026-05-01 Listed $225,000 AcadianaMLS
Property tax history
+6.5%/yrLatest (2025): $2,129 · -1.1% YoY. Source: county tax records.
Cash-flow waterfall
monthlySold comps — $/sqft
last 12 mo · ≤1 miLoading sold comps…