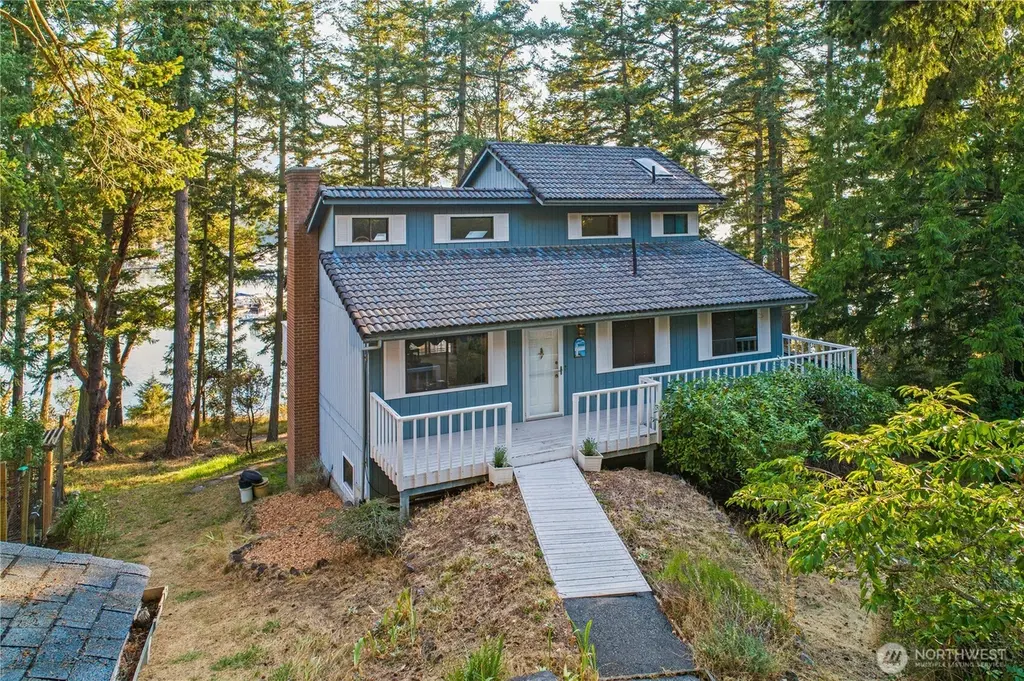
309 Afterglow Dr · Roche Harbor, WA
Flood risk 1/10 · Minimal
- FEMA flood zone
- X (unshaded)
- Chance of flooding over 30 yrs
- 0.0%
- Est. flood insurance / yr
- $473 – $860
Fire risk 3/10 · Minor
- Est. fire insurance / yr
- $604 – $1,122
Heat risk 1/10 · Minimal
- Hot days now (above 77°F)
- 5 days/yr
- Hot days in 30 yrs
- 16 days/yr
Wind risk 1/10 · Minimal
- Chance of severe wind over 30 yrs
- —
Air-quality risk 6/10 · Moderate
- Unhealthy air days now
- 7 days/yr
- Unhealthy air days in 30 yrs
- 8 days/yr
Risk factors via First Street. Map © Google.
Why this score? — see what drove the B grade
The composite is a weighted blend of 9 inputs, each scored 0–100. Each bar is that input's sub-score; the figure is the points it added to the 100-point composite (weight × sub-score).
- Cash flow +30.0/30.0
- ARV discount +10.3/15.0
- 1% rule +10.0/10.0
- DSCR +10.0/10.0
- Schools +5.7/10.0
- Rent growth +2.5/5.0
- Livability +2.5/5.0
- Condition / age +2.5/5.0
- Appreciation +0.0/10.0
$1,250,000
🖨 Deal sheet 📄 Offer letter ✓ Due diligence
Listing remarks
Roche Harbor Retreat. Nestled on a . 57-acre bordering iconic Roche Harbor Resort, this inviting south-facing gem offers the perfect blend of privacy & proximity, with direct access to one of the San Juans most beloved destinations. The home welcomes you with a light-filled great room, main floor bedroom & bath, upper primary ensuite with balcony, cedar-lined closets. Daylight lower level with wood stove adds warmth & flexibility for guests, hobbies or entertainment. Step outside to a peaceful deck with filtered water views of the resort, relax and soak in the island atmosphere. Easy access to pool, pickleball, marina, dining & more. 2-car garage, deer-fenced garden.
Key facts
- Daylight lower level
- Direct access
- South-facing gem
Tags
Neighborhood map
What this means for you Summary
Snapshot
- This is a 3-bed/3.0-bath single-family listed at $1.25M.
Deal economics
- At list price, monthly cash flow is $12k ($144k/yr) — positive.
- The deal already cash-flows at list — no discount required.
- Meets the 1% rule at list price ($25k rent vs $1.25M).
- Recommended offer: $1.10M (12.0% below list) — sets the bar for market timing.
- Cap rate 17.8% vs local median 0.5% in Roche Harbor — top-decile yield for the area; either an underpriced asset or a hidden risk that comps aren't pricing in. Stress-test before assuming the spread holds.
Location & tenants
- Location reads: area grade B — affects rentability + tenant quality, not the cash-flow math above.
- San Juan Island School District (rural): math 61% / reading 67% proficiency, ranked #36 of 291 in WA (top 12%) — acceptable for families but not a draw, mixed tenant base, ~2y average lease.
- Market conditions: 165 active listings in the ZIP; 1 comparable units currently listed for rent nearby; 99 units permitted in San Juan County in 2024 (0 in 5+ unit buildings).
Forward outlook
- Local home prices are declining (-3.0%/yr); year-one equity from $9k of loan paydown is wiped out by about $38k of value loss. Plan a longer hold.
- San Juan County population projected at +6% by 2050 — modest demand growth; plan on rents tracking national, not racing it.
- At projected returns (-3.0% appreciation + 3.0% rent growth), your $350k cash investment doubles in ~3 years — after that, you're playing with house money.
Negotiation context
- It's been on market 295 days — a 12% lower offer ($1.10M) is reasonable based on typical stale-listing flexibility.
- 2 sale attempts since 23y ago; this cycle's ask has dropped $245k (16%) from the opening price — seller is motivated, your offer sets the floor, not the list.
- Current owner paid $483k; list at $1.25M implies a 159% gain — meaningful room to come down on a strong offer.
Questions for the listing agent
- It's been on market 295 days. Have you received any prior offers? Is the seller open to a 12% concession, seller financing, or rate buy-down credit?
- What does the HOA fee cover, when was the last increase, and are there any pending special assessments or reserve-fund shortfalls?
- Why hasn't it sold? Are there any deal-killer items the seller is aware of (foundation, flood, title, zoning, code violations)?
- Is there a deadline driving the sale (1031 exchange, divorce, estate, relocation)? That informs how much negotiation room exists.
- What's the average days-on-market for RENTAL listings here right now (not sales)? A rising rental-DOM trend means longer vacancies and softer asking-rent achievability than the comps imply.
- What's the recent tenant-quality profile in this submarket — average credit score on applications, eviction rate, late-payment / NSF rate, and stable-employment percentage? A property-management company in the area should have these aggregated.
- How much new for-sale + rental construction is in the pipeline within 1–3 miles? Heavy new supply typically softens prices + rents 12–24 months out; constrained supply supports both.
Investment metrics
- 1% rule
- 2.00% ✓
- Cap rate
- 17.83%
- Cash-on-cash
- 41.19%
- DSCR
- 2.83
- GRM
- 4.2
CMA / ARV
- ARV (median comp)
- $1,333,460
- List price
- $1,250,000
- Delta
- -6.26%
- Verdict
- FAIR
- Comps
- 10 within 1.0 mi
Show comp detail 1 sale within ~0.75 mi
| Address | Dist | Beds/Ba | Sqft | Sold | Price | $/sf | Match |
|---|---|---|---|---|---|---|---|
| 600 Neil Bay Dr | 0.71mi | 3/2.0 | 1,671 (-3%) | 20mo | $825,000 | $494 | 41 |
Match score weights: distance 35% · size 25% · config 20% · recency 20%. Top-matched comps best support the ARV.
Projected returns pro-forma
-3.0% appreciation · 3.0% rent growth · sell at horizon
- IRR
- 37.7%
- Equity multiple
- 2.61×
- Total profit
- $562,400
- Equity at exit
- $186,379
- IRR
- 44.3%
- Equity multiple
- 5.21×
- Total profit
- $1,474,237
- Equity at exit
- $108,077
Cash invested: $350,000 (down + closing). Projections, not guarantees.
Landlord ↔ Tenant lean methodology
- Overall (STATE)
- 28 Tenant-Leaning
- State Washington
- 28 Tenant-Leaning · D+8
- County
- — inherits STATE
- City
- — inherits STATE
ZIP-level market 98250
- Active inventory
- 165
- Price-to-rent
- 4.2×
Monthly cashflow live
- Estimated rent
- $25,000 medium interval (Pro) →
- Mortgage (P&I)
- −$6,555
- Tax from tax record
- −$648 /mo · $7,773/yr
- Insurance
- −$521
- HOA
- −$13
- Vacancy / Maint / Mgmt
- −$5,250
- Net cashflow
- $12,013
Break-even live
UW: 25.0% down · 7.5% · 30yr · 1.5% tax · 5.0% vac · 8.0% maint · 8.0% mgmt
Financing live
Cash to close
- Down payment
- $312,500
- Closing costs
- $37,500
- Reserves months
- —
- Total cash needed
- —
Loan-product check · same deal, 3 products live
Conventional
25% down · 7.5% · 30yr
- Down + closing
- —
- Monthly P&I
- —
- Monthly cashflow
- —
- DSCR
- —
- Eligible?
- —
Personal DTI + credit; lowest rate.
DSCR
20% down · 8.5% · 30yr
- Down + closing
- —
- Monthly P&I
- —
- Monthly cashflow
- —
- DSCR
- —
- Eligible?
- —
No personal income docs; deal must DSCR.
Hard money
10% down · 12.0% · 12mo
- Down + closing
- —
- Monthly P&I
- —
- Monthly cashflow
- —
- DSCR
- —
- Eligible?
- —
Short-term bridge; refi at stabilization.
Rent comps 1 comps
| Address | Beds | Baths | Sqft | Rent | $/sqft | DOM | Units | Dist |
|---|---|---|---|---|---|---|---|---|
| 25 Cobblestone Ln Friday Harbor, WA | 3.0 | 3.5 | 1820 | $25,000 | $13.74 | 43d | 1 | 0.35mi |
HOA detail
- Monthly dues
- $13 · $156/yr
- Likely covers
- waterpool
Listing history 21 events
-
2026-06-18days on market $1,250,000 Active 295 DOM
-
2026-06-17days on market $1,250,000 Active 294 DOM
-
2026-06-16days on market $1,250,000 Active 293 DOM
-
2026-06-15days on market $1,250,000 Active 292 DOM
-
2026-06-15days on market $1,250,000 Active 291 DOM
-
2026-06-13days on market $1,250,000 Active 290 DOM
-
2026-06-12days on market $1,250,000 Active 289 DOM
-
2026-06-09days on market $1,250,000 Active 286 DOM
-
2026-06-08days on market $1,250,000 Active 285 DOM
-
2026-06-08days on market $1,250,000 Active 284 DOM
-
2026-06-05days on market $1,250,000 Active 282 DOM
-
2026-06-03days on market $1,250,000 Active 280 DOM
-
2026-06-02days on market $1,250,000 Active 279 DOM
-
2026-06-01days on market $1,250,000 Active 278 DOM
-
2026-05-31days on market $1,250,000 Active 277 DOM
-
2025-10-29price $1,250,000
-
2025-09-08price $1,445,000
-
2025-08-27$1,495,000 Active
-
2003-10-09soldstatus $483,000
-
2003-10-09soldstatus $483,000
-
2003-03-31$495,000
ⓘ Source: listings_history table (triggers on properties + properties_extension) + one-shot
backfill from property_details.listing_events for pre-trigger history.
Tax reassessment forecast WA · Resets to sale price
- Current annual tax
- $7,773 · $648/mo
- Projected year-2 tax
- $12,250 · $1,021/mo
- Expected delta
- +$4,477/yr (+$373/mo · 57.6%)
ⓘ Screening estimate from a state-policy table — verify with the county assessor before closing.
Climate risk First Street
- Flood 1/10 Low FEMA zone X (unshaded) · 0% chance over 30 yrs
- Wildfire 3/10 Moderate
- Heat 1/10 Low 5 d/yr ≥77°F today · 16 d/yr by 30 yrs out
- Wind 1/10 Low
- Air quality 6/10 Major 7 unhealthy d/yr today · 8 by 30 yrs out
Nearby sold comps map
Loading sold comps map…
Walkable amenities ~0.75 mi
Loading nearby amenities…
Taxation est. · year 1
- Rental income
- $300,000
- − Mortgage interest
- −$70,019
- − Property taxes
- −$7,773
- − Insurance
- −$6,250
- − Repairs & maintenance
- −$24,000
- − Management
- −$24,000
- − HOA
- −$156
- − Depreciation
- −$36,364
- Taxable income
- $131,438
- Est. tax owed @ 24.0%
- −$31,545
- After-tax cash flow
- $112,614/yr
For passive investors: Depreciation is non-cash, so a rental often shows a tax loss while cash-flowing — sheltering income. Rental losses are passive: they offset passive income freely, and up to $25,000/yr can offset ordinary (W-2) income if you actively participate and your MAGI is under $100k (phasing out to $0 by $150k); unused losses carry forward. On sale, claimed depreciation is recaptured at up to 25%, and gains may owe capital-gains tax (a 1031 exchange can defer both). Figures are a year-1 estimate at your 24.0% rate — not tax advice; consult a CPA.
Schools (NCES district)
- District
- San Juan Island School District
- NCES district ID
- 5307650
- Math proficiency
- 61% ▲ 6.00%
- Reading proficiency
- 67% ▬ 0.00%
- Median HH income
- $58,476
- Composite
- 56.64/100
- National rank
- #2434
- State rank
- #36 of 291 in WA
Livability — Roche Harbor
No livability data for this city. (Only ~50 U.S. cities are tracked.)
Census & demographics
- Census place
- Roche Harbor, WA
- Population (ZIP)
- 9,127
Population outlook (San Juan County) Hauer SSP2
- Today (2025)
- 17,439 people
- By 2030
- 17,871 · +2.5%
- By 2040
- 18,236 · +4.6%
- By 2050
- 18,468 · +5.9%
- By 2075
- 19,749 · +13.2%
- By 2100
- 20,348 · +16.7%
Race, ethnicity, and origin ACS 2023
- Neighborhood character
- Predominantly White (84%)
- Race & ethnicity
- White 84% Hispanic / Latino 9% Two or more races 7% Asian 1%
- Hispanic origin (detail)
- Mexican 8%
- Common ancestry
- Slovak 5% Portuguese 5% Lithuanian 4%
- Foreign-born
- 7% · Canada
- Languages at home
- 93% English-only · Spanish 4% Other Indo-European 1% German/W. Germanic 1%
Political lean MEDSL · San Juan
- 2024 margin
- Solid D (+51.4) · D 73.7% · R 22.3% · Other 3.9%
- 2008→2024 swing
- +9.5pp toward D · 2008: 41.9pp · 2024: 51.4pp
- All cycles
- 2024: D+51.4 2020: D+50.5 2016: D+41.6 2012: D+37.5 2008: D+41.9
Not yet ingested
- Civics
- —
Market trends
- HPI YoY
- ▼ -105.89%
- Current HPI
- 187.6787
- Rent YoY
- —
- Metro
- —
- State GDP YoY
- ▲ 4.65%
- F500 in state
- 22
Industry mix (Fortune 500 HQ in WA)
| Industry | F500 HQs | Revenue |
|---|---|---|
| Retail | 2 | $269B |
|
||
| Technology / Retail | 1 | $638B |
|
||
| Technology | 1 | $245B |
|
||
| Telecommunications | 1 | $38B |
|
||
| Food / Beverage | 1 | $36B |
|
||
| Automotive / Trucks | 1 | $34B |
|
||
Price history
+152.5% since first listed6 events — show timeline
- 2025-10-29 Price Changed $1,250,000 NWMLS as Distributed by MLS Grid
- 2025-09-08 Price Changed $1,445,000 NWMLS as Distributed by MLS Grid
- 2025-08-27 Listed $1,495,000 NWMLS as Distributed by MLS Grid
- 2003-10-09 Sold (Public Records) $483,000 Public Records
- 2003-10-09 Sold (MLS) $483,000 NWMLS as Distributed by MLS Grid
- 2003-03-31 Listed $495,000 NWMLS as Distributed by MLS Grid
Property tax history
+4.6%/yrLatest (2026): $7,773 · -3.6% YoY. Source: county tax records.
Cash-flow waterfall
monthlySold comps — $/sqft
last 12 mo · ≤1 miLoading sold comps…