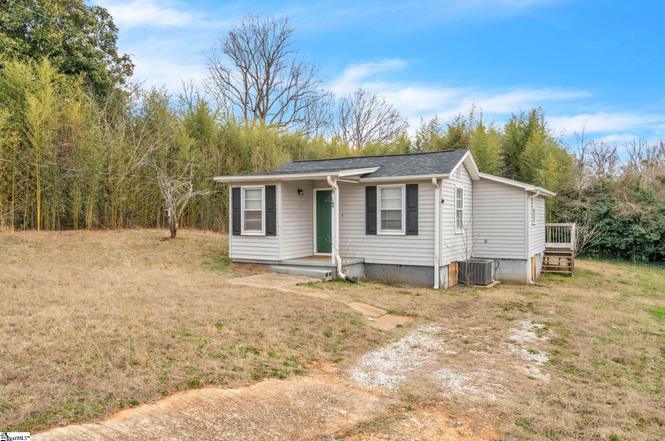
5 Bagwell Ave · Welcome, SC
Flood risk 1/10 · Minimal
- FEMA flood zone
- X (unshaded)
- Chance of flooding over 30 yrs
- 0.0%
- Est. flood insurance / yr
- $507 – $1,088
Fire risk 4/10 · Minor
- Est. fire insurance / yr
- $783 – $1,453
Heat risk 6/10 · Moderate
- Hot days now (above 103°F)
- 7 days/yr
- Hot days in 30 yrs
- 17 days/yr
Wind risk 2/10 · Minimal
- Chance of severe wind over 30 yrs
- 0.0%
Air-quality risk 4/10 · Minor
- Unhealthy air days now
- 4 days/yr
- Unhealthy air days in 30 yrs
- 4 days/yr
Risk factors via First Street. Map © Google.
Why this score? — see what drove the C- grade
The composite is a weighted blend of 9 inputs, each scored 0–100. Each bar is that input's sub-score; the figure is the points it added to the 100-point composite (weight × sub-score).
- Cash flow +19.4/30.0
- ARV discount +7.5/15.0
- DSCR +6.1/10.0
- 1% rule +4.5/10.0
- Schools +4.2/10.0
- Livability +4.0/5.0
- Rent growth +2.9/5.0
- Condition / age +2.5/5.0
- Appreciation +0.0/10.0
$149,990
🖨 Deal sheet 📄 Offer letter ✓ Due diligence
Listing remarks
Affordable homeownership opportunity in Greenville! Conveniently located just off White Horse Road with quick access to I-85, this spacious 1-bedroom, 1-bath home offers an excellent alternative to rising rental costs. The functional layout provides comfortable living space, a practical kitchen, and a generously sized bedroom designed for everyday convenience. Outside, you'll find a usable yard with room to enjoy the outdoors, while the central location keeps shopping, dining, employment centers, and major travel routes just minutes away. Whether you're a first-time homebuyer looking to build equity instead of paying rent or an investor seeking a low-maintenance addition to your portfolio,
Key facts
- Established area
- Usable outdoor space
- Major travel routes
Tags
Property features AI
Finance
- Other: Lead-based paint disclosure required; Residential property disclosure required
- HOA & community: No HOA fees or community amenities
Exterior
- Parking: Driveway parking; Driveway is gravel and paved concrete
- Utilities: Public water; Septic sewer; Electric water heater; Public garbage pickup; No garage
- Home design: Single-story residence; Approximate age 50+ years; Crawl space foundation
- Construction: Vinyl siding exterior; Composition shingle roof
- Exterior features: Front porch; Deck; Level lot; Approximate lot dimensions about 70 x 120; Lot 1/2 acre or less
Interior
- Kitchen: Cooktop (smooth, electric); Electric oven; Refrigerator
- Bedrooms: Primary bedroom on main level with tub/shower; Main level bedroom (1) — approx. 10 x 12
- Flooring: Vinyl
- Bathrooms: One full bathroom on the main level
- Heating & cooling: Forced air heat (electric); Heat pump; Central electric cooling
- Interior features: Ceiling fan; No fireplace
- Laundry & utility: Laundry on 1st floor; Washer connection; Electric dryer hookup
Neighborhood map
What this means for you Summary
Snapshot
- This is a 2-bed/1.0-bath single-family listed at $150k.
Deal economics
- At list price, monthly cash flow is $169 ($2k/yr) — positive.
- The deal already cash-flows at list — no discount required.
- To meet the 1% rule (rent ≥ 1% of price), the offer needs to be $143k (4.6% below list).
- Recommended offer: $136k (9.0% below list) — sets the bar for market timing.
- Cap rate 7.6% vs local median 5.5% in Welcome — top-decile yield for the area; either an underpriced asset or a hidden risk that comps aren't pricing in. Stress-test before assuming the spread holds.
Location & tenants
- Location reads 81/100 on livability (#5 in SC, #1,321 nationally) — a professional / high-income tenant draw. Strengths: commute A+, cost of living A+, housing A+; Watch: employment C-, crime D+.
- Greenville 01 (suburban): math 44% / reading 54% proficiency, ranked #10 of 80 in SC (top 12%) — families likely to look elsewhere, expect single-tenant / working-renter base with shorter leases.
- Zoned schools: Welcome Elementary (math 39% / reading 41%, grade F, #292 of 597 statewide, top 49%, 652 students, 100% FRL) — zoned schools average 100% FRL vs 42% district-wide (58 pts higher); higher-poverty schools than district average — tighter screening recommended.
- Market conditions: Rents rising (+1.7%/yr); 278 active listings in the ZIP; 3 comparable units currently listed for rent nearby; rentals at typical pace (median 21d on market — plan ~3-4 weeks tenant-placement turnaround); 5,595 units permitted in Greenville County in 2024 (566 in 5+ unit buildings).
- This rent runs 33% of the median local income ($52k/yr) — at the standard rent-burdened threshold; future hikes will face affordability resistance.
Forward outlook
- Local home prices are declining (-3.0%/yr); year-one equity from $1k of loan paydown is wiped out by about $4k of value loss. Plan a longer hold.
- Greenville County population projected at +34% by 2050 — long-run rental-demand tailwind backs the buy-and-hold thesis.
Negotiation context
- It's been on market 112 days — a 9% lower offer ($136k) is reasonable based on typical stale-listing flexibility.
- 8 sale attempts since 20y ago; this cycle's ask has dropped $9k (6%) from the opening price — seller is motivated, your offer sets the floor, not the list.
- Current owner paid $50k; list at $150k implies a 203% gain — meaningful room to come down on a strong offer.
Risks & watch-outs
- Climate carrying-cost: extreme-heat days projected 7→17/yr by 2055 (HVAC capex compounding) — expect insurance premiums to compound above CPI over the hold.
Questions for the listing agent
- It's been on market 112 days. Have you received any prior offers? Is the seller open to a 9% concession, seller financing, or rate buy-down credit?
- Built in 1965 — when were the roof, HVAC, electrical panel, plumbing, and water heater last replaced?
- Why hasn't it sold? Are there any deal-killer items the seller is aware of (foundation, flood, title, zoning, code violations)?
- Is there a deadline driving the sale (1031 exchange, divorce, estate, relocation)? That informs how much negotiation room exists.
- Schools are D-rated, which usually means shorter tenancies and higher turnover. Who's the typical renter profile here, and what's been the actual vacancy rate?
- Crime grade is D in this area — have there been break-ins, vandalism, or insurance claims at this property in the last 3 years? What carrier currently insures it and at what premium?
- What's the average days-on-market for RENTAL listings here right now (not sales)? A rising rental-DOM trend means longer vacancies and softer asking-rent achievability than the comps imply.
- What's the recent tenant-quality profile in this submarket — average credit score on applications, eviction rate, late-payment / NSF rate, and stable-employment percentage? A property-management company in the area should have these aggregated.
- How much new for-sale + rental construction is in the pipeline within 1–3 miles? Heavy new supply typically softens prices + rents 12–24 months out; constrained supply supports both.
Investment metrics
- 1% rule
- 0.95% ✗
- Cap rate
- 7.64%
- Cash-on-cash
- 4.82%
- DSCR
- 1.21
- GRM
- 8.7
CMA / ARV
No comps found within radius.
Projected returns pro-forma
-3.0% appreciation · 1.72% rent growth · sell at horizon
- IRR
- -10.2%
- Equity multiple
- 0.63×
- Total profit
- $-15,399
- Equity at exit
- $22,364
- IRR
- -2.6%
- Equity multiple
- 0.83×
- Total profit
- $-6,942
- Equity at exit
- $12,968
Cash invested: $41,997 (down + closing). Projections, not guarantees.
Landlord ↔ Tenant lean methodology
- Overall (STATE)
- 90 Strongly Landlord-Friendly
- State South Carolina
- 90 Strongly Landlord-Friendly · R+6
- County
- — inherits STATE
- City
- — inherits STATE
ZIP-level market 29611
- Home prices YoY
- -34.6%
- Rents YoY
- 1.7%
- Active inventory
- 278
- Price-to-rent
- 8.7×
Monthly cashflow live
- Estimated rent
- $1,430 medium interval (Pro) →
- Mortgage (P&I)
- −$787
- Tax from tax record
- −$112 /mo · $1,346/yr
- Insurance
- −$62
- HOA
- −$0
- Vacancy / Maint / Mgmt
- −$300
- Net cashflow
- $169
Break-even live
UW: 25.0% down · 7.5% · 30yr · 1.5% tax · 5.0% vac · 8.0% maint · 8.0% mgmt
Financing live
Cash to close
- Down payment
- $37,498
- Closing costs
- $4,500
- Reserves months
- —
- Total cash needed
- —
Loan-product check · same deal, 3 products live
Conventional
25% down · 7.5% · 30yr
- Down + closing
- —
- Monthly P&I
- —
- Monthly cashflow
- —
- DSCR
- —
- Eligible?
- —
Personal DTI + credit; lowest rate.
DSCR
20% down · 8.5% · 30yr
- Down + closing
- —
- Monthly P&I
- —
- Monthly cashflow
- —
- DSCR
- —
- Eligible?
- —
No personal income docs; deal must DSCR.
Hard money
10% down · 12.0% · 12mo
- Down + closing
- —
- Monthly P&I
- —
- Monthly cashflow
- —
- DSCR
- —
- Eligible?
- —
Short-term bridge; refi at stabilization.
Rent comps 3 comps
| Address | Beds | Baths | Sqft | Rent | $/sqft | DOM | Units | Dist |
|---|---|---|---|---|---|---|---|---|
| 1006 S Welcome Rd Unit B Greenville, SC | 1.0 | 1.0 | 374 | $1,095 | $2.93 | 21d | 1 | 1.33mi |
| 237 Vantage Way Powdersville, SC | 1.0 | 1.0 | 617 | $1,195 | $1.94 | 23d | 1 | 1.44mi |
| 3 Vantage Way Greenville, SC | 1.0–3.0 | 1.0–2.0 | 884 | $1,630 | $1.84 | 2d | 18 | 1.50mi |
Listing history 39 events
-
2026-06-19remarks 699-char remark
-
2026-06-18days on market $149,990 Active 112 DOM
-
2026-06-17days on market $149,990 Active 111 DOM
-
2026-06-16days on market $149,990 Active 110 DOM
-
2026-06-15days on market $149,990 Active 109 DOM
-
2026-06-13days on market $149,990 Active 107 DOM
-
2026-06-13days on market $149,990 Active 106 DOM
-
2026-06-10days on market $149,990 Active 104 DOM
-
2026-06-09days on market $149,990 Active 103 DOM
-
2026-06-08days on market $149,990 Active 102 DOM
-
2026-06-07days on market $149,990 Active 101 DOM
-
2026-06-03days on market $149,990 Active 97 DOM
-
2026-06-03days on market $149,990 Active 96 DOM
-
2026-06-01days on market $149,990 Active 95 DOM
-
2026-05-31days on market $149,990 Active 94 DOM
-
2026-03-18price $149,990
-
2026-02-26$159,000 Active
-
2024-10-03historical
-
2024-07-06historical Contingency Contract
-
2024-06-24$147,900 Active
-
2024-06-24historical
-
2024-05-11price $159,900
-
2024-05-10status Active
-
2024-05-10price $160,000
-
2024-05-10historical
-
2024-03-23historical Contingency Contract
-
2024-03-20$149,900 Active
-
2024-03-06historical
-
2024-02-27price $149,900
-
2023-12-22status Active
-
2023-12-22status Pending
-
2023-12-18status Contingency Contract
-
2023-12-11historical
-
2023-09-29$154,900 Active
-
2022-11-22soldstatus $49,500
-
2007-02-27historical
-
2006-11-27$19,000
-
1992-01-31soldstatus $12,000
-
1983-08-05soldstatus $3,500
ⓘ Source: listings_history table (triggers on properties + properties_extension) + one-shot
backfill from property_details.listing_events for pre-trigger history.
Tax reassessment forecast SC · Resets to sale price
- Current annual tax
- $1,346 · $112/mo
- Projected year-2 tax
- $1,346 · $112/mo
- Expected delta
- $0/yr ($0/mo · 0.0%)
ⓘ Screening estimate from a state-policy table — verify with the county assessor before closing.
Climate risk First Street
- Flood 1/10 Low FEMA zone X (unshaded) · 0% chance over 30 yrs
- Wildfire 4/10 Moderate
- Heat 6/10 Major 7 d/yr ≥103°F today · 17 d/yr by 30 yrs out
- Wind 2/10 Low 0% chance of damaging wind over 30 yrs
- Air quality 4/10 Moderate 4 unhealthy d/yr today · 4 by 30 yrs out
Nearby sold comps map
Loading sold comps map…
Walkable amenities ~0.75 mi
Loading nearby amenities…
Taxation est. · year 1
- Rental income
- $17,164
- − Mortgage interest
- −$8,402
- − Property taxes
- −$1,346
- − Insurance
- −$750
- − Repairs & maintenance
- −$1,373
- − Management
- −$1,373
- − Depreciation
- −$4,363
- Taxable loss
- −$443
- Est. tax savings @ 24.0%
- +$106
- After-tax cash flow
- $2,132/yr
For passive investors: Depreciation is non-cash, so a rental often shows a tax loss while cash-flowing — sheltering income. Rental losses are passive: they offset passive income freely, and up to $25,000/yr can offset ordinary (W-2) income if you actively participate and your MAGI is under $100k (phasing out to $0 by $150k); unused losses carry forward. On sale, claimed depreciation is recaptured at up to 25%, and gains may owe capital-gains tax (a 1031 exchange can defer both). Figures are a year-1 estimate at your 24.0% rate — not tax advice; consult a CPA.
Schools (NCES district)
- District
- Greenville 01
- NCES district ID
- 4502310
- Math proficiency
- 44% ▼ -10.00%
- Reading proficiency
- 54% ▼ -2.00%
- Median HH income
- $49,596
- Composite
- 41.88/100
- National rank
- #3370
- State rank
- #10 of 80 in SC
Livability — Welcome
- Score
- 81/100
- State rank
- #5
- US rank
- #1321
Category grades
Schools grade is shown separately in the Schools card above.
Census & demographics
- Census place
- Welcome, SC
- County
- Greenville County · 573,815 people
- City population
- 33,387
- Metro
- Greenville-Anderson, SC
- Population (ZIP)
- 32,365
- Household income
- $51,565
- Rent vs Own
- Severe rent burden
- 1754.0
Population outlook (Greenville County) Hauer SSP2
- Today (2025)
- 574,580 people
- By 2030
- 615,615 · +7.1%
- By 2040
- 695,373 · +21.0%
- By 2050
- 769,367 · +33.9%
- By 2075
- 933,296 · +62.4%
- By 2100
- 1,029,196 · +79.1%
Race, ethnicity, and origin ACS 2023
- Neighborhood character
- Highly diverse neighborhood (Simpson 0.70)
- Race & ethnicity
- White 41% Black 29% Hispanic / Latino 22% Two or more races 12%
- Hispanic origin (detail)
- Mexican 12% Puerto Rican 2%
- Common ancestry
- Slovak 1% Italian 1% Serbian 1%
- Foreign-born
- 12% · Canada, Jamaica, China
- Languages at home
- 79% English-only · Spanish 19% Russian/Polish/Slavic 1%
Political lean MEDSL · Greenville
- 2024 margin
- Strong R (+22.2) · D 38.0% · R 60.2% · Other 1.8%
- 2008→2024 swing
- +1.7pp toward D · 2008: -23.9pp · 2024: -22.2pp
- All cycles
- 2024: R+22.2 2020: R+18.2 2016: R+24.7 2012: R+27.8 2008: R+23.9
Not yet ingested
- Civics
- —
Market trends
- HPI YoY
- ▼ -139.58%
- Current HPI
- 264.2891
- Rent YoY
- ▲ 1.72%
- Metro
- Greenville-Anderson, SC
- State GDP YoY
- ▲ 4.51%
- F500 in state
- 2
Industry mix (Fortune 500 HQ in SC)
| Industry | F500 HQs | Revenue |
|---|---|---|
| Packaging | 1 | $7B |
|
||
Price history
+4185.4% since first listed24 events — show timeline
- 2026-03-18 Price Changed $149,990 Greater Greenville MLS
- 2026-02-26 Listed $159,000 Greater Greenville MLS
- 2024-10-03 Listing Removed — Greater Greenville MLS
- 2024-07-06 Contingent — Greater Greenville MLS
- 2024-06-24 Listing Removed — Greater Greenville MLS
- 2024-06-24 Listed $147,900 Greater Greenville MLS
- 2024-05-11 Price Changed $159,900 Greater Greenville MLS
- 2024-05-10 Relisted — Greater Greenville MLS
- 2024-05-10 Listing Removed — Greater Greenville MLS
- 2024-05-10 Price Changed $160,000 Greater Greenville MLS
- 2024-03-23 Contingent — Greater Greenville MLS
- 2024-03-20 Listed $149,900 Greater Greenville MLS
- 2024-03-06 Listing Removed — Greater Greenville MLS
- 2024-02-27 Price Changed $149,900 Greater Greenville MLS
- 2023-12-22 Relisted — Greater Greenville MLS
- 2023-12-22 Pending — Greater Greenville MLS
- 2023-12-18 Relisted — Greater Greenville MLS
- 2023-12-11 Listing Removed — Greater Greenville MLS
- 2023-09-29 Listed $154,900 Greater Greenville MLS
- 2022-11-22 Sold (Public Records) $49,500 Public Records
- 2007-02-27 Listing Removed — Greater Greenville MLS
- 2006-11-27 Listed $19,000 Greater Greenville MLS
- 1992-01-31 Sold (Public Records) $12,000 Public Records
- 1983-08-05 Sold (Public Records) $3,500 Public Records
Property tax history
+2.7%/yrLatest (2025): $1,346 · +3.0% YoY. Source: county tax records.
Cash-flow waterfall
monthlySold comps — $/sqft
last 12 mo · ≤1 miLoading sold comps…