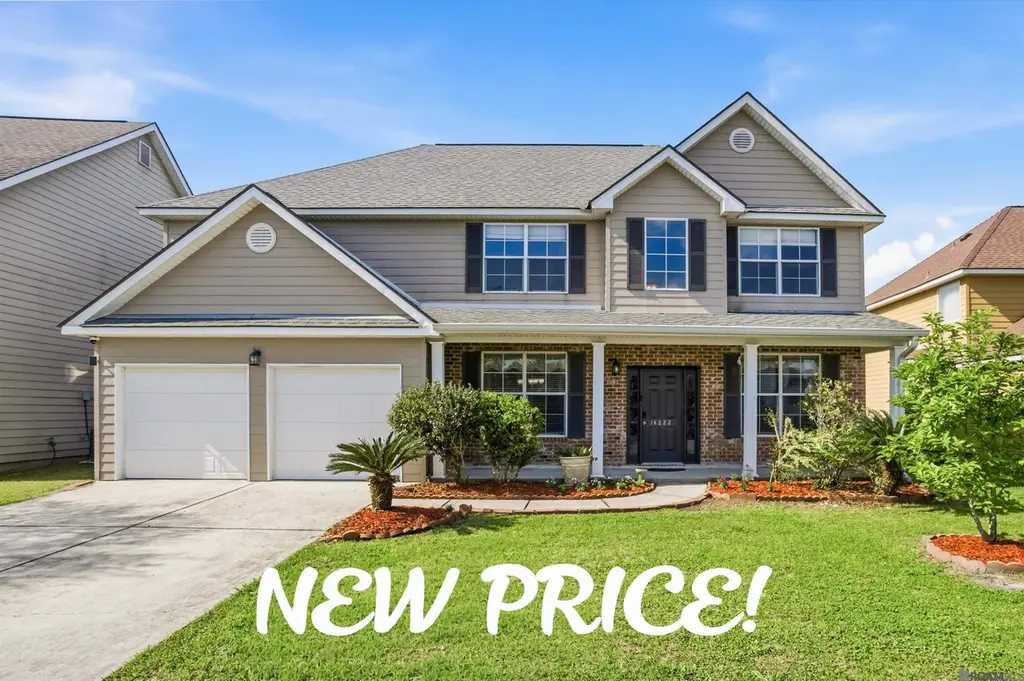
14222 Cedar Pointe Ave · Baton Rouge, LA
Flood risk 1/10 · Minimal
- FEMA flood zone
- AE
- Chance of flooding over 30 yrs
- 0.0%
- Est. flood insurance / yr
- $1,737 – $8,500
Fire risk 1/10 · Minimal
- Est. fire insurance / yr
- $1,269 – $2,357
Heat risk 8/10 · Major
- Hot days now (above 108°F)
- 7 days/yr
- Hot days in 30 yrs
- 21 days/yr
Wind risk 9/10 · Severe
- Chance of severe wind over 30 yrs
- 99.0%
Air-quality risk 3/10 · Minor
- Unhealthy air days now
- 2 days/yr
- Unhealthy air days in 30 yrs
- 3 days/yr
Risk factors via First Street. Map © Google.
Why this score? — see what drove the B grade
The composite is a weighted blend of 9 inputs, each scored 0–100. Each bar is that input's sub-score; the figure is the points it added to the 100-point composite (weight × sub-score).
- Cash flow +28.3/30.0
- ARV discount +15.0/15.0
- DSCR +10.0/10.0
- 1% rule +7.4/10.0
- Livability +3.7/5.0
- Rent growth +3.0/5.0
- Condition / age +2.5/5.0
- Schools +2.4/10.0
- Appreciation +0.0/10.0
$325,000
🖨 Deal sheet (PDF) 📄 Offer letter ✓ Due diligence
Listing remarks
Welcome to 14222 Cedar Pointe Ave — Elegant Living in Baton Rouge! This stunning two-story home offers 2,775 sq ft of beautifully appointed living space with 4 bedrooms, 3 full bathrooms, and a thoughtfully designed open floor plan perfect for both everyday living and entertaining. The classic brick-and-siding exterior, covered front porch, manicured landscaping, and two-car garage create outstanding curb appeal. Inside, a soaring two-story foyer with decorative stained glass sidelights welcomes you home. Adjacent to the foyer is a formal living room — ideal as a sitting room or private home office — featuring crown molding, wainscoting, and an elegant chandelier. The open
Key facts
- Wainscoting
- Open floor plan
- Formal living room
Tags
Property features AI
Finance
- Other: Subdivision: Cloverhill
- HOA & community: Homeowners association with an annual fee of $200 (about $16.67/month)
Exterior
- Parking: 2 parking spaces; Attached garage with garage door opener
- Security: Security system; Smoke detectors
- Utilities: Public water; Public sewer; Cable available
- Home design: Detached single-family residence; 2 stories
- Construction: Brick and frame construction; Composition roof; Slab foundation; Built on a 0.19-acre lot (approximate)
- Exterior features: Front porch; Privacy fencing (full fenced); Level lot
Interior
- Kitchen: Gas cooktop; Range; Oven; Dishwasher; Disposal
- Flooring: Tile; Wood; Ceramic tile
- Bathrooms: 3 full bathrooms
- Heating & cooling: Central heating; Central air conditioning; Ceiling fans
- Interior features: Vaulted ceilings; Walk-in closets; Built-in features; Beamed ceilings; Crown molding; High ceilings; Gas-log fireplace
- Laundry & utility: Washer hookup inside; Electric dryer hookup
Neighborhood map
What this means for you Summary
Snapshot
- This is a 4-bed/3.0-bath single-family listed at $325k.
Deal economics
- At list price, monthly cash flow is $619 ($7k/yr) — positive.
- The deal already cash-flows at list — no discount required.
- Meets the 1% rule at list price ($4k rent vs $325k).
- Recommended offer: $320k (1.5% below list) — sets the bar for market timing.
- Cap rate 10.2% vs local median 4.3% in Baton Rouge — top-decile yield for the area; either an underpriced asset or a hidden risk that comps aren't pricing in. Stress-test before assuming the spread holds.
Location & tenants
- Location reads 74/100 on livability (#24 in LA, #4,535 nationally) — a middle-class / working-renter tenant base. Strengths: commute A+, cost of living A+, health & safety A+; Watch: amenities D, crime F, employment D-.
- East Baton Rouge Parish (urban): math 22% / reading 34% proficiency, ranked #47 of 98 in LA (top 48%) — low school quality limits family demand, transient renter base, plan for 1-2y turnover; 77% free/reduced lunch — lower-income household profile, screen leases tightly.
- Market conditions: Rents rising (+2.2%/yr); 254 active listings in the ZIP; 3 comparable units currently listed for rent nearby; rentals at typical pace (median 24d on market — plan ~3-4 weeks tenant-placement turnaround); solid renter incomes; 2,252 units permitted in East Baton Rouge Parish in 2024 (440 in 5+ unit buildings).
- At $4,027/mo this rent would consume 60% of the median local household income ($80k/yr) (locally 830% of renters already pay >50% of income on rent) — very limited rent-growth headroom before tenants either downsize or default.
Forward outlook
- Local home prices are declining (-3.0%/yr); year-one equity from $2k of loan paydown is wiped out by about $10k of value loss. Plan a longer hold.
- East Baton Rouge County population projected at +4% by 2050 — modest demand growth; plan on rents tracking national, not racing it.
Negotiation context
- It's been on market 30 days — a 2% lower offer ($320k) is reasonable based on typical stale-listing flexibility.
- 12 sale attempts since 21y ago with the ask held roughly flat each time — persistent listings suggest the price (not the market) is what's stuck; bring a comps-based counter.
- Current owner paid $225k; 44% above their basis — modest negotiation headroom, anchor on the comps not their cost.
Risks & watch-outs
- Watch-outs: flood insurance adds $427/mo.
- Climate carrying-cost: in FEMA flood zone AE (mandatory federal flood insurance); severe wind risk, 99% chance of damaging wind over 30y; extreme-heat days projected 7→21/yr by 2055 (HVAC capex compounding) — expect insurance premiums to compound above CPI over the hold.
Questions for the listing agent
- What's the actual annual flood-insurance premium (NFIP or private), and is the property in a SFHA with mandatory coverage?
- What does the HOA fee cover, when was the last increase, and are there any pending special assessments or reserve-fund shortfalls?
- Is there a deadline driving the sale (1031 exchange, divorce, estate, relocation)? That informs how much negotiation room exists.
- Crime grade is F in this area — have there been break-ins, vandalism, or insurance claims at this property in the last 3 years? What carrier currently insures it and at what premium?
- What's the average days-on-market for RENTAL listings here right now (not sales)? A rising rental-DOM trend means longer vacancies and softer asking-rent achievability than the comps imply.
- What's the recent tenant-quality profile in this submarket — average credit score on applications, eviction rate, late-payment / NSF rate, and stable-employment percentage? A property-management company in the area should have these aggregated.
- How much new for-sale + rental construction is in the pipeline within 1–3 miles? Heavy new supply typically softens prices + rents 12–24 months out; constrained supply supports both.
Investment metrics
- 1% rule
- 1.24% ✓
- Cap rate
- 10.15%
- Cash-on-cash
- 13.79%
- DSCR
- 1.61
- GRM
- 6.7
CMA / ARV
- ARV (on-the-fly)
- $412,381
- Comps found
- 2
Show comp detail 2 sales within ~0.75 mi
| Address | Dist | Beds/Ba | Sqft | Sold | Price | $/sf | Match |
|---|---|---|---|---|---|---|---|
| 10043 High Pines Dr | 0.14mi | 5/3.0 (+1) | 2,821 (+3%) | 19mo | $339,000 | $120 | 67 |
| 9044 Thistle Ridge Dr | 0.69mi | 3/2.5 (-1) | 2,480 (-9%) | 15mo | $375,000 | $151 | 33 |
Match score weights: distance 35% · size 25% · config 20% · recency 20%. Top-matched comps best support the ARV.
Projected returns pro-forma
-3.0% appreciation · 2.16% rent growth · sell at horizon
- IRR
- -4.9%
- Equity multiple
- 0.82×
- Total profit
- $-16,346
- Equity at exit
- $48,459
- IRR
- 3.8%
- Equity multiple
- 1.26×
- Total profit
- $23,967
- Equity at exit
- $28,100
Cash invested: $91,000 (down + closing). Projections, not guarantees.
Landlord ↔ Tenant lean methodology
- Overall (STATE)
- 90 Strongly Landlord-Friendly
- State Louisiana
- 90 Strongly Landlord-Friendly · R+12
- County
- — inherits STATE
- City
- — inherits STATE
ZIP-level market 70809
- Rents YoY
- 2.2%
- Active inventory
- 254
- Price-to-rent
- 6.7×
Monthly cashflow live
- Estimated rent
- $4,027 medium interval (Pro) →
- Mortgage (P&I)
- −$1,704
- Tax from tax record
- −$279 /mo · $3,349/yr
- Insurance
- −$135
- Flood insurance flood zone
- −$427 /mo · $5,118/yr
- HOA
- −$17
- Vacancy / Maint / Mgmt
- −$846
- Net cashflow
- $619
Break-even live
Sensitivity live
| Price | -10% $803 | -5% $711 | +0% $619 | +5% $527 | +10% $435 |
|---|---|---|---|---|---|
| Rent | -10% $301 | -5% $460 | +0% $619 | +5% $778 | +10% $937 |
| Rate | -1.0pp $783 | -0.5pp $702 | base $619 | +0.5pp $535 | +1.0pp $449 |
UW: 25.0% down · 7.5% · 30yr · 1.5% tax · 5.0% vac · 8.0% maint · 8.0% mgmt
Financing live
Cash to close
- Down payment
- $81,250
- Closing costs
- $9,750
- Reserves months
- —
- Total cash needed
- —
Loan-product check · same deal, 3 products live
Conventional
25% down · 7.5% · 30yr
- Down + closing
- —
- Monthly P&I
- —
- Monthly cashflow
- —
- DSCR
- —
- Eligible?
- —
Personal DTI + credit; lowest rate.
DSCR
20% down · 8.5% · 30yr
- Down + closing
- —
- Monthly P&I
- —
- Monthly cashflow
- —
- DSCR
- —
- Eligible?
- —
No personal income docs; deal must DSCR.
Hard money
10% down · 12.0% · 12mo
- Down + closing
- —
- Monthly P&I
- —
- Monthly cashflow
- —
- DSCR
- —
- Eligible?
- —
Short-term bridge; refi at stabilization.
Rent comps 3 comps
| Address | Beds | Baths | Sqft | Rent | $/sqft | DOM | Units | Dist |
|---|---|---|---|---|---|---|---|---|
| 16756 Amberwood Dr Baton Rouge, LA | 3.0 | 3.5 | 3522 | $5,500 | $1.56 | 24d | 1 | 1.14mi |
| 7671 Dearborne Dr Baton Rouge, LA | 3.0 | 2.0 | 1886 | $4,000 | $2.12 | 24d | 1 | 1.20mi |
| 17951 Grand Cypress Creek Ave Baton Rouge, LA | 3.0 | 2.0 | 2880 | $5,000 | $1.74 | 19d | 1 | 1.47mi |
HOA detail
- Monthly dues
- $17 · $204/yr
- Likely covers
- landscaping
Listing history 34 events
-
2026-06-18days on market $325,000 Active 30 DOM
-
2026-06-17days on market $325,000 Active 29 DOM
-
2026-06-16days on market $325,000 Active 28 DOM
-
2026-06-15days on market $325,000 Active 27 DOM
-
2026-06-14days on market $325,000 Active 25 DOM
-
2026-06-10days on market $325,000 Active 22 DOM
-
2026-06-09days on market $325,000 Active 21 DOM
-
2026-06-08days on market $325,000 Active 20 DOM
-
2026-06-07days on market $325,000 Active 19 DOM
-
2026-06-05days on market $325,000 Active 16 DOM
-
2026-06-03days on market $325,000 Active 15 DOM
-
2026-06-02days on market $325,000 Active 14 DOM
-
2026-06-01days on market $325,000 Active 13 DOM
-
2026-05-31days on market $325,000 Active 12 DOM
-
2026-05-31days on market $325,000 Active 11 DOM
-
2026-05-19$325,000 Active
-
2026-05-19$325,000 Active
-
2026-05-15price $325,000
-
2026-05-15price $325,000
-
2026-04-13price $339,000
-
2026-04-13price $339,000
-
2026-03-30$349,000 Active
-
2026-03-30$349,000 Active
-
2014-03-24soldstatus $225,000
-
2014-03-21soldstatus
-
2014-01-30$233,900
-
2014-01-30$233,900
-
2013-07-29$233,900
-
2013-07-29$233,900
-
2013-06-02$247,000
-
2013-06-02$247,000
-
2005-09-09soldstatus
-
2005-03-13$195,670
-
2005-03-13$195,670
ⓘ Source: listings_history table (triggers on properties + properties_extension) + one-shot
backfill from property_details.listing_events for pre-trigger history.
Tax reassessment forecast LA · Resets to sale price
- Current annual tax
- $3,349 · $279/mo
- Projected year-2 tax
- $3,349 · $279/mo
- Expected delta
- $0/yr ($0/mo · 0.0%)
ⓘ Screening estimate from a state-policy table — verify with the county assessor before closing.
Climate risk First Street
- Flood 1/10 Low FEMA zone AE · 0% chance over 30 yrs
- Wildfire 1/10 Low
- Heat 8/10 Severe 7 d/yr ≥108°F today · 21 d/yr by 30 yrs out
- Wind 9/10 Extreme 99% chance of damaging wind over 30 yrs
- Air quality 3/10 Moderate 2 unhealthy d/yr today · 3 by 30 yrs out
Nearby sold comps map
Loading sold comps map…
Walkable amenities ~0.75 mi
Loading nearby amenities…
Taxation est. · year 1
- Rental income
- $48,328
- − Mortgage interest
- −$18,205
- − Property taxes
- −$3,349
- − Insurance
- −$6,744
- − Repairs & maintenance
- −$3,866
- − Management
- −$3,866
- − HOA
- −$204
- − Depreciation
- −$9,455
- Taxable income
- $2,639
- Est. tax owed @ 24.0%
- −$633
- After-tax cash flow
- $6,797/yr
For passive investors: Depreciation is non-cash, so a rental often shows a tax loss while cash-flowing — sheltering income. Rental losses are passive: they offset passive income freely, and up to $25,000/yr can offset ordinary (W-2) income if you actively participate and your MAGI is under $100k (phasing out to $0 by $150k); unused losses carry forward. On sale, claimed depreciation is recaptured at up to 25%, and gains may owe capital-gains tax (a 1031 exchange can defer both). Figures are a year-1 estimate at your 24.0% rate — not tax advice; consult a CPA.
Schools (NCES district)
- District
- East Baton Rouge Parish
- NCES district ID
- 2200540
- Math proficiency
- 22% ▼ -36.00%
- Reading proficiency
- 34% ▼ -31.00%
- Median HH income
- $46,263
- Composite
- 24.14/100
- National rank
- #7745
- State rank
- #47 of 98 in LA
Livability — Baton Rouge
- Score
- 74/100
- State rank
- #24
- US rank
- #4535
Category grades
Schools grade is shown separately in the Schools card above.
Census & demographics
- County
- East Baton Rouge Parish · 399,686 people
- City population
- 351,868
- Metro
- Baton Rouge, LA
- Population (ZIP)
- 25,732
- Household income
- $79,967
- Rent vs Own
- Severe rent burden
- 830.0
Population outlook (East Baton Rouge County) Hauer SSP2
- Today (2025)
- 464,810 people
- By 2030
- 472,137 · +1.6%
- By 2040
- 480,243 · +3.3%
- By 2050
- 484,422 · +4.2%
- By 2075
- 492,069 · +5.9%
- By 2100
- 476,347 · +2.5%
Race, ethnicity, and origin ACS 2023
- Neighborhood character
- Diverse neighborhood (Simpson 0.56)
- Race & ethnicity
- White 62% Black 23% Two or more races 7% Hispanic / Latino 6% Asian 4%
- Hispanic origin (detail)
- Mexican 2%
- Common ancestry
- Lithuanian 13% Italian 2% Serbian 1%
- Foreign-born
- 8% · Canada, Vietnam
- Languages at home
- 89% English-only · Spanish 4% Other Indo-European 2% Arabic 2%
Political lean MEDSL · East Baton Rouge
- 2024 margin
- D (+11.1) · D 54.5% · R 43.4% · Other 2.1%
- 2008→2024 swing
- +8.9pp toward D · 2008: 2.2pp · 2024: 11.1pp
- All cycles
- 2024: D+11.1 2020: D+13.1 2016: D+9.2 2012: D+5.2 2008: D+2.2
Not yet ingested
- Civics
- —
Market trends
- HPI YoY
- ▼ -205.49%
- Current HPI
- 154.7018
- Rent YoY
- ▲ 2.16%
- Metro
- Baton Rouge, LA
- State GDP YoY
- ▲ 3.29%
- F500 in state
- 10
Industry mix (Fortune 500 HQ in LA)
| Industry | F500 HQs | Revenue |
|---|---|---|
| Telecommunications | 2 | $23B |
|
||
| Utilities | 1 | $12B |
|
||
| Wholesale / Distribution | 1 | $5B |
|
||
| Advertising | 1 | $2B |
|
||
Price history
+66.1% since first listed19 events — show timeline
- 2026-05-19 Listed $325,000 GBRMLS
- 2026-05-19 Listed $325,000 AcadianaMLS
- 2026-05-15 Price Changed $325,000 AcadianaMLS
- 2026-05-15 Price Changed $325,000 GBRMLS
- 2026-04-13 Price Changed $339,000 AcadianaMLS
- 2026-04-13 Price Changed $339,000 GBRMLS
- 2026-03-30 Listed $349,000 GBRMLS
- 2026-03-30 Listed $349,000 AcadianaMLS
- 2014-03-24 Sold (Public Records) $225,000 Public Records
- 2014-03-21 Sold (MLS) — GBRMLS
- 2014-01-30 Listed $233,900 GBRMLS
- 2014-01-30 Listed $233,900 AcadianaMLS
- 2013-07-29 Listed $233,900 AcadianaMLS
- 2013-07-29 Listed $233,900 GBRMLS
- 2013-06-02 Listed $247,000 AcadianaMLS
- 2013-06-02 Listed $247,000 GBRMLS
- 2005-09-09 Sold (MLS) — GBRMLS
- 2005-03-13 Listed $195,670 GBRMLS
- 2005-03-13 Listed $195,670 AcadianaMLS
Property tax history
+7.5%/yrLatest (2025): $3,349 · -0.5% YoY. Source: county tax records.
Cash-flow waterfall
monthlySold comps — $/sqft
last 12 mo · ≤1 miLoading sold comps…