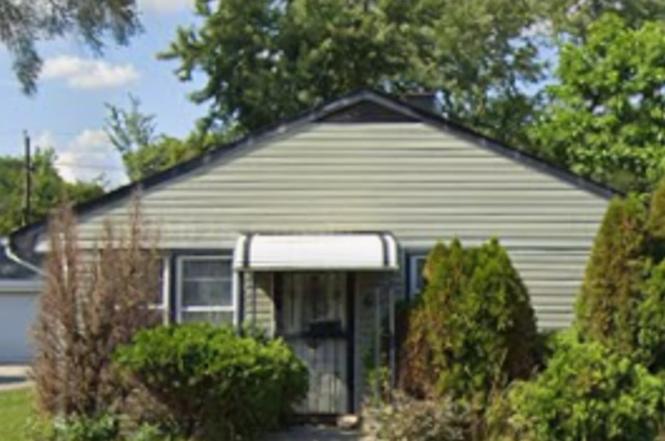
63 W 141st St · Dixmoor, IL
Flood risk 1/10 · Minimal
- FEMA flood zone
- X (unshaded)
- Chance of flooding over 30 yrs
- 0.0%
- Est. flood insurance / yr
- $473 – $860
Fire risk 1/10 · Minimal
- Est. fire insurance / yr
- $804 – $1,492
Heat risk 3/10 · Minor
- Hot days now (above 102°F)
- 7 days/yr
- Hot days in 30 yrs
- 15 days/yr
Wind risk 2/10 · Minimal
- Chance of severe wind over 30 yrs
- —
Air-quality risk 3/10 · Minor
- Unhealthy air days now
- 4 days/yr
- Unhealthy air days in 30 yrs
- 4 days/yr
Risk factors via First Street. Map © Google.
Why this score? — see what drove the C- grade
The composite is a weighted blend of 9 inputs, each scored 0–100. Each bar is that input's sub-score; the figure is the points it added to the 100-point composite (weight × sub-score).
- ARV discount +15.0/15.0
- Cash flow +10.0/30.0
- Appreciation +10.0/10.0
- 1% rule +4.3/10.0
- Livability +3.8/5.0
- DSCR +2.8/10.0
- Rent growth +2.5/5.0
- Condition / age +2.5/5.0
- Schools +0.7/10.0
$135,000
🖨 Deal sheet 📄 Offer letter ✓ Due diligence
Listing remarks
Welcome to this 2-bedroom, 1-bath ranch in Dixmoor offering a great opportunity for investors, rehabbers, or buyers looking to add their personal touch. This property is being sold AS-IS, WHERE-IS and features a functional layout with plenty of potential. Conveniently located near parks, schools, shopping, and major transportation routes. Bring your ideas and vision to make this home your own. Schedule your showing today!
Key facts
- 7,154 sq ft lot
- 2 garage spots
- Built 1954
Property features AI
Finance
- Other: Fee simple ownership
- HOA & community: No master association fee required
Exterior
- Parking: Detached owned garage (2 garage spaces, 2 total parking spaces)
- Utilities: Public water; Public sewer
- Home design: Detached single-family home; Single-story
- Construction: Vinyl siding and brick exterior; Built approximately 71–80 years ago; Built before 1978
- Exterior features: Lot dimensions roughly 49 x 146; Less than 0.25-acre lot
Interior
- Kitchen: Kitchen on the main level
- Bedrooms: 2 bedrooms (both on the main level); Master bedroom on the main level
- Bathrooms: 1 full bathroom
- Heating & cooling: Natural gas heating
- Interior features: Unfinished full basement; 4 total rooms
- Laundry & utility: Dedicated laundry room
Neighborhood map
What this means for you Summary
Snapshot
- This is a 2-bed/1.0-bath single-family listed at $135k.
Deal economics
- At list price, monthly cash flow is $-82 ($-983/yr) — negative.
- To cash-flow at today's rent, offer at most $121k (10.7% below list).
- To meet the 1% rule (rent ≥ 1% of price), the offer needs to be $126k (6.6% below list).
- Recommended offer: $121k (10.7% below list) — sets the bar for cash-flow.
Location & tenants
- Location reads 76/100 on livability (#202 in IL, #3,730 nationally) — a middle-class / working-renter tenant base. Strengths: commute A+, cost of living A+, housing A+; Watch: employment D, schools F, amenities F.
- Thornton Twp Hsd 205 (suburban): math 7% / reading 8% proficiency, ranked #594 of 620 in IL (top 96%) — low school quality limits family demand, transient renter base, plan for 1-2y turnover.
- Market conditions: 134 active listings in the ZIP; 9 comparable units currently listed for rent nearby; rentals leasing fast (median 8d on market — plan ~1-2 weeks tenant-placement turnaround); 6,272 units permitted in Cook County in 2024 (4,658 in 5+ unit buildings).
Forward outlook
- In year one you build about $14k of equity ($933 loan paydown + $14k appreciation (10.0% local appreciation)).
- At projected returns (10.0% appreciation + 3.0% rent growth), your $38k cash investment doubles in ~3 years — after that, you're playing with house money.
- By year 3, paydown + projected appreciation supports a ~$37k cash-out refi (75% LTV) — recoverable capital for the next deal without selling this one.
Negotiation context
- Only 1 days on market — expect competitive offers; lowballing is unlikely to land.
- Current owner paid $72k; list at $135k implies a 88% gain — meaningful room to come down on a strong offer.
Risks & watch-outs
- Watch-outs: property tax is 2.8% of price; built in 1954 — expect roof / HVAC / electrical / plumbing capex.
Questions for the listing agent
- What do current leases actually rent for vs. the listed asking? Can we see a recent rent roll and the last 12 months of T-12 income?
- Built in 1954 — when were the roof, HVAC, electrical panel, plumbing, and water heater last replaced?
- Property tax is high relative to price — has the assessment been appealed recently, and will the sale trigger a re-assessment?
- Is there a deadline driving the sale (1031 exchange, divorce, estate, relocation)? That informs how much negotiation room exists.
- Schools are F-rated, which usually means shorter tenancies and higher turnover. Who's the typical renter profile here, and what's been the actual vacancy rate?
- What's the average days-on-market for RENTAL listings here right now (not sales)? A rising rental-DOM trend means longer vacancies and softer asking-rent achievability than the comps imply.
- What's the recent tenant-quality profile in this submarket — average credit score on applications, eviction rate, late-payment / NSF rate, and stable-employment percentage? A property-management company in the area should have these aggregated.
- How much new for-sale + rental construction is in the pipeline within 1–3 miles? Heavy new supply typically softens prices + rents 12–24 months out; constrained supply supports both.
Investment metrics
- 1% rule
- 0.93% ✗
- Cap rate
- 5.57%
- Cash-on-cash
- -2.60%
- DSCR
- 0.88
- GRM
- 8.9
CMA / ARV
- ARV (on-the-fly)
- $177,632
- Comps found
- 8
Show comp detail 8 sales within ~0.75 mi
| Address | Dist | Beds/Ba | Sqft | Sold | Price | $/sf | Match |
|---|---|---|---|---|---|---|---|
| 14103 Marshfield Ave | 0.18mi | 3/1.0 (+1) | 960 (-2%) | 8mo | $177,000 | $184 | 77 |
| 34 W 142nd St | 0.20mi | 3/1.0 (+1) | 960 (-2%) | 9mo | $175,000 | $182 | 75 |
| 29 Circle Dr | 0.10mi | 3/1.0 (+1) | 960 (-2%) | 19mo | $103,500 | $108 | 71 |
| 14609 Justine St | 0.69mi | 3/2.0 (+1) | 1,000 (+2%) | 6mo | $237,500 | $238 | 50 |
| 28 Wells Ave | 0.52mi | 3/1.0 (+1) | 1,003 (+3%) | 23mo | $95,000 | $95 | 47 |
| 14607 Myrtle Ave | 0.75mi | 3/1.0 (+1) | 1,008 (+3%) | 15mo | $99,900 | $99 | 42 |
| 14300 Honore Ave | 0.28mi | 3/2.0 (+1) | 840 (-14%) | 21mo | $45,000 | $54 | 37 |
| 14510 Cooper Ave | 0.72mi | 3/1.5 (+1) | 936 (-4%) | 20mo | $210,000 | $224 | 36 |
Match score weights: distance 35% · size 25% · config 20% · recency 20%. Top-matched comps best support the ARV.
Projected returns pro-forma
10.0% appreciation · 3.0% rent growth · sell at horizon
- IRR
- 22.5%
- Equity multiple
- 2.81×
- Total profit
- $68,418
- Equity at exit
- $121,619
- IRR
- 20.1%
- Equity multiple
- 6.44×
- Total profit
- $205,795
- Equity at exit
- $262,275
Cash invested: $37,800 (down + closing). Projections, not guarantees.
Landlord ↔ Tenant lean methodology
- Overall (STATE)
- 43 Moderately Tenant-Leaning
- State Illinois
- 43 Moderately Tenant-Leaning · D+7
- County
- — inherits STATE
- City
- — inherits STATE
ZIP-level market 60426
- Home prices YoY
- 6.9%
- Active inventory
- 134
- Price-to-rent
- 8.9×
Monthly cashflow live
- Estimated rent
- $1,261 high interval (Pro) →
- Mortgage (P&I)
- −$708
- Tax from tax record
- −$314 /mo · $3,764/yr
- Insurance
- −$56
- HOA
- −$0
- Vacancy / Maint / Mgmt
- −$265
- Net cashflow
- $-82
Break-even live
UW: 25.0% down · 7.5% · 30yr · 1.5% tax · 5.0% vac · 8.0% maint · 8.0% mgmt
Financing live
Cash to close
- Down payment
- $33,750
- Closing costs
- $4,050
- Reserves months
- —
- Total cash needed
- —
Loan-product check · same deal, 3 products live
Conventional
25% down · 7.5% · 30yr
- Down + closing
- —
- Monthly P&I
- —
- Monthly cashflow
- —
- DSCR
- —
- Eligible?
- —
Personal DTI + credit; lowest rate.
DSCR
20% down · 8.5% · 30yr
- Down + closing
- —
- Monthly P&I
- —
- Monthly cashflow
- —
- DSCR
- —
- Eligible?
- —
No personal income docs; deal must DSCR.
Hard money
10% down · 12.0% · 12mo
- Down + closing
- —
- Monthly P&I
- —
- Monthly cashflow
- —
- DSCR
- —
- Eligible?
- —
Short-term bridge; refi at stabilization.
Rent comps 9 comps
| Address | Beds | Baths | Sqft | Rent | $/sqft | DOM | Units | Dist |
|---|---|---|---|---|---|---|---|---|
| 14629 Hoyne Ave Dixmoor, IL | 3.0 | 1.0 | 920 | $1,495 | $1.62 | 24d | 1 | 0.78mi |
| 2053 135th Pl Blue Island, IL | 2.0 | 1.0 | 800 | $1,250 | $1.56 | 7d | 1 | 1.21mi |
| 2053 135th Pl Blue Island, IL | 2.0 | 1.0 | 800 | $1,250 | $1.56 | 20d | 1 | 1.21mi |
| 2122 135th Pl Unit 2 Blue Island, IL | 1.0 | 1.0 | 700 | $1,100 | $1.57 | 7d | 1 | 1.25mi |
| 2122 135th Pl Blue Island, IL | 1.0 | 1.0 | 700 | $1,100 | $1.57 | 3d | 1 | 1.25mi |
| 2119 135th Pl Blue Island, IL | 2.0 | 1.0 | 900 | $1,250 | $1.39 | 3d | 1 | 1.26mi |
| 2119 135th Pl Unit 4 Blue Island, IL | 2.0 | 1.0 | 900 | $1,250 | $1.39 | 7d | 1 | 1.26mi |
| 724 W 138th St Unit 3 Riverdale, IL | 2.0 | 1.0 | 800 | $1,250 | $1.56 | 18d | 1 | 1.30mi |
| 455 W 144th St Unit 2W Riverdale, IL | 1.0 | 1.0 | 750 | $1,150 | $1.53 | 4d | 1 | 1.38mi |
Listing history 2 events
-
2026-06-17remarks 425-char remark
-
2026-06-17$135,000 Active 1 DOM
ⓘ Source: listings_history table (triggers on properties + properties_extension) + one-shot
backfill from property_details.listing_events for pre-trigger history.
Tax reassessment forecast IL · Partial reset (capped growth)
- Current annual tax
- $3,764 · $314/mo
- Projected year-2 tax
- $3,764 · $314/mo
- Expected delta
- $0/yr ($0/mo · 0.0%)
ⓘ Screening estimate from a state-policy table — verify with the county assessor before closing.
Climate risk First Street
- Flood 1/10 Low FEMA zone X (unshaded) · 0% chance over 30 yrs
- Wildfire 1/10 Low
- Heat 3/10 Moderate 7 d/yr ≥102°F today · 15 d/yr by 30 yrs out
- Wind 2/10 Low
- Air quality 3/10 Moderate 4 unhealthy d/yr today · 4 by 30 yrs out
Nearby sold comps map
Loading sold comps map…
Walkable amenities ~0.75 mi
Loading nearby amenities…
Taxation est. · year 1
- Rental income
- $15,128
- − Mortgage interest
- −$7,562
- − Property taxes
- −$3,764
- − Insurance
- −$675
- − Repairs & maintenance
- −$1,210
- − Management
- −$1,210
- − Depreciation
- −$3,927
- Taxable loss
- −$3,220
- Est. tax savings @ 24.0%
- +$773
- After-tax cash flow
- $-210/yr
For passive investors: Depreciation is non-cash, so a rental often shows a tax loss while cash-flowing — sheltering income. Rental losses are passive: they offset passive income freely, and up to $25,000/yr can offset ordinary (W-2) income if you actively participate and your MAGI is under $100k (phasing out to $0 by $150k); unused losses carry forward. On sale, claimed depreciation is recaptured at up to 25%, and gains may owe capital-gains tax (a 1031 exchange can defer both). Figures are a year-1 estimate at your 24.0% rate — not tax advice; consult a CPA.
Schools (NCES district)
- District
- Thornton Twp Hsd 205
- NCES district ID
- 1738970
- Math proficiency
- 7% ▬ 0.00%
- Reading proficiency
- 8% ▼ -2.00%
- Median HH income
- $43,392
- Composite
- 6.92/100
- National rank
- #9976
- State rank
- #594 of 620 in IL
Livability — Dixmoor
- Score
- 76/100
- State rank
- #202
- US rank
- #3730
Category grades
Schools grade is shown separately in the Schools card above.
Census & demographics
- Census place
- Dixmoor, IL
- Population (ZIP)
- 23,066
Population outlook (Cook County) Hauer SSP2
- Today (2025)
- 5,347,519 people
- By 2030
- 5,357,703 · +0.2%
- By 2040
- 5,324,924 · -0.4%
- By 2050
- 5,230,762 · -2.2%
- By 2075
- 4,785,735 · -10.5%
- By 2100
- 4,188,836 · -21.7%
Race, ethnicity, and origin ACS 2023
- Neighborhood character
- Majority Black (59%)
- Race & ethnicity
- Black 59% Hispanic / Latino 33% Two or more races 12% White 3% Asian 2%
- Hispanic origin (detail)
- Mexican 31%
- Foreign-born
- 17% · Canada
- Languages at home
- 67% English-only · Spanish 30% Other Indo-European 2% French/Haitian/Cajun 1%
Political lean MEDSL · Cook
- 2024 margin
- Solid D (+42.0) · D 70.4% · R 28.4% · Other 1.2%
- 2008→2024 swing
- -11.4pp toward R · 2008: 53.4pp · 2024: 42.0pp
- All cycles
- 2024: D+42.0 2020: D+50.3 2016: D+53.0 2012: D+49.4 2008: D+53.4
Not yet ingested
- Civics
- —
Market trends
- HPI YoY
- ▲ 20.36%
- Current HPI
- 313.7895
- Rent YoY
- —
- Metro
- —
- State GDP YoY
- ▲ 1.59%
- F500 in state
- 60
Industry mix (Fortune 500 HQ in IL)
| Industry | F500 HQs | Revenue |
|---|---|---|
| Insurance | 4 | $201B |
|
||
| Consumer Goods | 4 | $87B |
|
||
| Industrial Machinery | 3 | $64B |
|
||
| Healthcare | 2 | $55B |
|
||
| Retail / Pharmacy | 1 | $148B |
|
||
| Agriculture / Food | 1 | $86B |
|
||
Price history
+1700.0% since first listed3 events — show timeline
- 2026-06-17 Listed $135,000 MRED as Distributed by MLS Grid
- 2002-09-13 Sold (Public Records) $72,000 Public Records
- 1993-04-21 Sold (Public Records) $7,500 Public Records
Property tax history
+8.9%/yrLatest (2023): $3,764 · +14.9% YoY. Source: county tax records.
Cash-flow waterfall
monthlySold comps — $/sqft
last 12 mo · ≤1 miLoading sold comps…