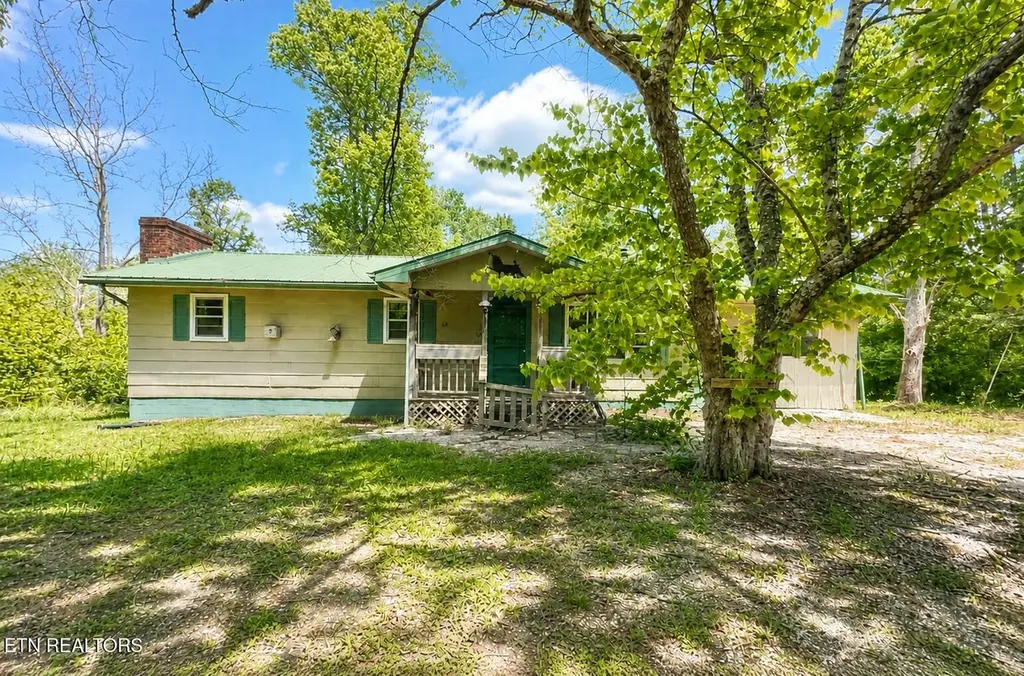
530 Boone Ridge Rd · Allardt, TN
Flood risk 1/10 · Minimal
- FEMA flood zone
- X (unshaded)
- Chance of flooding over 30 yrs
- 0.0%
- Est. flood insurance / yr
- $473 – $860
Fire risk 5/10 · Moderate
- Est. fire insurance / yr
- $949 – $1,763
Heat risk 3/10 · Minor
- Hot days now (above 100°F)
- 7 days/yr
- Hot days in 30 yrs
- 20 days/yr
Wind risk 3/10 · Minor
- Chance of severe wind over 30 yrs
- 5.0%
Air-quality risk 2/10 · Minimal
- Unhealthy air days now
- 2 days/yr
- Unhealthy air days in 30 yrs
- 2 days/yr
Risk factors via First Street. Map © Google.
Why this score? — see what drove the B grade
The composite is a weighted blend of 9 inputs, each scored 0–100. Each bar is that input's sub-score; the figure is the points it added to the 100-point composite (weight × sub-score).
- Cash flow +28.3/30.0
- DSCR +10.0/10.0
- Appreciation +10.0/10.0
- ARV discount +7.5/15.0
- 1% rule +6.5/10.0
- Livability +3.2/5.0
- Rent growth +2.5/5.0
- Condition / age +2.5/5.0
- Schools +2.1/10.0
$130,000
🖨 Deal sheet 📄 Offer letter ✓ Due diligence
Listing remarks
ucked along a quiet country road in Fentress County, this 3-bedroom, 2-bathroom ranch sits on 1.51 acres with immediate access to two major trailheads leading directly into the Big South Fork National River and Recreation Area. Ride, hike, or explore right from your door. The main level offers 1,008 square feet with a functional kitchen, living and dining areas, all bedrooms, full bath, and a wood-burning stove for supplemental heat. The partially finished lower level mirrors the footprint at 1,008 square feet and includes a second full bath, fireplace, separate entrance, and laundry area -- a versatile space with prior plumbing infrastructure in place that could support a home-based busine
Key facts
- Separate entrance
- Laundry area
- Barn
Tags
Property features AI
Finance
- Other: Building area reported as 2,016 (source: tax records); Lot size approximately 1.51 acres (source: tax records)
- Financial info: No financial details provided
- HOA & community: No HOA information listed
Exterior
- Parking: Off-street parking
- Security: No security features listed
- Utilities: Septic tank
- Home design: Detached property
- Construction: Block and frame construction; Other construction materials
- Exterior features: Storage structure; Barn(s); Irregular, level to rolling slope lot
Interior
- Kitchen: Dishwasher; Microwave; Self-cleaning oven
- Bedrooms: 6 total rooms (includes bedrooms and living spaces)
- Flooring: Hardwood; Vinyl
- Bathrooms: 2 full bathrooms
- Heating & cooling: Central heating (natural gas and electric); Central cooling
- Interior features: Eat-in kitchen; Partially finished walkout basement; Two fireplaces (brick and wood-burning stove)
- Laundry & utility: No specific laundry details provided
Neighborhood map
What this means for you Summary
Snapshot
- This is a 3-bed/1.0-bath single-family listed at $130k.
Deal economics
- At list price, monthly cash flow is $416 ($5k/yr) — positive.
- The deal already cash-flows at list — no discount required.
- Meets the 1% rule at list price ($1k rent vs $130k).
- Recommended offer: $128k (1.5% below list) — sets the bar for market timing.
- Cap rate 10.1% vs local median 2.3% in Allardt — top-decile yield for the area; either an underpriced asset or a hidden risk that comps aren't pricing in. Stress-test before assuming the spread holds.
Location & tenants
- Location reads 63/100 on livability (#194 in TN) — a middle-class / working-renter tenant base. Strengths: cost of living A+, housing A+; Watch: schools D+, crime F, amenities F.
- Fentress County (rural): math 24% / reading 27% proficiency, ranked #91 of 139 in TN (top 66%) — low school quality limits family demand, transient renter base, plan for 1-2y turnover; 65% free/reduced lunch — lower-income household profile, screen leases tightly.
- Market conditions: 325 active listings in the ZIP.
Forward outlook
- In year one you build about $14k of equity ($899 loan paydown + $13k appreciation (10.0% local appreciation)).
- Fentress County population projected at -19% by 2050 — secular population decline; favor cash flow + early exit over multi-decade hold.
- At projected returns (10.0% appreciation + 3.0% rent growth), your $36k cash investment doubles in ~2 years — after that, you're playing with house money.
- By year 3, paydown + projected appreciation supports a ~$35k cash-out refi (75% LTV) — recoverable capital for the next deal without selling this one.
Negotiation context
- It's been on market 18 days — a 2% lower offer ($128k) is reasonable based on typical stale-listing flexibility.
- 9 sale attempts since 22y ago with the ask held roughly flat each time — persistent listings suggest the price (not the market) is what's stuck; bring a comps-based counter.
Risks & watch-outs
- Climate carrying-cost: moderate wildfire risk — expect insurance premiums to compound above CPI over the hold.
Questions for the listing agent
- Built in 1972 — when were the roof, HVAC, electrical panel, plumbing, and water heater last replaced?
- Is there a deadline driving the sale (1031 exchange, divorce, estate, relocation)? That informs how much negotiation room exists.
- Schools are D-rated, which usually means shorter tenancies and higher turnover. Who's the typical renter profile here, and what's been the actual vacancy rate?
- Crime grade is F in this area — have there been break-ins, vandalism, or insurance claims at this property in the last 3 years? What carrier currently insures it and at what premium?
- What's the average days-on-market for RENTAL listings here right now (not sales)? A rising rental-DOM trend means longer vacancies and softer asking-rent achievability than the comps imply.
- What's the recent tenant-quality profile in this submarket — average credit score on applications, eviction rate, late-payment / NSF rate, and stable-employment percentage? A property-management company in the area should have these aggregated.
- How much new for-sale + rental construction is in the pipeline within 1–3 miles? Heavy new supply typically softens prices + rents 12–24 months out; constrained supply supports both.
Investment metrics
- 1% rule
- 1.15% ✓
- Cap rate
- 10.14%
- Cash-on-cash
- 13.73%
- DSCR
- 1.61
- GRM
- 7.3
CMA / ARV
- ARV (median comp)
- $484,407
- List price
- $130,000
- Delta
- -73.16%
- Verdict
- UNDERPRICED
- Comps
- 4 within 1.0 mi
Projected returns pro-forma
10.0% appreciation · 3.0% rent growth · sell at horizon
- IRR
- 34.4%
- Equity multiple
- 3.67×
- Total profit
- $97,261
- Equity at exit
- $117,114
- IRR
- 29.6%
- Equity multiple
- 8.29×
- Total profit
- $265,442
- Equity at exit
- $252,561
Cash invested: $36,400 (down + closing). Projections, not guarantees.
Landlord ↔ Tenant lean methodology
- Overall (STATE)
- 87 Strongly Landlord-Friendly
- State Tennessee
- 87 Strongly Landlord-Friendly · R+13
- County
- — inherits STATE
- City
- — inherits STATE
ZIP-level market 38556
- Home prices YoY
- 13.5%
- Active inventory
- 325
- Price-to-rent
- 7.3×
Monthly cashflow live
- Estimated rent
- $1,493 medium interval (Pro) →
- Mortgage (P&I)
- −$682
- Tax from tax record
- −$28 /mo · $330/yr
- Insurance
- −$54
- HOA
- −$0
- Vacancy / Maint / Mgmt
- −$314
- Net cashflow
- $416
Break-even live
UW: 25.0% down · 7.5% · 30yr · 1.5% tax · 5.0% vac · 8.0% maint · 8.0% mgmt
Financing live
Cash to close
- Down payment
- $32,500
- Closing costs
- $3,900
- Reserves months
- —
- Total cash needed
- —
Loan-product check · same deal, 3 products live
Conventional
25% down · 7.5% · 30yr
- Down + closing
- —
- Monthly P&I
- —
- Monthly cashflow
- —
- DSCR
- —
- Eligible?
- —
Personal DTI + credit; lowest rate.
DSCR
20% down · 8.5% · 30yr
- Down + closing
- —
- Monthly P&I
- —
- Monthly cashflow
- —
- DSCR
- —
- Eligible?
- —
No personal income docs; deal must DSCR.
Hard money
10% down · 12.0% · 12mo
- Down + closing
- —
- Monthly P&I
- —
- Monthly cashflow
- —
- DSCR
- —
- Eligible?
- —
Short-term bridge; refi at stabilization.
Listing history 10 events
-
2026-05-01$130,000 Active 1457-char remark
-
2011-03-01$164,000
-
2010-08-23$164,000
-
2010-02-18$164,000
-
2009-07-06$146,000
-
2008-06-04$154,500
-
2007-11-15$164,500
-
2006-10-31$175,900
-
2005-11-22soldstatus $128,000
-
2004-01-30$128,800
ⓘ Source: listings_history table (triggers on properties + properties_extension) + one-shot
backfill from property_details.listing_events for pre-trigger history.
Tax reassessment forecast TN · Resets to sale price
- Current annual tax
- $330 · $28/mo
- Projected year-2 tax
- $923 · $77/mo
- Expected delta
- +$593/yr (+$49/mo · 179.7%)
ⓘ Screening estimate from a state-policy table — verify with the county assessor before closing.
Climate risk First Street
- Flood 1/10 Low FEMA zone X (unshaded) · 0% chance over 30 yrs
- Wildfire 5/10 Major
- Heat 3/10 Moderate 7 d/yr ≥100°F today · 20 d/yr by 30 yrs out
- Wind 3/10 Moderate 5% chance of damaging wind over 30 yrs
- Air quality 2/10 Low 2 unhealthy d/yr today · 2 by 30 yrs out
Nearby sold comps map
Loading sold comps map…
Walkable amenities ~0.75 mi
Loading nearby amenities…
Taxation est. · year 1
- Rental income
- $17,921
- − Mortgage interest
- −$7,282
- − Property taxes
- −$330
- − Insurance
- −$650
- − Repairs & maintenance
- −$1,434
- − Management
- −$1,434
- − Depreciation
- −$3,782
- Taxable income
- $3,010
- Est. tax owed @ 24.0%
- −$722
- After-tax cash flow
- $4,274/yr
For passive investors: Depreciation is non-cash, so a rental often shows a tax loss while cash-flowing — sheltering income. Rental losses are passive: they offset passive income freely, and up to $25,000/yr can offset ordinary (W-2) income if you actively participate and your MAGI is under $100k (phasing out to $0 by $150k); unused losses carry forward. On sale, claimed depreciation is recaptured at up to 25%, and gains may owe capital-gains tax (a 1031 exchange can defer both). Figures are a year-1 estimate at your 24.0% rate — not tax advice; consult a CPA.
Schools (NCES district)
- District
- Fentress County
- NCES district ID
- 4701230
- Math proficiency
- 24% ▼ -13.00%
- Reading proficiency
- 27% ▼ -8.00%
- Median HH income
- $30,419
- Composite
- 20.6/100
- National rank
- #8552
- State rank
- #91 of 139 in TN
Livability — Allardt
- Score
- 63/100
- State rank
- #194
- US rank
- #15311
Category grades
Schools grade is shown separately in the Schools card above.
Census & demographics
- Population (ZIP)
- 12,531
Population outlook (Fentress County) Hauer SSP2
- Today (2025)
- 17,295 people
- By 2030
- 16,749 · -3.2%
- By 2040
- 15,443 · -10.7%
- By 2050
- 14,077 · -18.6%
- By 2075
- 11,482 · -33.6%
- By 2100
- 9,658 · -44.2%
Race, ethnicity, and origin ACS 2023
- Neighborhood character
- Predominantly White (96%)
- Race & ethnicity
- White 96% Two or more races 3% Hispanic / Latino 1%
- Common ancestry
- Serbian 3% Lithuanian 2% Iranian 1%
- Foreign-born
- 1% · Canada
- Languages at home
- 99% English-only · Spanish 1%
Political lean MEDSL · Fentress
- 2024 margin
- Solid R (+75.8) · D 11.8% · R 87.6%
- 2008→2024 swing
- -31.9pp toward R · 2008: -43.9pp · 2024: -75.8pp
- All cycles
- 2024: R+75.8 2020: R+71.3 2016: R+67.5 2012: R+53.4 2008: R+43.9
Not yet ingested
- Civics
- —
Market trends
- HPI YoY
- ▲ 44.31%
- Current HPI
- 372.5676
- Rent YoY
- —
- Metro
- —
- State GDP YoY
- ▲ 2.78%
- F500 in state
- 22
Industry mix (Fortune 500 HQ in TN)
| Industry | F500 HQs | Revenue |
|---|---|---|
| Healthcare | 3 | $91B |
|
||
| Retail | 3 | $72B |
|
||
| Transportation / Logistics | 1 | $88B |
|
||
| Paper / Packaging | 1 | $19B |
|
||
| Insurance | 1 | $13B |
|
||
| Energy | 1 | $12B |
|
||
Price history
+2.9% since first listed12 events — show timeline
- 2026-06-02 Sold (MLS) $132,500 Knoxville MLS
- 2026-05-20 Pending — Knoxville MLS
- 2026-05-01 Listed $130,000 Knoxville MLS
- 2011-03-01 Listed $164,000 Knoxville MLS
- 2010-08-23 Listed $164,000 Knoxville MLS
- 2010-02-18 Listed $164,000 Knoxville MLS
- 2009-07-06 Listed $146,000 Knoxville MLS
- 2008-06-04 Listed $154,500 Knoxville MLS
- 2007-11-15 Listed $164,500 Knoxville MLS
- 2006-10-31 Listed $175,900 Knoxville MLS
- 2005-11-22 Sold (Public Records) $128,000 Public Records
- 2004-01-30 Listed $128,800 Knoxville MLS
Property tax history
+1.9%/yrLatest (2025): $330 · +0.0% YoY. Source: county tax records.
Cash-flow waterfall
monthlySold comps — $/sqft
last 12 mo · ≤1 miLoading sold comps…