11265 Suffield St · Fort Myers, FL
Flood risk 1/10 · Minimal
- FEMA flood zone
- X (unshaded)
- Chance of flooding over 30 yrs
- 0.0%
- Est. flood insurance / yr
- $507 – $1,088
Fire risk 3/10 · Minor
- Est. fire insurance / yr
- $947 – $1,759
Heat risk 10/10 · Severe
- Hot days now (above 107°F)
- 7 days/yr
- Hot days in 30 yrs
- 28 days/yr
Wind risk 10/10 · Severe
- Chance of severe wind over 30 yrs
- 99.0%
Air-quality risk 2/10 · Minimal
- Unhealthy air days now
- 1 days/yr
- Unhealthy air days in 30 yrs
- 1 days/yr
Risk factors via First Street. Map © Google.
Why this score? — see what drove the C- grade
The composite is a weighted blend of 9 inputs, each scored 0–100. Each bar is that input's sub-score; the figure is the points it added to the 100-point composite (weight × sub-score).
- Cash flow +18.7/30.0
- ARV discount +7.4/15.0
- 1% rule +7.1/10.0
- DSCR +5.9/10.0
- Livability +4.3/5.0
- Schools +4.1/10.0
- Rent growth +2.6/5.0
- Condition / age +2.5/5.0
- Appreciation +0.0/10.0
$419,900
🖨 Deal sheet 📄 Offer letter ✓ Due diligence
Listing remarks MLS
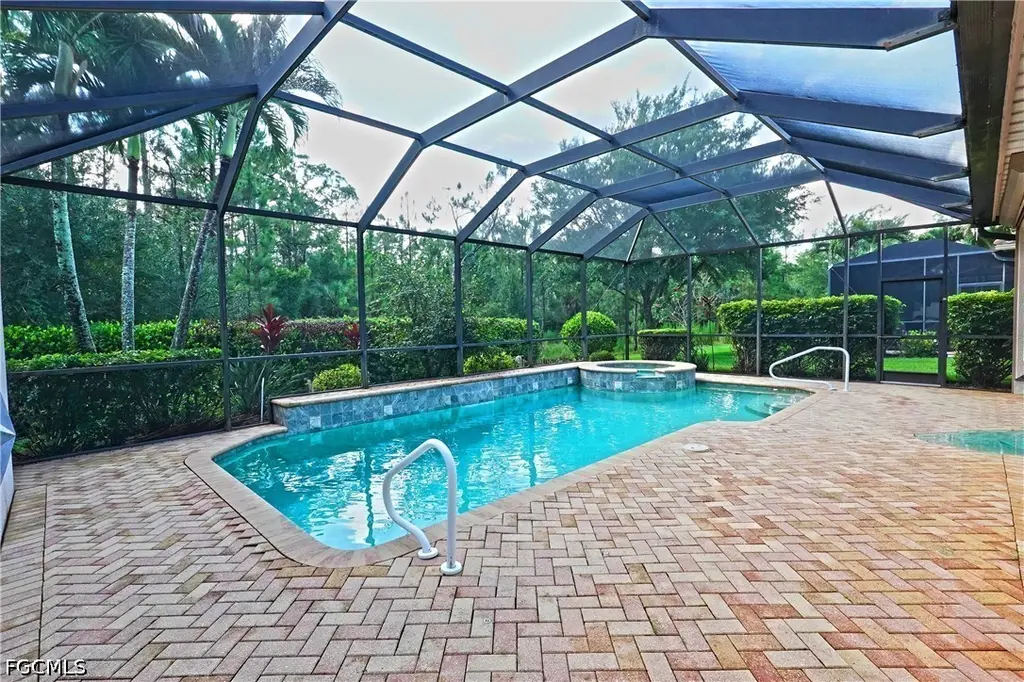
V. 1970 - If you are tired of driving, why do it? Live in this delightful villa pool home close to shops, restaurants & just about everything else! It is the perfect place to unwind! Located in an established gated neighborhood of quality homes, it features plantation shutters, diagonal tile, artfully designed baths, stainless appliances, 15x30 custom pool, extended paved lanai and so much more - creating a comfortable home with touches of luxury throughout. Make it yours so that you can enjoy paradise all year long!
Key facts
- Amenity center
- Plantation shutters
- In ground pool
Tags
Property features AI
Finance
- Financial info: Pets allowed with conditions (breed restrictions apply)
- HOA & community: HOA (quarterly fee); Association amenities include clubhouse, fitness center, pool, spa/hot tub, tennis courts, pickleball, bocce court, park, sidewalks, barbecue & picnic areas, library, management; Association fee includes grounds maintenance and security; Community has 985 units (multi-unit community)
Exterior
- Parking: Attached 2-car garage; Driveway; Paved parking; Garage door opener
- Security: Gated community; Security gate; Smoke detector(s)
- Utilities: Public water; Public sewer; Cable available; High speed internet available; Underground utilities
- Home design: Single-story home; Resale property; Home faces west; Property has attached guest structure
- Construction: Block, concrete and stucco construction; Tile roof; Built with a poured foundation (typical for block/concrete construction)
- Exterior features: Patio; Sprinkler/irrigation system (automatic); Shutters (electric); Guest house attached; Gated community; Security gate; Smoke detectors; Screen-enclosed pool area; Private heated in-ground pool (concrete, electric heat); In-ground spa (gunite)
Interior
- Kitchen: Range; Microwave; Dishwasher; Refrigerator; Freezer
- Bedrooms: Den (flex space that can be used as a bedroom)
- Flooring: Tile
- Bathrooms: 2 full bathrooms
- Heating & cooling: Central electric heating; Central electric cooling
- Interior features: Breakfast bar; Eat-in kitchen; Pantry; Separate shower; Bathtub; Dual sinks; High speed internet available; Split bedrooms; Single hung windows with shutters; Partially furnished
- Laundry & utility: Washer; Dryer; Laundry tub
Neighborhood map
What this means for you Summary
Snapshot
- This is a 2-bed/2.0-bath townhouse listed at $420k.
Deal economics
- At list price, monthly cash flow is $414 ($5k/yr) — positive.
- The deal already cash-flows at list — no discount required.
- Meets the 1% rule at list price ($5k rent vs $420k).
- Recommended offer: $414k (1.5% below list) — sets the bar for market timing.
- Cap rate 7.5% vs local median 3.0% in Fort Myers — top-decile yield for the area; either an underpriced asset or a hidden risk that comps aren't pricing in. Stress-test before assuming the spread holds.
Location & tenants
- Location reads 86/100 on livability (#14 in FL, #383 nationally) — a professional / high-income tenant draw. Strengths: amenities A+, commute A+, housing A+.
- Lee (suburban): math 47% / reading 50% proficiency, ranked #42 of 73 in FL (top 58%) — families likely to look elsewhere, expect single-tenant / working-renter base with shorter leases.
- Market conditions: Rents flat; 811 active listings in the ZIP; 40 comparable units currently listed for rent nearby; rentals at typical pace (median 24d on market — plan ~3-4 weeks tenant-placement turnaround); high-income renter base; 15,411 units permitted in Lee County in 2024 (4,686 in 5+ unit buildings).
- At $5,081/mo this rent would consume 55% of the median local household income ($110k/yr) (locally 276% of renters already pay >50% of income on rent) — very limited rent-growth headroom before tenants either downsize or default.
Forward outlook
- Local home prices are declining (-3.0%/yr); year-one equity from $3k of loan paydown is wiped out by about $13k of value loss. Plan a longer hold.
- Lee County population projected at +44% by 2050 — long-run rental-demand tailwind backs the buy-and-hold thesis.
Negotiation context
- It's been on market 17 days — a 2% lower offer ($414k) is reasonable based on typical stale-listing flexibility.
- 4 sale attempts since 12y ago with the ask held roughly flat each time — persistent listings suggest the price (not the market) is what's stuck; bring a comps-based counter.
- Current owner paid $342k; 23% above their basis — modest negotiation headroom, anchor on the comps not their cost.
Risks & watch-outs
- Climate carrying-cost: severe wind risk, 99% chance of damaging wind over 30y; extreme-heat days projected 7→28/yr by 2055 (HVAC capex compounding) — expect insurance premiums to compound above CPI over the hold.
Questions for the listing agent
- What does the HOA fee cover, when was the last increase, and are there any pending special assessments or reserve-fund shortfalls?
- Is there a deadline driving the sale (1031 exchange, divorce, estate, relocation)? That informs how much negotiation room exists.
- What's the average days-on-market for RENTAL listings here right now (not sales)? A rising rental-DOM trend means longer vacancies and softer asking-rent achievability than the comps imply.
- What's the recent tenant-quality profile in this submarket — average credit score on applications, eviction rate, late-payment / NSF rate, and stable-employment percentage? A property-management company in the area should have these aggregated.
- How much new for-sale + rental construction is in the pipeline within 1–3 miles? Heavy new supply typically softens prices + rents 12–24 months out; constrained supply supports both.
Investment metrics
- 1% rule
- 1.21% ✓
- Cap rate
- 7.48%
- Cash-on-cash
- 4.22%
- DSCR
- 1.19
- GRM
- 6.9
CMA / ARV
- ARV (on-the-fly)
- $419,310
- Comps found
- 5
Show comp detail 5 sales within ~0.75 mi
| Address | Dist | Beds/Ba | Sqft | Sold | Price | $/sf | Match |
|---|---|---|---|---|---|---|---|
| 11783 Avingston Ter | 0.40mi | 2/2.0 | 1,553 (0%) | 13mo | $390,000 | $251 | 71 |
| 10700 Palazzo Way #101 | 0.52mi | 3/2.0 (+1) | 1,390 (-10%) | 4mo | $309,500 | $223 | 49 |
| 10550 Casella Way #101 | 0.47mi | 3/2.0 (+1) | 1,722 (+11%) | 14mo | $500,000 | $290 | 44 |
| 10535 Casella Way #102 | 0.55mi | 3/2.0 (+1) | 1,722 (+11%) | 21mo | $465,000 | $270 | 34 |
| 10532 Casella Way #101 | 0.56mi | 3/2.0 (+1) | 1,722 (+11%) | 22mo | $470,000 | $273 | 32 |
Match score weights: distance 35% · size 25% · config 20% · recency 20%. Top-matched comps best support the ARV.
Projected returns pro-forma
-3.0% appreciation · 0.37% rent growth · sell at horizon
- IRR
- -13.2%
- Equity multiple
- 0.54×
- Total profit
- $-54,291
- Equity at exit
- $62,608
- IRR
- -10.1%
- Equity multiple
- 0.47×
- Total profit
- $-62,299
- Equity at exit
- $36,305
Cash invested: $117,572 (down + closing). Projections, not guarantees.
Landlord ↔ Tenant lean methodology
- Overall (STATE)
- 87 Strongly Landlord-Friendly
- State Florida
- 87 Strongly Landlord-Friendly · R+3
- County
- — inherits STATE
- City
- — inherits STATE
ZIP-level market 33913
- Home prices YoY
- -10.3%
- Rents YoY
- 0.4%
- Active inventory
- 811
- Price-to-rent
- 6.9×
Monthly cashflow live
- Estimated rent
- $5,081 high interval (Pro) →
- Mortgage (P&I)
- −$2,202
- Tax from tax record
- −$577 /mo · $6,929/yr
- Insurance
- −$175
- HOA
- −$646
- Vacancy / Maint / Mgmt
- −$1,067
- Net cashflow
- $414
Break-even live
UW: 25.0% down · 7.5% · 30yr · 1.5% tax · 5.0% vac · 8.0% maint · 8.0% mgmt
Financing live
Cash to close
- Down payment
- $104,975
- Closing costs
- $12,597
- Reserves months
- —
- Total cash needed
- —
Loan-product check · same deal, 3 products live
Conventional
25% down · 7.5% · 30yr
- Down + closing
- —
- Monthly P&I
- —
- Monthly cashflow
- —
- DSCR
- —
- Eligible?
- —
Personal DTI + credit; lowest rate.
DSCR
20% down · 8.5% · 30yr
- Down + closing
- —
- Monthly P&I
- —
- Monthly cashflow
- —
- DSCR
- —
- Eligible?
- —
No personal income docs; deal must DSCR.
Hard money
10% down · 12.0% · 12mo
- Down + closing
- —
- Monthly P&I
- —
- Monthly cashflow
- —
- DSCR
- —
- Eligible?
- —
Short-term bridge; refi at stabilization.
Rent comps 40 comps
| Address | Beds | Baths | Sqft | Rent | $/sqft | DOM | Units | Dist |
|---|---|---|---|---|---|---|---|---|
| 11230 Suffield St Fort Myers, FL | 2.0 | 2.0 | 1560 | $8,500 | $5.45 | 23d | 1 | 0.10mi |
| 11225 Lithgow Ln Fort Myers, FL | 2.0 | 2.0 | 2153 | $8,000 | $3.72 | 23d | 1 | 0.23mi |
| 11701 Avingston Ter Fort Myers, FL | 2.0 | 2.0 | 1553 | $5,500 | $3.54 | 14d | 1 | 0.24mi |
| 11442 Tiverton Trce Fort Myers, FL | 3.0 | 2.0 | 2010 | $9,500 | $4.73 | 23d | 1 | 0.32mi |
| 10879 Rutherford Rd Fort Myers, FL | 2.0 | 2.0 | 1566 | $3,500 | $2.23 | 23d | 1 | 0.36mi |
| 10791 Palazzo Way #301 Fort Myers, FL | 2.0 | 2.0 | 1390 | $5,300 | $3.81 | 23d | 1 | 0.36mi |
| 10820 Palazzo Way #203 Fort Myers, FL | 2.0 | 2.0 | 1235 | $5,400 | $4.37 | 23d | 1 | 0.40mi |
| 10535 Carolina Willow Dr Fort Myers, FL | 3.0 | 2.0 | 1290 | $2,300 | $1.78 | 21d | 1 | 0.41mi |
| 10751 Palazzo Way #103 Fort Myers, FL | 2.0 | 2.0 | 1235 | $5,000 | $4.05 | 23d | 1 | 0.42mi |
| 11343 Tiverton Trce Fort Myers, FL | 2.0 | 2.0 | 1685 | $4,000 | $2.37 | 3d | 1 | 0.43mi |
| 10711 Palazzo Way Unit 203 Fort Myers, FL | 2.0 | 2.0 | 1257 | $5,300 | $4.22 | 21d | 1 | 0.46mi |
| 10711 Palazzo Way Fort Myers, FL | 2.0 | 2.0 | 1257 | $3,900 | $3.10 | 16d | 2 | 0.46mi |
| 10700 Palazzo Way #201 Fort Myers, FL | 2.0 | 2.0 | 1390 | $5,000 | $3.60 | 21d | 1 | 0.54mi |
| 11619 Meadowrun Cir Fort Myers, FL | 3.0 | 2.5 | 2242 | $2,495 | $1.11 | 23d | 1 | 0.58mi |
| 10529 Casella Way #102 Fort Myers, FL | 3.0 | 2.0 | 1722 | $4,500 | $2.61 | 23d | 1 | 0.59mi |
| 10952 Clarendon St Fort Myers, FL | 2.0 | 2.0 | 1582 | $4,000 | $2.53 | 23d | 1 | 0.61mi |
| 10520 Casella Way #101 Fort Myers, FL | 3.0 | 2.0 | 1722 | $7,000 | $4.07 | 23d | 1 | 0.65mi |
| 10908 Clarendon St Fort Myers, FL | 3.0 | 2.0 | 1433 | $8,000 | $5.58 | 14d | 1 | 0.68mi |
| 10908 Clarendon St Fort Myers, FL | 3.0 | 2.0 | 1433 | $8,000 | $5.58 | 23d | 1 | 0.68mi |
| 10900 Glenhurst St Fort Myers, FL | 2.0 | 2.0 | 1355 | $2,200 | $1.62 | 2d | 1 | 0.69mi |
| 10602 Camarelle Cir Fort Myers, FL | 2.0 | 2.0 | 1690 | $5,500 | $3.25 | 23d | 1 | 0.79mi |
| 10280 Crepe Jasmine Ln Unit 1546286P Fort Myers, FL | 3.0 | 2.0 | 1571 | $4,526 | $2.88 | 16d | 1 | 0.83mi |
| 11541 Stonecreek Cir Fort Myers, FL | 3.0 | 3.0 | 2147 | $3,300 | $1.54 | 23d | 1 | 0.83mi |
| 12016 Five Waters Cir Fort Myers, FL | 3.0 | 2.0 | 1646 | $4,500 | $2.73 | 23d | 1 | 0.84mi |
| 11075 Lancewood St Fort Myers, FL | 3.0 | 2.0 | 1575 | $2,300 | $1.46 | 16d | 1 | 0.88mi |
| 11075 Lancewood St Fort Myers, FL | 3.0 | 2.0 | 1575 | $2,300 | $1.46 | 23d | 1 | 0.88mi |
| 12020 Champions Green Way #112 Fort Myers, FL | 2.0 | 2.0 | 1056 | $2,000 | $1.89 | 11d | 1 | 0.94mi |
| 12030 Champions Green Way #212 Fort Myers, FL | 2.0 | 2.0 | 1056 | $1,800 | $1.70 | 3d | 1 | 0.97mi |
| 10111 Colonial Country Club Blvd #2308 Fort Myers, FL | 2.0 | 2.0 | 1309 | $2,000 | $1.53 | 11d | 1 | 0.98mi |
| 10121 Colonial Country Club Blvd #1802 Fort Myers, FL | 2.0 | 2.0 | 1530 | $4,800 | $3.14 | 3d | 1 | 0.99mi |
| 10112 Colonial Country Club Blvd #209 Fort Myers, FL | 2.0 | 2.0 | 1530 | $5,000 | $3.27 | 23d | 1 | 1.02mi |
| 10518 Avila Cir Fort Myers, FL | 2.0 | 2.0 | 1466 | $6,500 | $4.43 | 23d | 1 | 1.03mi |
| 10518 Avila Cir Fort Myers, FL | 2.0 | 2.0 | 1466 | $6,500 | $4.43 | 3d | 1 | 1.03mi |
| 11593 Lakewood Preserve Pl Fort Myers, FL | 2.0 | 2.0 | 1985 | $2,800 | $1.41 | 23d | 1 | 1.03mi |
| 10730 Cetrella Dr Fort Myers, FL | 3.0 | 2.0 | 1558 | $6,900 | $4.43 | 23d | 1 | 1.04mi |
| 10271 Glastonbury Cir #102 Fort Myers, FL | 2.0 | 2.0 | 1550 | $4,500 | $2.90 | 23d | 1 | 1.04mi |
| 11617 Lakewood Preserve Pl Fort Myers, FL | 3.0 | 2.5 | 2242 | $3,100 | $1.38 | 16d | 1 | 1.05mi |
| 12171 Treeline Ave Fort Myers, FL | 1.0–3.0 | 1.0–2.0 | 1321 | $2,606 | $1.97 | 3d | 23 | 1.06mi |
| 10714 Cetrella Dr Fort Myers, FL | 2.0 | 2.0 | 1227 | $5,500 | $4.48 | 23d | 1 | 1.06mi |
| 11033 Mill Creek Way #202 Fort Myers, FL | 2.0 | 2.0 | 1379 | $5,400 | $3.92 | 23d | 1 | 1.06mi |
HOA detail
- Monthly dues
- $646 · $7,752/yr
- Likely covers
- poolsecurity
Listing history 12 events
-
2026-06-18days on market $419,900 Active 17 DOM
-
2026-06-17days on market $419,900 Active 16 DOM
-
2026-06-16days on market $419,900 Active 15 DOM
-
2026-06-15days on market $419,900 Active 14 DOM
-
2026-06-13days on market $419,900 Active 12 DOM
-
2026-06-10days on market $419,900 Active 9 DOM
-
2026-06-09days on market $419,900 Active 8 DOM
-
2026-06-08days on market $419,900 Active 7 DOM
-
2026-06-07days on market $419,900 Active 6 DOM
-
2026-06-03days on market $419,900 Active 2 DOM
-
2026-06-01remarks 699-char remark
-
2026-06-01$419,900 Active 1 DOM
ⓘ Source: listings_history table (triggers on properties + properties_extension) + one-shot
backfill from property_details.listing_events for pre-trigger history.
Tax reassessment forecast FL · Resets to sale price
- Current annual tax
- $6,929 · $577/mo
- Projected year-2 tax
- $6,929 · $577/mo
- Expected delta
- $0/yr ($0/mo · 0.0%)
ⓘ Screening estimate from a state-policy table — verify with the county assessor before closing.
Climate risk First Street
- Flood 1/10 Low FEMA zone X (unshaded) · 0% chance over 30 yrs
- Wildfire 3/10 Moderate
- Heat 10/10 Extreme 7 d/yr ≥107°F today · 28 d/yr by 30 yrs out
- Wind 10/10 Extreme 99% chance of damaging wind over 30 yrs
- Air quality 2/10 Low 1 unhealthy d/yr today · 1 by 30 yrs out
Nearby sold comps map
Loading sold comps map…
Walkable amenities ~0.75 mi
Loading nearby amenities…
Taxation est. · year 1
- Rental income
- $60,972
- − Mortgage interest
- −$23,521
- − Property taxes
- −$6,929
- − Insurance
- −$2,100
- − Repairs & maintenance
- −$4,878
- − Management
- −$4,878
- − HOA
- −$7,752
- − Depreciation
- −$12,215
- Taxable loss
- −$1,300
- Est. tax savings @ 24.0%
- +$312
- After-tax cash flow
- $5,276/yr
For passive investors: Depreciation is non-cash, so a rental often shows a tax loss while cash-flowing — sheltering income. Rental losses are passive: they offset passive income freely, and up to $25,000/yr can offset ordinary (W-2) income if you actively participate and your MAGI is under $100k (phasing out to $0 by $150k); unused losses carry forward. On sale, claimed depreciation is recaptured at up to 25%, and gains may owe capital-gains tax (a 1031 exchange can defer both). Figures are a year-1 estimate at your 24.0% rate — not tax advice; consult a CPA.
Schools (NCES district)
- District
- Lee
- NCES district ID
- 1201080
- Math proficiency
- 47% ▼ -11.00%
- Reading proficiency
- 50% ▼ -4.00%
- Median HH income
- $49,518
- Composite
- 41.49/100
- National rank
- #3458
- State rank
- #42 of 73 in FL
Livability — Fort Myers
- Score
- 86/100
- State rank
- #14
- US rank
- #383
Category grades
Schools grade is shown separately in the Schools card above.
Census & demographics
- Census place
- Fort Myers, FL
- County
- Lee County · 788,662 people
- City population
- 278,598
- Metro
- Cape Coral-Fort Myers, FL
- Population (ZIP)
- 31,538
- Household income
- $110,373
- Rent vs Own
- Severe rent burden
- 276.0
Population outlook (Lee County) Hauer SSP2
- Today (2025)
- 871,946 people
- By 2030
- 955,468 · +9.6%
- By 2040
- 1,113,587 · +27.7%
- By 2050
- 1,256,891 · +44.1%
- By 2075
- 1,560,270 · +78.9%
- By 2100
- 1,726,848 · +98.0%
Race, ethnicity, and origin ACS 2023
- Neighborhood character
- Predominantly White (74%)
- Race & ethnicity
- White 74% Hispanic / Latino 13% Two or more races 11% Black 5% Asian 2%
- Hispanic origin (detail)
- Mexican 3% Puerto Rican 3% Cuban 2%
- Common ancestry
- Romanian 5% Lithuanian 3% Slovak 2%
- Foreign-born
- 14% · Canada, Vietnam, China
- Languages at home
- 84% English-only · Spanish 10% Other Indo-European 2% French/Haitian/Cajun 2%
Political lean MEDSL · Lee
- 2024 margin
- Strong R (+28.4) · D 35.5% · R 63.9%
- 2008→2024 swing
- -18.0pp toward R · 2008: -10.4pp · 2024: -28.4pp
- All cycles
- 2024: R+28.4 2020: R+19.2 2016: R+20.4 2012: R+16.6 2008: R+10.4
Not yet ingested
- Civics
- —
Market trends
- HPI YoY
- ▼ -25.45%
- Current HPI
- 221.7115
- Rent YoY
- ▲ 0.37%
- Metro
- Cape Coral-Fort Myers, FL
- State GDP YoY
- ▲ 3.28%
- F500 in state
- 36
Industry mix (Fortune 500 HQ in FL)
| Industry | F500 HQs | Revenue |
|---|---|---|
| Industrial Technology | 2 | $29B |
|
||
| Insurance | 2 | $17B |
|
||
| Retail | 1 | $60B |
|
||
| Technology Distribution | 1 | $58B |
|
||
| Homebuilding | 1 | $35B |
|
||
| Technology Manufacturing | 1 | $35B |
|
||
Price history
+54.1% since first listed15 events — show timeline
- 2026-06-01 Listed $419,900 FORTMLS
- 2026-04-30 Relisted — FORTMLS
- 2026-04-30 Listing Removed — FORTMLS
- 2026-04-20 Pending — FORTMLS
- 2026-03-03 Price Changed $429,900 FORTMLS
- 2026-02-13 Price Changed $439,900 FORTMLS
- 2025-09-29 Price Changed $449,900 FORTMLS
- 2025-08-10 Price Changed $454,900 FORTMLS
- 2025-06-09 Price Changed $459,900 FORTMLS
- 2025-05-16 Listed $475,000 FORTMLS
- 2021-05-14 Sold (Public Records) $342,000 Public Records
- 2014-07-01 Sold (Public Records) $272,500 Public Records
- 2014-06-27 Price Changed $279,500 NAPLESMLS
- 2014-06-27 Sold (MLS) $272,500 NAPLESMLS
- 2014-05-13 Listed $272,500 NAPLESMLS
Property tax history
+0.7%/yrLatest (2025): $6,929 · -11.1% YoY. Source: county tax records.
Cash-flow waterfall
monthlySold comps — $/sqft
last 12 mo · ≤1 miLoading sold comps…