 Multi-family
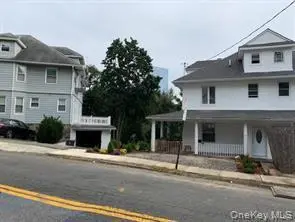
16 Park Ave · White Plains, NY
Flood risk 3/10 · Minor
- FEMA flood zone
- X (unshaded)
- Chance of flooding over 30 yrs
- 0.2%
- Est. flood insurance / yr
- $473 – $860
Fire risk 3/10 · Minor
- Est. fire insurance / yr
- $691 – $1,283
Heat risk 6/10 · Moderate
- Hot days now (above 98°F)
- 7 days/yr
- Hot days in 30 yrs
- 15 days/yr
Wind risk 6/10 · Moderate
- Chance of severe wind over 30 yrs
- 27.0%
Air-quality risk 4/10 · Minor
- Unhealthy air days now
- 3 days/yr
- Unhealthy air days in 30 yrs
- 5 days/yr
Risk factors via First Street. Map © Google.
Why this score? — see what drove the C grade
The composite is a weighted blend of 9 inputs, each scored 0–100. Each bar is that input's sub-score; the figure is the points it added to the 100-point composite (weight × sub-score).
- Cash flow +19.6/30.0
- ARV discount +15.0/15.0
- DSCR +6.2/10.0
- Schools +4.7/10.0
- 1% rule +3.9/10.0
- Livability +3.6/5.0
- Rent growth +2.5/5.0
- Condition / age +2.5/5.0
- Appreciation +0.0/10.0
$711,000
🖨 Deal sheet 📄 Offer letter ✓ Due diligence
Multi-family units
County records classify this as Multi-Family (2-4 Unit). Listing-text estimate: 1 unit. estimate disagrees with records
Listing remarks MLS
.
Key facts
- Near restaurants
- Near bus station
- Near parks
Tags
Neighborhood map
What this means for you Summary
Snapshot
- This is a 5-bed/2.0-bath multifamily listed at $711k.
Deal economics
- At list price, monthly cash flow is $825 ($10k/yr) — positive.
- The deal already cash-flows at list — no discount required.
- To meet the 1% rule (rent ≥ 1% of price), the offer needs to be $630k (11.4% below list).
- Recommended offer: $630k (11.4% below list) — sets the bar for 1% rule.
- Cap rate 7.7% vs local median 4.3% in White Plains — top-decile yield for the area; either an underpriced asset or a hidden risk that comps aren't pricing in. Stress-test before assuming the spread holds.
Location & tenants
- Location reads 71/100 on livability (#410 in NY) — a middle-class / working-renter tenant base. Strengths: commute A+, employment A+, crime A-; Watch: amenities F, cost of living F.
- White Plains City School District (urban): math 49% / reading 54% proficiency, ranked #313 of 590 in NY (top 53%) — acceptable for families but not a draw, mixed tenant base, ~2y average lease.
- Market conditions: 111 active listings in the ZIP; 4 comparable units currently listed for rent nearby; rentals at typical pace (median 15d on market — plan ~3-4 weeks tenant-placement turnaround); 954 units permitted in Westchester County in 2024 (649 in 5+ unit buildings).
Forward outlook
- Local home prices are declining (-3.0%/yr); year-one equity from $5k of loan paydown is wiped out by about $21k of value loss. Plan a longer hold.
- Westchester County population projected at +10% by 2050 — modest demand growth; plan on rents tracking national, not racing it.
Negotiation context
- It's been on market 107 days — a 9% lower offer ($647k) is reasonable based on typical stale-listing flexibility.
- 9 sale attempts since 23y ago; this cycle's ask has dropped $89k (11%) from the opening price — seller is motivated, your offer sets the floor, not the list.
- Current owner paid $300k; list at $711k implies a 137% gain — meaningful room to come down on a strong offer.
Risks & watch-outs
- Watch-outs: built in 1924 — expect roof / HVAC / electrical / plumbing capex.
- Climate carrying-cost: major wind risk, 27% chance of damaging wind over 30y; extreme-heat days projected 7→15/yr by 2055 (HVAC capex compounding) — expect insurance premiums to compound above CPI over the hold.
Questions for the listing agent
- It's been on market 107 days. Have you received any prior offers? Is the seller open to a 11% concession, seller financing, or rate buy-down credit?
- Built in 1924 — when were the roof, HVAC, electrical panel, plumbing, and water heater last replaced?
- Why hasn't it sold? Are there any deal-killer items the seller is aware of (foundation, flood, title, zoning, code violations)?
- Is there a deadline driving the sale (1031 exchange, divorce, estate, relocation)? That informs how much negotiation room exists.
- What's the average days-on-market for RENTAL listings here right now (not sales)? A rising rental-DOM trend means longer vacancies and softer asking-rent achievability than the comps imply.
- What's the recent tenant-quality profile in this submarket — average credit score on applications, eviction rate, late-payment / NSF rate, and stable-employment percentage? A property-management company in the area should have these aggregated.
- How much new apartment / multifamily construction is in the pipeline within 1–3 miles? Heavy new supply (>2% of stock underway) typically softens rents 12–24 months out; light construction supports rent growth.
Investment metrics
- 1% rule
- 0.89% ✗
- Cap rate
- 7.69%
- Cash-on-cash
- 4.97%
- DSCR
- 1.22
- GRM
- 9.4
CMA / ARV
- ARV (median comp)
- $994,683
- List price
- $711,000
- Delta
- -28.52%
- Verdict
- UNDERPRICED
- Comps
- 20 within 1.0 mi
Show comp detail 3 sales within ~0.75 mi
| Address | Dist | Beds/Ba | Sqft | Sold | Price | $/sf | Match |
|---|---|---|---|---|---|---|---|
| 114-116 Ferris Ave | 0.38mi | 4/2.5 (-1) | 2,032 (-3%) | 13mo | $749,000 | $369 | 59 |
| 63 Grant Ave | 0.44mi | 4/2.0 (-1) | 1,920 (-8%) | 5mo | $803,700 | $419 | 56 |
| 42 Jefferson Ave | 0.73mi | 6/2.0 (+1) | 2,280 (+9%) | 7mo | $730,000 | $320 | 40 |
Match score weights: distance 35% · size 25% · config 20% · recency 20%. Top-matched comps best support the ARV.
Projected returns pro-forma
-3.0% appreciation · 3.0% rent growth · sell at horizon
- IRR
- -8.6%
- Equity multiple
- 0.68×
- Total profit
- $-63,037
- Equity at exit
- $106,012
- IRR
- 0.8%
- Equity multiple
- 1.06×
- Total profit
- $11,258
- Equity at exit
- $61,474
Cash invested: $199,080 (down + closing). Projections, not guarantees.
Landlord ↔ Tenant lean methodology
- Overall (STATE)
- 15 Strongly Tenant-Friendly
- State New York
- 15 Strongly Tenant-Friendly · D+10
- County
- — inherits STATE
- City
- — inherits STATE
ZIP-level market 10603
- Home prices YoY
- -24.2%
- Active inventory
- 111
- Price-to-rent
- 9.4×
Monthly cashflow live
- Estimated rent
- $6,300 medium interval (Pro) →
- Mortgage (P&I)
- −$3,729
- Tax from tax record
- −$127 /mo · $1,523/yr
- Insurance
- −$296
- HOA
- −$0
- Vacancy / Maint / Mgmt
- −$1,323
- Net cashflow
- $825
Break-even live
UW: 25.0% down · 7.5% · 30yr · 1.5% tax · 5.0% vac · 8.0% maint · 8.0% mgmt
Financing live
Cash to close
- Down payment
- $177,750
- Closing costs
- $21,330
- Reserves months
- —
- Total cash needed
- —
Loan-product check · same deal, 3 products live
Conventional
25% down · 7.5% · 30yr
- Down + closing
- —
- Monthly P&I
- —
- Monthly cashflow
- —
- DSCR
- —
- Eligible?
- —
Personal DTI + credit; lowest rate.
DSCR
20% down · 8.5% · 30yr
- Down + closing
- —
- Monthly P&I
- —
- Monthly cashflow
- —
- DSCR
- —
- Eligible?
- —
No personal income docs; deal must DSCR.
Hard money
10% down · 12.0% · 12mo
- Down + closing
- —
- Monthly P&I
- —
- Monthly cashflow
- —
- DSCR
- —
- Eligible?
- —
Short-term bridge; refi at stabilization.
Rent comps 4 comps
| Address | Beds | Baths | Sqft | Rent | $/sqft | DOM | Units | Dist |
|---|---|---|---|---|---|---|---|---|
| 3 Terrace Ave White Plains, NY | 4.0 | 2.0 | 1820 | $5,500 | $3.02 | 6d | 1 | 0.33mi |
| 107 Winding Ridge Rd #107 White Plains, NY | 4.0 | 3.5 | 3000 | $7,500 | $2.50 | 24d | 1 | 1.03mi |
| 82 Quinby Ave White Plains, NY | 4.0 | 1.5 | 2350 | $6,000 | $2.55 | 1d | 1 | 1.37mi |
| 172 Lakeview Ave #170 West Harrison, NY | 5.0 | 3.5 | 3000 | $9,200 | $3.07 | 15d | 1 | 1.40mi |
Listing history 42 events
-
2026-06-18days on market $711,000 Active 107 DOM
-
2026-06-17days on market $711,000 Active 106 DOM
-
2026-06-16days on market $711,000 Active 105 DOM
-
2026-06-15days on market $711,000 Active 104 DOM
-
2026-06-13days on market $711,000 Active 102 DOM
-
2026-06-13days on market $711,000 Active 101 DOM
-
2026-06-09days on market $711,000 Active 98 DOM
-
2026-06-08days on market $711,000 Active 97 DOM
-
2026-06-07days on market $711,000 Active 96 DOM
-
2026-06-04days on market $711,000 Active 93 DOM
-
2026-06-03days on market $711,000 Active 92 DOM
-
2026-06-02days on market $711,000 Active 91 DOM
-
2026-06-01days on market $711,000 Active 90 DOM
-
2026-05-31days on market $711,000 Active 89 DOM
-
2026-05-15price $711,000 1-char remark
Show marketing remark (1 chars)
.
-
2026-03-11price $781,000 1-char remark
Show marketing remark (1 chars)
.
-
2026-03-03$799,999 Active 1-char remark
Show marketing remark (1 chars)
.
-
2025-03-25historical
-
2024-09-24$799,000 Active
-
2020-02-05historical
-
2020-01-15status Active
-
2019-11-06historical
-
2019-11-05price $680,000
-
2019-10-25price $590,000
-
2019-10-04$599,900 Active
-
2019-01-05historical
-
2018-12-03historical
-
2018-10-17$449,900 New
-
2018-10-10$449,900 Active
-
2018-10-09soldstatus $300,000
-
2018-09-29soldstatus $300,000 Sold
-
2018-08-20historical Pending
-
2018-05-23price $345,000
-
2018-05-04$375,000 Active
-
2014-01-27price $325,000
-
2004-05-13soldstatus $330,100
-
2004-03-15historical
-
2004-01-13soldstatus $330,000
-
2003-12-17historical
-
2003-11-12$330,000
-
2003-09-16
-
1999-02-05soldstatus $140,000
ⓘ Source: listings_history table (triggers on properties + properties_extension) + one-shot
backfill from property_details.listing_events for pre-trigger history.
Tax reassessment forecast NY · Partial reset (capped growth)
- Current annual tax
- $1,523 · $127/mo
- Projected year-2 tax
- $6,769 · $564/mo
- Expected delta
- +$5,247/yr (+$437/mo · 344.6%)
ⓘ Screening estimate from a state-policy table — verify with the county assessor before closing.
Climate risk First Street
- Flood 3/10 Moderate FEMA zone X (unshaded) · 20% chance over 30 yrs
- Wildfire 3/10 Moderate
- Heat 6/10 Major 7 d/yr ≥98°F today · 15 d/yr by 30 yrs out
- Wind 6/10 Major 27% chance of damaging wind over 30 yrs
- Air quality 4/10 Moderate 3 unhealthy d/yr today · 5 by 30 yrs out
Nearby sold comps map
Loading sold comps map…
Walkable amenities ~0.75 mi
Loading nearby amenities…
Taxation est. · year 1
- Rental income
- $75,597
- − Mortgage interest
- −$39,827
- − Property taxes
- −$1,523
- − Insurance
- −$3,555
- − Repairs & maintenance
- −$6,048
- − Management
- −$6,048
- − Depreciation
- −$20,684
- Taxable loss
- −$2,087
- Est. tax savings @ 24.0%
- +$501
- After-tax cash flow
- $10,402/yr
For passive investors: Depreciation is non-cash, so a rental often shows a tax loss while cash-flowing — sheltering income. Rental losses are passive: they offset passive income freely, and up to $25,000/yr can offset ordinary (W-2) income if you actively participate and your MAGI is under $100k (phasing out to $0 by $150k); unused losses carry forward. On sale, claimed depreciation is recaptured at up to 25%, and gains may owe capital-gains tax (a 1031 exchange can defer both). Figures are a year-1 estimate at your 24.0% rate — not tax advice; consult a CPA.
Schools (NCES district)
- District
- White Plains City School District
- NCES district ID
- 3631260
- Math proficiency
- 49% ▼ -6.00%
- Reading proficiency
- 54% ▲ 2.00%
- Median HH income
- $78,366
- Composite
- 46.72/100
- National rank
- #2397
- State rank
- #313 of 590 in NY
Livability — White Plains
- Score
- 71/100
- State rank
- #410
- US rank
- #6801
Category grades
Schools grade is shown separately in the Schools card above.
Census & demographics
- Census place
- White Plains, NY
- City population
- 61,281
- Population (ZIP)
- 19,201
Population outlook (Westchester County) Hauer SSP2
- Today (2025)
- 1,028,035 people
- By 2030
- 1,051,636 · +2.3%
- By 2040
- 1,098,520 · +6.9%
- By 2050
- 1,136,044 · +10.5%
- By 2075
- 1,196,925 · +16.4%
- By 2100
- 1,175,147 · +14.3%
Race, ethnicity, and origin ACS 2023
- Neighborhood character
- Highly diverse neighborhood (Simpson 0.71)
- Race & ethnicity
- Hispanic / Latino 35% White 34% Black 21% Two or more races 13% Asian 5%
- Hispanic origin (detail)
- Mexican 4% Puerto Rican 7% Dominican 3%
- Common ancestry
- Hispanic 3% Romanian 2% Lithuanian 1%
- Foreign-born
- 33% · Canada, Jamaica, China
- Languages at home
- 55% English-only · Spanish 31% Other Indo-European 8% French/Haitian/Cajun 2%
Political lean MEDSL · Westchester
- 2024 margin
- Strong D (+26.3) · D 63.1% · R 36.9%
- 2008→2024 swing
- -1.3pp toward R · 2008: 27.6pp · 2024: 26.3pp
- All cycles
- 2024: D+26.3 2020: D+36.3 2016: D+32.8 2012: D+22.2 2008: D+27.6
Not yet ingested
- Civics
- —
Market trends
- HPI YoY
- ▼ -101.72%
- Current HPI
- 317.8177
- Rent YoY
- —
- Metro
- —
- State GDP YoY
- ▲ 2.60%
- F500 in state
- 92
Industry mix (Fortune 500 HQ in NY)
| Industry | F500 HQs | Revenue |
|---|---|---|
| Financial Services | 10 | $950B |
|
||
| Consumer Goods | 9 | $162B |
|
||
| Insurance | 4 | $225B |
|
||
| Telecommunications | 2 | $144B |
|
||
| Pharmaceuticals | 2 | $112B |
|
||
| Media / Entertainment | 2 | $69B |
|
||
Price history
+407.9% since first listed28 events — show timeline
- 2026-05-15 Price Changed $711,000 OneKey® MLS as Distributed by MLS Grid
- 2026-03-11 Price Changed $781,000 OneKey® MLS as Distributed by MLS Grid
- 2026-03-03 Listed $799,999 OneKey® MLS as Distributed by MLS Grid
- 2025-03-25 Listing Removed — OneKey® MLS as Distributed by MLS Grid
- 2024-09-24 Listed $799,000 OneKey® MLS as Distributed by MLS Grid
- 2020-02-05 Listing Removed — OneKey® MLS as Distributed by MLS Grid
- 2020-01-15 Relisted — OneKey® MLS as Distributed by MLS Grid
- 2019-11-06 Listing Removed — OneKey® MLS as Distributed by MLS Grid
- 2019-11-05 Price Changed $680,000 OneKey® MLS as Distributed by MLS Grid
- 2019-10-25 Price Changed $590,000 OneKey® MLS as Distributed by MLS Grid
- 2019-10-04 Listed $599,900 OneKey® MLS as Distributed by MLS Grid
- 2019-01-05 Listing Removed — OneKey® MLS as Distributed by MLS Grid
- 2018-12-03 Listing Removed — OneKey® MLS as Distributed by MLS Grid
- 2018-10-17 Listed $449,900 OneKey® MLS as Distributed by MLS Grid
- 2018-10-10 Listed $449,900 OneKey® MLS as Distributed by MLS Grid
- 2018-10-09 Sold (Public Records) $300,000 Public Records
- 2018-09-29 Sold (MLS) $300,000 OneKey® MLS as Distributed by MLS Grid
- 2018-08-20 Contingent — OneKey® MLS as Distributed by MLS Grid
- 2018-05-23 Price Changed $345,000 OneKey® MLS as Distributed by MLS Grid
- 2018-05-04 Listed $375,000 OneKey® MLS as Distributed by MLS Grid
- 2014-01-27 Price Changed $325,000 HGMLS
- 2004-05-13 Sold (Public Records) $330,100 Public Records
- 2004-03-15 Delisted — HGMLS
- 2004-01-13 Sold (MLS) $330,000 HGMLS
- 2003-12-17 Delisted — HGMLS
- 2003-11-12 Listed $330,000 HGMLS
- 2003-09-16 Listed — HGMLS
- 1999-02-05 Sold (Public Records) $140,000 Public Records
Property tax history
-21.0%/yrLatest (2025): $1,523 · -0.3% YoY. Source: county tax records.
Cash-flow waterfall
monthlySold comps — $/sqft
last 12 mo · ≤1 miLoading sold comps…