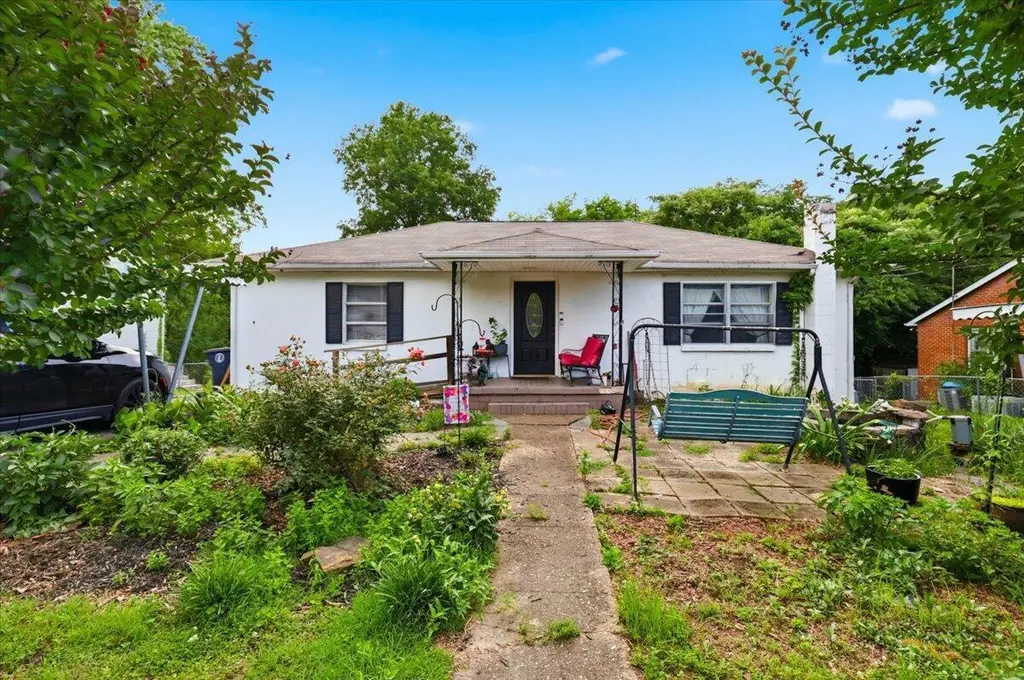
1515 Merrill St · East Ridge, TN
Flood risk 4/10 · Minor
- FEMA flood zone
- X (unshaded)
- Chance of flooding over 30 yrs
- 0.22%
- Est. flood insurance / yr
- $507 – $1,088
Fire risk 1/10 · Minimal
- Est. fire insurance / yr
- $949 – $1,763
Heat risk 6/10 · Moderate
- Hot days now (above 105°F)
- 7 days/yr
- Hot days in 30 yrs
- 20 days/yr
Wind risk 4/10 · Minor
- Chance of severe wind over 30 yrs
- 11.0%
Air-quality risk 3/10 · Minor
- Unhealthy air days now
- 2 days/yr
- Unhealthy air days in 30 yrs
- 2 days/yr
Risk factors via First Street. Map © Google.
Why this score? — see what drove the C grade
The composite is a weighted blend of 9 inputs, each scored 0–100. Each bar is that input's sub-score; the figure is the points it added to the 100-point composite (weight × sub-score).
- Cash flow +20.3/30.0
- ARV discount +15.0/15.0
- DSCR +6.4/10.0
- 1% rule +5.4/10.0
- Livability +3.6/5.0
- Schools +2.7/10.0
- Condition / age +2.2/5.0
- Rent growth +2.0/5.0
- Appreciation +0.0/10.0
$185,000
🖨 Deal sheet 📄 Offer letter ✓ Due diligence
Listing remarks
Versatile dual-living potential. Strong upside. Prime East Ridge location. This 1950 property is currently functioning as a single-family home but is already configured for duplex-style living with 2 beds/1 bath + kitchen on each level and separate entrances. Ideal for house hacking, multi-gen living, or converting to a true income-producing duplex. The home includes three carports (fits four vehicles), a fenced backyard, and a five-year-old roof. Property will be sold as-is, offering a solid foundation for renovation or repositioning. A smart opportunity in a growing, well-positioned community with strong long-term potential. Equitable Ownership Interest. Contact listing agent for details.
Key facts
- Five-year-old roof
- Separate entrances
- Fenced backyard
Tags
Property features AI
Exterior
- Parking: Carport with 4 spaces; Driveway
- Utilities: Public water; Public sewer; Electricity connected; Water connected; Sewer connected
- Home design: Duplex; Single family residence; Residential property
- Construction: Block foundation; Block, brick, and vinyl siding construction; Asphalt roof; Built as split finished levels (above and below grade areas)
- Exterior features: Front porch; Storage; Outbuilding; Fenced backyard; Level and sloped lot
Interior
- Kitchen: Microwave; Free‑standing electric oven; Electric range; Dishwasher
- Bathrooms: 2 full bathrooms
- Heating & cooling: Central heating (electric); Central air conditioning; Ceiling fan(s)
- Interior features: Ceiling fan(s); Living room fireplace; Therapeutic whirlpool
- Laundry & utility: Washer hookup; Electric dryer hookup; Electric water heater
Neighborhood map
What this means for you Summary
Snapshot
- This is a 4-bed/2.0-bath single-family listed at $185k. Condition is rated fair.
Deal economics
- At list price, monthly cash flow is $236 ($3k/yr) — positive.
- The deal already cash-flows at list — no discount required.
- Meets the 1% rule at list price ($2k rent vs $185k).
- Recommended offer: $182k (1.5% below list) — sets the bar for market timing.
- Cap rate 7.8% vs local median 3.8% in East Ridge — top-decile yield for the area; either an underpriced asset or a hidden risk that comps aren't pricing in. Stress-test before assuming the spread holds.
Location & tenants
- Location reads 71/100 on livability (#41 in TN) — a middle-class / working-renter tenant base. Strengths: cost of living A+, housing A+, health & safety A; Watch: amenities D+, crime D, commute F.
- Hamilton County (urban): math 31% / reading 31% proficiency, ranked #42 of 139 in TN (top 30%) — families likely to look elsewhere, expect single-tenant / working-renter base with shorter leases.
- Zoned schools: East Ridge Elementary (math 22% / reading 18%, grade F, #644 of 952 statewide, top 68%, 996 students, 0% FRL); East Ridge Middle School (math 12% / reading 14%, grade F, #237 of 333 statewide, top 72%, 701 students, 0% FRL); East Ridge High School (math 7% / reading 17%, grade F, #265 of 332 statewide, top 80%, 1,008 students, 0% FRL) — zoned schools average 0% FRL vs 52% district-wide (52 pts lower); this property's tenant base skews higher-income than the district average.
- Zoned-school proficiency averages 15% at this address vs 31% district-wide (-16 pts) — the specific schools serving this property underperform the Hamilton County average; the district grade overstates school quality for this exact location.
- Market conditions: Rents soft (-2.0%/yr); 157 active listings in the ZIP; 3 comparable units currently listed for rent nearby; rentals at typical pace (median 23d on market — plan ~3-4 weeks tenant-placement turnaround); 2,133 units permitted in Hamilton County in 2024 (405 in 5+ unit buildings).
- This rent runs 37% of the median local income ($63k/yr) — at the standard rent-burdened threshold; future hikes will face affordability resistance.
Forward outlook
- Local home prices are declining (-3.0%/yr); year-one equity from $1k of loan paydown is wiped out by about $6k of value loss. Plan a longer hold.
- Hamilton County population projected at +23% by 2050 — long-run rental-demand tailwind backs the buy-and-hold thesis.
Negotiation context
- It's been on market 22 days — a 2% lower offer ($182k) is reasonable based on typical stale-listing flexibility.
Risks & watch-outs
- Watch-outs: built in 1950 — expect roof / HVAC / electrical / plumbing capex.
- Climate carrying-cost: extreme-heat days projected 7→20/yr by 2055 (HVAC capex compounding) — expect insurance premiums to compound above CPI over the hold.
Questions for the listing agent
- Have any recent inspections been done? Can we get a copy of the seller's disclosures and any deferred-maintenance estimates?
- Built in 1950 — when were the roof, HVAC, electrical panel, plumbing, and water heater last replaced?
- Is there a deadline driving the sale (1031 exchange, divorce, estate, relocation)? That informs how much negotiation room exists.
- Schools are F-rated, which usually means shorter tenancies and higher turnover. Who's the typical renter profile here, and what's been the actual vacancy rate?
- Crime grade is D in this area — have there been break-ins, vandalism, or insurance claims at this property in the last 3 years? What carrier currently insures it and at what premium?
- What's the average days-on-market for RENTAL listings here right now (not sales)? A rising rental-DOM trend means longer vacancies and softer asking-rent achievability than the comps imply.
- What's the recent tenant-quality profile in this submarket — average credit score on applications, eviction rate, late-payment / NSF rate, and stable-employment percentage? A property-management company in the area should have these aggregated.
- How much new for-sale + rental construction is in the pipeline within 1–3 miles? Heavy new supply typically softens prices + rents 12–24 months out; constrained supply supports both.
Investment metrics
- 1% rule
- 1.04% ✓
- Cap rate
- 7.82%
- Cash-on-cash
- 5.46%
- DSCR
- 1.24
- GRM
- 8.0
CMA / ARV
- ARV (on-the-fly)
- $343,330
- Comps found
- 4
Show comp detail 4 sales within ~0.75 mi
| Address | Dist | Beds/Ba | Sqft | Sold | Price | $/sf | Match |
|---|---|---|---|---|---|---|---|
| 914 Belvoir Hills Cir | 0.41mi | 4/3.0 | 2,415 (-2%) | 15mo | $335,000 | $139 | 60 |
| 901 Belvoir Hills Dr | 0.45mi | 3/2.0 (-1) | 2,216 (-10%) | 5mo | $362,000 | $163 | 53 |
| 4023 Patton Edwards Dr | 0.64mi | 3/2.0 (-1) | 2,320 (-6%) | 11mo | $125,000 | $54 | 46 |
| 5311 Greenbriar Rd | 0.73mi | 4/3.5 | 2,312 (-6%) | 21mo | $185,000 | $80 | 32 |
Match score weights: distance 35% · size 25% · config 20% · recency 20%. Top-matched comps best support the ARV.
Projected returns pro-forma
-3.0% appreciation · 0.0% rent growth · sell at horizon
- IRR
- -11.3%
- Equity multiple
- 0.60×
- Total profit
- $-20,550
- Equity at exit
- $27,584
- IRR
- -7.1%
- Equity multiple
- 0.61×
- Total profit
- $-20,151
- Equity at exit
- $15,995
Cash invested: $51,800 (down + closing). Projections, not guarantees.
Landlord ↔ Tenant lean methodology
- Overall (STATE)
- 87 Strongly Landlord-Friendly
- State Tennessee
- 87 Strongly Landlord-Friendly · R+13
- County
- — inherits STATE
- City
- — inherits STATE
ZIP-level market 37412
- Home prices YoY
- -28.8%
- Rents YoY
- -2.0%
- Active inventory
- 157
- Price-to-rent
- 8.0×
Monthly cashflow live
- Estimated rent
- $1,917 medium interval (Pro) →
- Mortgage (P&I)
- −$970
- Tax est. 1.5%
- −$231 /mo · $2,775/yr
- Insurance
- −$77
- HOA
- −$0
- Vacancy / Maint / Mgmt
- −$403
- Net cashflow
- $236
Break-even live
UW: 25.0% down · 7.5% · 30yr · 1.5% tax · 5.0% vac · 8.0% maint · 8.0% mgmt
Financing live
Cash to close
- Down payment
- $46,250
- Closing costs
- $5,550
- Reserves months
- —
- Total cash needed
- —
Loan-product check · same deal, 3 products live
Conventional
25% down · 7.5% · 30yr
- Down + closing
- —
- Monthly P&I
- —
- Monthly cashflow
- —
- DSCR
- —
- Eligible?
- —
Personal DTI + credit; lowest rate.
DSCR
20% down · 8.5% · 30yr
- Down + closing
- —
- Monthly P&I
- —
- Monthly cashflow
- —
- DSCR
- —
- Eligible?
- —
No personal income docs; deal must DSCR.
Hard money
10% down · 12.0% · 12mo
- Down + closing
- —
- Monthly P&I
- —
- Monthly cashflow
- —
- DSCR
- —
- Eligible?
- —
Short-term bridge; refi at stabilization.
Rent comps 3 comps
| Address | Beds | Baths | Sqft | Rent | $/sqft | DOM | Units | Dist |
|---|---|---|---|---|---|---|---|---|
| 1408 Mana Ln East Ridge, TN | 2.0–3.0 | 1.5–2.5 | 1357 | $1,659 | $1.22 | 13d | 3 | 0.67mi |
| 3400 Betty Ln Unit 3403 East Ridge, TN | 3.0 | 2.5 | 2500 | $1,350 | $0.54 | 23d | 1 | 1.29mi |
| 3229 Westonia Dr Chattanooga, TN | 4.0 | 2.0 | 2130 | $2,695 | $1.27 | 23d | 1 | 1.43mi |
Listing history 16 events
-
2026-06-18days on market $185,000 Active 22 DOM
-
2026-06-17days on market $185,000 Active 21 DOM
-
2026-06-16days on market $185,000 Active 20 DOM
-
2026-06-15days on market $185,000 Active 19 DOM
-
2026-06-14days on market $185,000 Active 17 DOM
-
2026-06-10days on market $185,000 Active 14 DOM
-
2026-06-09days on market $185,000 Active 13 DOM
-
2026-06-08days on market $185,000 Active 12 DOM
-
2026-06-07days on market $185,000 Active 11 DOM
-
2026-06-05days on market $185,000 Active 8 DOM
-
2026-06-03days on market $185,000 Active 7 DOM
-
2026-06-02days on market $185,000 Active 6 DOM
-
2026-06-01days on market $185,000 Active 5 DOM
-
2026-05-31days on market $185,000 Active 4 DOM
-
2026-05-30days on market $185,000 Active 3 DOM
-
2026-05-28$185,000 Active
ⓘ Source: listings_history table (triggers on properties + properties_extension) + one-shot
backfill from property_details.listing_events for pre-trigger history.
Climate risk First Street
- Flood 4/10 Moderate FEMA zone X (unshaded) · 22% chance over 30 yrs
- Wildfire 1/10 Low
- Heat 6/10 Major 7 d/yr ≥105°F today · 20 d/yr by 30 yrs out
- Wind 4/10 Moderate 11% chance of damaging wind over 30 yrs
- Air quality 3/10 Moderate 2 unhealthy d/yr today · 2 by 30 yrs out
Nearby sold comps map
Loading sold comps map…
Walkable amenities ~0.75 mi
Loading nearby amenities…
Taxation est. · year 1
- Rental income
- $23,001
- − Mortgage interest
- −$10,363
- − Property taxes
- −$2,775
- − Insurance
- −$925
- − Repairs & maintenance
- −$1,840
- − Management
- −$1,840
- − Depreciation
- −$5,382
- Taxable loss
- −$124
- Est. tax savings @ 24.0%
- +$30
- After-tax cash flow
- $2,859/yr
For passive investors: Depreciation is non-cash, so a rental often shows a tax loss while cash-flowing — sheltering income. Rental losses are passive: they offset passive income freely, and up to $25,000/yr can offset ordinary (W-2) income if you actively participate and your MAGI is under $100k (phasing out to $0 by $150k); unused losses carry forward. On sale, claimed depreciation is recaptured at up to 25%, and gains may owe capital-gains tax (a 1031 exchange can defer both). Figures are a year-1 estimate at your 24.0% rate — not tax advice; consult a CPA.
Condition & rehab AI · 12 photos
This home requires moderate renovations to improve its condition and increase its value. Key areas for improvement include the kitchen and exterior, with potential for significant value gains through fresh paint and landscaping.
Repairs flagged
- Minor Kitchen cabinets — Open cabinets with dishes visible
- Minor Bathroom counter — Items on the counter and floor
- Moderate Exterior siding — Weathered appearance
Value-add opportunities
- Both Paint interior walls and trim — Fresh paint enhances curb appeal and interior aesthetics
- Both Replace kitchen cabinets and countertops — Modern kitchen will attract more buyers and renters
- Both Landscaping and curb appeal — Well-maintained landscaping improves curb appeal and property value
Renovation cost estimate screening
| Repair item | Severity | Est. cost |
|---|---|---|
| Kitchen cabinets · Open cabinets with dishes visible | Minor | $500–3,000 |
| Bathroom counter · Items on the counter and floor | Minor | $500–3,000 |
| Exterior siding · Weathered appearance | Moderate | $3,000–15,000 |
| Total estimated repair cost · 3 items | $4,000–21,000 |
Value-add ROI direction
- Both Paint interior walls and trim — Fresh paint enhances curb appeal and interior aesthetics ↑
- Both Replace kitchen cabinets and countertops — Modern kitchen will attract more buyers and renters ↑
- Both Landscaping and curb appeal — Well-maintained landscaping improves curb appeal and property value ↑
ⓘ Cost ranges are severity-bucket heuristics (US national rule-of-thumb). Get contractor quotes + a written scope before underwriting a rehab budget.
Schools (NCES district)
- District
- Hamilton County
- NCES district ID
- 4701590
- Math proficiency
- 31% ▼ -10.00%
- Reading proficiency
- 31% ▼ -3.00%
- Median HH income
- $47,456
- Composite
- 26.8/100
- National rank
- #7122
- State rank
- #42 of 139 in TN
Livability — East Ridge
- Score
- 71/100
- State rank
- #41
- US rank
- #6686
Category grades
Schools grade is shown separately in the Schools card above.
Census & demographics
- Census place
- East Ridge, TN
- County
- Hamilton County · 312,777 people
- City population
- 21,864
- Metro
- Chattanooga, TN-GA
- Population (ZIP)
- 21,864
- Household income
- $62,508
- Rent vs Own
- Severe rent burden
- 857.0
Population outlook (Hamilton County) Hauer SSP2
- Today (2025)
- 393,784 people
- By 2030
- 412,983 · +4.9%
- By 2040
- 449,502 · +14.1%
- By 2050
- 484,341 · +23.0%
- By 2075
- 565,746 · +43.7%
- By 2100
- 618,394 · +57.0%
Race, ethnicity, and origin ACS 2023
- Neighborhood character
- Predominantly White (69%)
- Race & ethnicity
- White 69% Hispanic / Latino 15% Black 11% Two or more races 5%
- Hispanic origin (detail)
- Mexican 9% Puerto Rican 2%
- Common ancestry
- Slovak 3% Italian 2% American 2%
- Foreign-born
- 9% · Canada, Dominican Republic
- Languages at home
- 85% English-only · Spanish 12% Russian/Polish/Slavic 1% Other Indo-European 1%
Political lean MEDSL · Hamilton
- 2024 margin
- R (+13.1) · D 42.7% · R 55.7% · Other 1.6%
- 2008→2024 swing
- -1.2pp toward R · 2008: -11.8pp · 2024: -13.1pp
- All cycles
- 2024: R+13.1 2020: R+9.7 2016: R+16.6 2012: R+14.8 2008: R+11.8
Not yet ingested
- Civics
- —
Market trends
- HPI YoY
- ▼ -109.86%
- Current HPI
- 271.4004
- Rent YoY
- ▼ -2.04%
- Metro
- Chattanooga, TN-GA
- State GDP YoY
- ▲ 2.78%
- F500 in state
- 22
Industry mix (Fortune 500 HQ in TN)
| Industry | F500 HQs | Revenue |
|---|---|---|
| Healthcare | 3 | $91B |
|
||
| Retail | 3 | $72B |
|
||
| Transportation / Logistics | 1 | $88B |
|
||
| Paper / Packaging | 1 | $19B |
|
||
| Insurance | 1 | $13B |
|
||
| Energy | 1 | $12B |
|
||
Price history
1 event — show timeline
- 2026-05-28 Listed $185,000 GCAR
Cash-flow waterfall
monthlySold comps — $/sqft
last 12 mo · ≤1 miLoading sold comps…