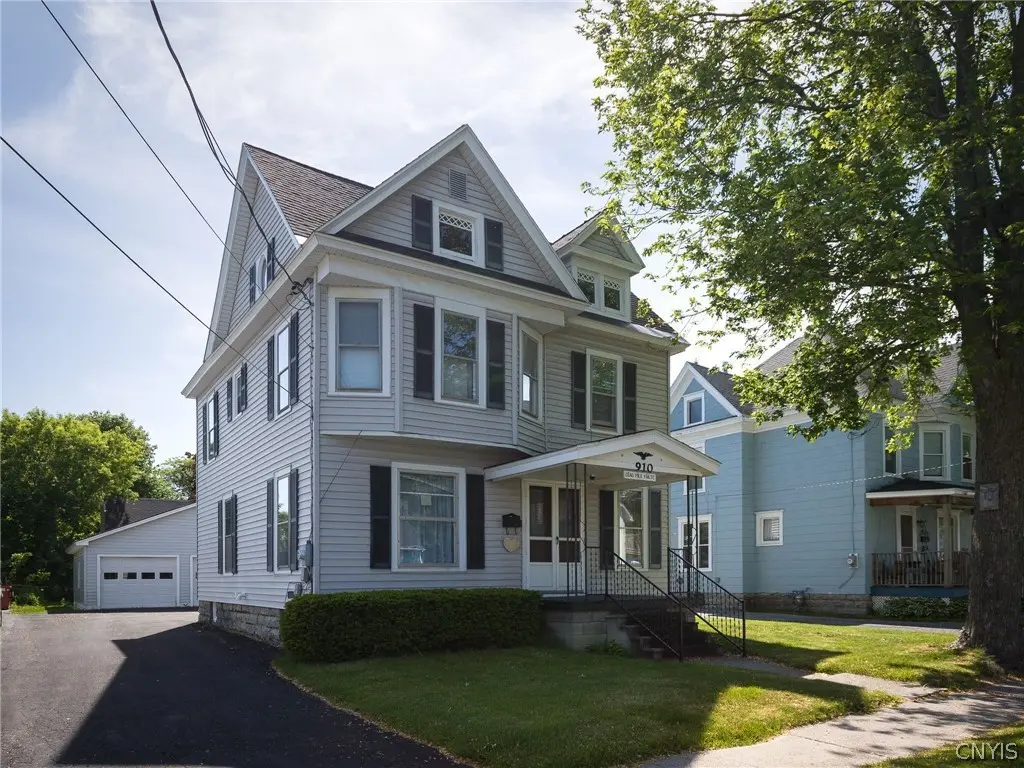
910 Franklin St · Watertown, NY
Flood risk 1/10 · Minimal
- FEMA flood zone
- X
- Chance of flooding over 30 yrs
- 0.0%
- Est. flood insurance / yr
- $473 – $860
Fire risk 1/10 · Minimal
- Est. fire insurance / yr
- $691 – $1,283
Heat risk 2/10 · Minimal
- Hot days now (above 91°F)
- 7 days/yr
- Hot days in 30 yrs
- 15 days/yr
Wind risk 1/10 · Minimal
- Chance of severe wind over 30 yrs
- 0.0%
Air-quality risk 2/10 · Minimal
- Unhealthy air days now
- 1 days/yr
- Unhealthy air days in 30 yrs
- 1 days/yr
Risk factors via First Street. Map © Google.
Why this score? — see what drove the C- grade
The composite is a weighted blend of 9 inputs, each scored 0–100. Each bar is that input's sub-score; the figure is the points it added to the 100-point composite (weight × sub-score).
- ARV discount +15.0/15.0
- Cash flow +14.0/30.0
- Rent growth +5.0/5.0
- DSCR +4.2/10.0
- Schools +3.7/10.0
- Livability +3.4/5.0
- 1% rule +3.2/10.0
- Condition / age +2.5/5.0
- Appreciation +0.0/10.0
$199,900
🖨 Deal sheet (PDF) 📄 Offer letter ✓ Due diligence
Listing remarks
Welcome home to this wonderfully well-cared-for 4-bedroom, 1.5-bath home that offers the perfect blend of comfort, character, and opportunity! The spacious eat-in kitchen provides plenty of room for everyday meals, while the formal dining room is ready for holiday gatherings and special occasions. A bright and inviting living room offers a comfortable place to relax, and the cozy sitting room with a gas fireplace is sure to become a favorite spot on chilly evenings. Convenience abounds with a first-floor laundry area and half bath. Step outside to enjoy the lovely back deck overlooking the backyard—perfect for morning coffee, summer barbecues, or simply unwinding after a long day. A d
Key facts
- Formal dining room
- Living room
- Gas fireplace
Tags
Property features AI
Exterior
- Parking: Detached garage; 2-car garage
- Utilities: Public water connected; Sewer connected
- Home design: 2-story house; Existing construction; Vinyl siding; Stone foundation
- Construction: Vinyl siding exterior; Stone foundation
- Exterior features: Blacktop driveway; Rectangular residential lot; City street frontage; Lot dimensions approximately 50 x 124
Interior
- Kitchen: Dishwasher; Free-standing range; Microwave; Oven; Refrigerator; Freezer; Eat-in kitchen
- Bedrooms: Total rooms: 9
- Flooring: Carpet; Vinyl; Varied flooring
- Bathrooms: 1 full bathroom; 1 half bathroom; 1 main-level bathroom
- Heating & cooling: Gas forced-air heating
- Interior features: Ceiling fan(s); Separate/formal dining room; Entrance foyer; Eat-in kitchen; Separate/formal living room; Full basement
- Laundry & utility: Main-level laundry; Washer; Dryer; Gas water heater
Neighborhood map
What this means for you Summary
Snapshot
- This is a 4-bed/1.5-bath single-family listed at $200k.
Deal economics
- At list price, monthly cash flow is $26 ($307/yr) — positive.
- The deal already cash-flows at list — no discount required.
- To meet the 1% rule (rent ≥ 1% of price), the offer needs to be $165k (17.6% below list).
- Recommended offer: $165k (17.6% below list) — sets the bar for 1% rule.
Location & tenants
- Location reads 68/100 on livability (#540 in NY) — a middle-class / working-renter tenant base. Strengths: health & safety A+, cost of living A-, housing A-; Watch: amenities C-, crime F, commute F.
- Watertown City School District (urban): math 34% / reading 54% proficiency, ranked #481 of 590 in NY (top 82%) — families likely to look elsewhere, expect single-tenant / working-renter base with shorter leases.
- Zoned schools: Knickerbocker School (math 32% / reading 47%, grade F, #1,444 of 2,108 statewide, top 71%, 364 students, 71% FRL); Case Middle School (math 17% / reading 41%, grade F, #566 of 729 statewide, top 78%, 626 students, 70% FRL); Watertown Senior High School (math 89% / reading 92%, grade A+, #231 of 1,100 statewide, top 21%, 1,083 students, 65% FRL) — zoned schools average 69% FRL vs 49% district-wide (20 pts higher); higher-poverty schools than district average — tighter screening recommended.
- Market conditions: Rents rising fast (+10.0%/yr); 224 active listings in the ZIP; 10 comparable units currently listed for rent nearby; rentals lingering (median 46d on market — plan ~5-8 weeks vacancy on turnover, expect pricing pressure); 100% of comp listings sitting > 30 days — soft ceiling on asking rent; 196 units permitted in Jefferson County in 2024 (0 in 5+ unit buildings).
- This rent runs 34% of the median local income ($59k/yr) — at the standard rent-burdened threshold; future hikes will face affordability resistance.
Forward outlook
- Local home prices are declining (-3.0%/yr); year-one equity from $1k of loan paydown is wiped out by about $6k of value loss. Plan a longer hold.
- Jefferson County population projected at -12% by 2050 — secular population decline; favor cash flow + early exit over multi-decade hold.
Negotiation context
- Only 11 days on market — expect competitive offers; lowballing is unlikely to land.
Risks & watch-outs
- Watch-outs: built in 1900 — expect roof / HVAC / electrical / plumbing capex.
Questions for the listing agent
- Built in 1900 — when were the roof, HVAC, electrical panel, plumbing, and water heater last replaced?
- Is there a deadline driving the sale (1031 exchange, divorce, estate, relocation)? That informs how much negotiation room exists.
- Schools are D-rated, which usually means shorter tenancies and higher turnover. Who's the typical renter profile here, and what's been the actual vacancy rate?
- Crime grade is F in this area — have there been break-ins, vandalism, or insurance claims at this property in the last 3 years? What carrier currently insures it and at what premium?
- What's the average days-on-market for RENTAL listings here right now (not sales)? A rising rental-DOM trend means longer vacancies and softer asking-rent achievability than the comps imply.
- What's the recent tenant-quality profile in this submarket — average credit score on applications, eviction rate, late-payment / NSF rate, and stable-employment percentage? A property-management company in the area should have these aggregated.
- How much new for-sale + rental construction is in the pipeline within 1–3 miles? Heavy new supply typically softens prices + rents 12–24 months out; constrained supply supports both.
Investment metrics
- 1% rule
- 0.82% ✗
- Cap rate
- 6.45%
- Cash-on-cash
- 0.55%
- DSCR
- 1.02
- GRM
- 10.1
CMA / ARV
- ARV (on-the-fly)
- $250,916
- Comps found
- 12
Show comp detail 12 sales within ~0.75 mi
| Address | Dist | Beds/Ba | Sqft | Sold | Price | $/sf | Match |
|---|---|---|---|---|---|---|---|
| 380 Brainard St | 0.09mi | 4/1.5 | 1,664 (-1%) | 1mo | $268,000 | $161 | 93 |
| 409 Broadway Ave E | 0.04mi | 3/2.0 (-1) | 1,760 (+4%) | 1mo | $262,000 | $149 | 83 |
| 711 Cadwell St | 0.13mi | 4/1.5 | 1,870 (+11%) | 1mo | $239,900 | $128 | 74 |
| 1157 Harrison St | 0.39mi | 4/2.5 | 1,664 (-1%) | 2mo | $240,000 | $144 | 74 |
| 1130 Boyd St | 0.41mi | 3/2.0 (-1) | 1,710 (+2%) | 1mo | $216,025 | $126 | 71 |
| 1013 Myrtle Ave | 0.50mi | 4/2.0 | 1,624 (-4%) | 2mo | $275,000 | $169 | 67 |
| 244 N Rutland St | 0.62mi | 4/2.5 | 1,693 (+0%) | 1mo | $233,200 | $138 | 66 |
| 1017 Myrtle Ave | 0.50mi | 3/2.0 (-1) | 1,608 (-4%) | 2mo | $252,500 | $157 | 60 |
| 662 Burchard St | 0.68mi | 3/2.0 (-1) | 1,668 (-1%) | 2mo | $140,000 | $84 | 58 |
| 1151 Harrison St | 0.38mi | 3/2.5 (-1) | 1,871 (+11%) | 0mo | $300,000 | $160 | 54 |
| 523 Emerson St | 0.58mi | 4/1.0 | 1,498 (-11%) | 1mo | $47,100 | $31 | 52 |
| 205 Michigan Ave | 0.66mi | 4/2.0 | 1,848 (+10%) | 2mo | $280,000 | $152 | 49 |
Match score weights: distance 35% · size 25% · config 20% · recency 20%. Top-matched comps best support the ARV.
Projected returns pro-forma
-3.0% appreciation · 8.0% rent growth · sell at horizon
- IRR
- -10.4%
- Equity multiple
- 0.61×
- Total profit
- $-22,092
- Equity at exit
- $29,806
- IRR
- 4.5%
- Equity multiple
- 1.40×
- Total profit
- $22,339
- Equity at exit
- $17,284
Cash invested: $55,972 (down + closing). Projections, not guarantees.
Landlord ↔ Tenant lean methodology
- Overall (STATE)
- 15 Strongly Tenant-Friendly
- State New York
- 15 Strongly Tenant-Friendly · D+10
- County
- — inherits STATE
- City
- — inherits STATE
ZIP-level market 13601
- Home prices YoY
- -5.6%
- Rents YoY
- 10.0%
- Active inventory
- 224
- Price-to-rent
- 10.1×
Monthly cashflow live
- Estimated rent
- $1,648 high interval (Pro) →
- Mortgage (P&I)
- −$1,048
- Tax from tax record
- −$145 /mo · $1,736/yr
- Insurance
- −$83
- HOA
- −$0
- Vacancy / Maint / Mgmt
- −$346
- Net cashflow
- $26
Break-even live
Sensitivity live
| Price | -10% $139 | -5% $82 | +0% $26 | +5% $-31 | +10% $-88 |
|---|---|---|---|---|---|
| Rent | -10% $-105 | -5% $-39 | +0% $26 | +5% $91 | +10% $156 |
| Rate | -1.0pp $126 | -0.5pp $76 | base $26 | +0.5pp $-26 | +1.0pp $-79 |
UW: 25.0% down · 7.5% · 30yr · 1.5% tax · 5.0% vac · 8.0% maint · 8.0% mgmt
Financing live
Cash to close
- Down payment
- $49,975
- Closing costs
- $5,997
- Reserves months
- —
- Total cash needed
- —
Loan-product check · same deal, 3 products live
Conventional
25% down · 7.5% · 30yr
- Down + closing
- —
- Monthly P&I
- —
- Monthly cashflow
- —
- DSCR
- —
- Eligible?
- —
Personal DTI + credit; lowest rate.
DSCR
20% down · 8.5% · 30yr
- Down + closing
- —
- Monthly P&I
- —
- Monthly cashflow
- —
- DSCR
- —
- Eligible?
- —
No personal income docs; deal must DSCR.
Hard money
10% down · 12.0% · 12mo
- Down + closing
- —
- Monthly P&I
- —
- Monthly cashflow
- —
- DSCR
- —
- Eligible?
- —
Short-term bridge; refi at stabilization.
Rent comps 10 comps
| Address | Beds | Baths | Sqft | Rent | $/sqft | DOM | Units | Dist |
|---|---|---|---|---|---|---|---|---|
| 621 Academy St Watertown, NY | 3.0 | 2.0 | 1652 | $1,600 | $0.97 | 45d | 1 | 0.32mi |
| 911 State St Unit 3 Watertown, NY | 3.0 | 1.0 | 1200 | $995 | $0.83 | 45d | 1 | 0.42mi |
| 123 State Pl Watertown, NY | 3.0 | 1.5 | 1500 | $1,750 | $1.17 | 45d | 1 | 0.50mi |
| 328 Clay St Unit 3 Watertown, NY | 3.0 | 2.0 | 1500 | $1,650 | $1.10 | 45d | 1 | 0.52mi |
| 1029 Gill St Watertown, NY | 3.0 | 1.0 | 1275 | $1,950 | $1.53 | 45d | 1 | 0.65mi |
| 256 Michigan Ave Watertown, NY | 2.0–4.0 | 1.0–2.5 | 1435 | $1,626 | $1.13 | 45d | 9 | 0.93mi |
| 1815 Olmstead Dr Watertown, NY | 2.0–4.0 | 1.0–2.0 | 1380 | $1,676 | $1.21 | 45d | 6 | 1.13mi |
| 611 Cooper St Watertown, NY | 3.0 | 1.0 | 1190 | $1,495 | $1.26 | 45d | 1 | 1.16mi |
| 377 W Main St Unit 1 Watertown, NY | 3.0 | 1.0 | 1991 | $1,350 | $0.68 | 45d | 1 | 1.20mi |
| 2240 Kristina Park Watertown, NY | 1.0–3.0 | 1.0–2.0 | 1072 | $1,615 | $1.51 | 45d | 5 | 1.34mi |
Listing history 9 events
-
2026-06-21days on market $199,900 Active 11 DOM
-
2026-06-19days on market $199,900 Active 9 DOM
-
2026-06-18days on market $199,900 Active 8 DOM
-
2026-06-17days on market $199,900 Active 7 DOM
-
2026-06-16days on market $199,900 Active 6 DOM
-
2026-06-15days on market $199,900 Active 5 DOM
-
2026-06-14days on market $199,900 Active 3 DOM
-
2026-06-12remarks 693-char remark
-
2026-06-12$199,900 Active 2 DOM
ⓘ Source: listings_history table (triggers on properties + properties_extension) + one-shot
backfill from property_details.listing_events for pre-trigger history.
Tax reassessment forecast NY · Partial reset (capped growth)
- Current annual tax
- $1,736 · $145/mo
- Projected year-2 tax
- $2,557 · $213/mo
- Expected delta
- +$821/yr (+$68/mo · 47.3%)
ⓘ Screening estimate from a state-policy table — verify with the county assessor before closing.
Climate risk First Street
- Flood 1/10 Low FEMA zone X · 0% chance over 30 yrs
- Wildfire 1/10 Low
- Heat 2/10 Low 7 d/yr ≥91°F today · 15 d/yr by 30 yrs out
- Wind 1/10 Low 0% chance of damaging wind over 30 yrs
- Air quality 2/10 Low 1 unhealthy d/yr today · 1 by 30 yrs out
Nearby sold comps map
Loading sold comps map…
Walkable amenities ~0.75 mi
Loading nearby amenities…
Taxation est. · year 1
- Rental income
- $19,775
- − Mortgage interest
- −$11,198
- − Property taxes
- −$1,736
- − Insurance
- −$1,000
- − Repairs & maintenance
- −$1,582
- − Management
- −$1,582
- − Depreciation
- −$5,815
- Taxable loss
- −$3,137
- Est. tax savings @ 24.0%
- +$753
- After-tax cash flow
- $1,060/yr
For passive investors: Depreciation is non-cash, so a rental often shows a tax loss while cash-flowing — sheltering income. Rental losses are passive: they offset passive income freely, and up to $25,000/yr can offset ordinary (W-2) income if you actively participate and your MAGI is under $100k (phasing out to $0 by $150k); unused losses carry forward. On sale, claimed depreciation is recaptured at up to 25%, and gains may owe capital-gains tax (a 1031 exchange can defer both). Figures are a year-1 estimate at your 24.0% rate — not tax advice; consult a CPA.
Schools (NCES district)
- District
- Watertown City School District
- NCES district ID
- 3630120
- Math proficiency
- 34% ▼ -10.00%
- Reading proficiency
- 54% ▲ 12.00%
- Median HH income
- $40,919
- Composite
- 36.86/100
- National rank
- #4551
- State rank
- #481 of 590 in NY
Livability — Watertown
- Score
- 68/100
- State rank
- #540
- US rank
- #9700
Category grades
Schools grade is shown separately in the Schools card above.
Census & demographics
- Census place
- Watertown, NY
- County
- Jefferson County · 47,417 people
- City population
- 36,839
- Metro
- Watertown-Fort Drum, NY
- Population (ZIP)
- 36,839
- Household income
- $58,791
- Rent vs Own
- Severe rent burden
- 1634.0
Population outlook (Jefferson County) Hauer SSP2
- Today (2025)
- 111,748 people
- By 2030
- 109,370 · -2.1%
- By 2040
- 103,828 · -7.1%
- By 2050
- 98,523 · -11.8%
- By 2075
- 91,422 · -18.2%
- By 2100
- 78,214 · -30.0%
Race, ethnicity, and origin ACS 2023
- Neighborhood character
- Predominantly White (82%)
- Race & ethnicity
- White 82% Two or more races 7% Hispanic / Latino 6% Black 4% Asian 2%
- Hispanic origin (detail)
- Mexican 2% Puerto Rican 2%
- Common ancestry
- Lithuanian 7% Romanian 3% Slovak 2%
- Foreign-born
- 4% · Canada
- Languages at home
- 94% English-only · Spanish 3% Other Indo-European 1% German/W. Germanic 1%
Political lean MEDSL · Jefferson
- 2024 margin
- Strong R (+23.6) · D 38.2% · R 61.8%
- 2008→2024 swing
- -18.3pp toward R · 2008: -5.3pp · 2024: -23.6pp
- All cycles
- 2024: R+23.6 2020: R+19.0 2016: R+22.4 2012: R+2.9 2008: R+5.3
Not yet ingested
- Civics
- —
Market trends
- HPI YoY
- ▼ -18.86%
- Current HPI
- 316.636
- Rent YoY
- ▲ 9.96%
- Metro
- Watertown-Fort Drum, NY
- State GDP YoY
- ▲ 2.60%
- F500 in state
- 92
Industry mix (Fortune 500 HQ in NY)
| Industry | F500 HQs | Revenue |
|---|---|---|
| Financial Services | 10 | $950B |
|
||
| Consumer Goods | 9 | $162B |
|
||
| Insurance | 4 | $225B |
|
||
| Telecommunications | 2 | $144B |
|
||
| Pharmaceuticals | 2 | $112B |
|
||
| Media / Entertainment | 2 | $69B |
|
||
Price history
1 event — show timeline
- 2026-06-09 Listed $199,900 CNYIS
Property tax history
+15.3%/yrLatest (2025): $1,736 · +4.6% YoY. Source: county tax records.
Cash-flow waterfall
monthlySold comps — $/sqft
last 12 mo · ≤1 miLoading sold comps…