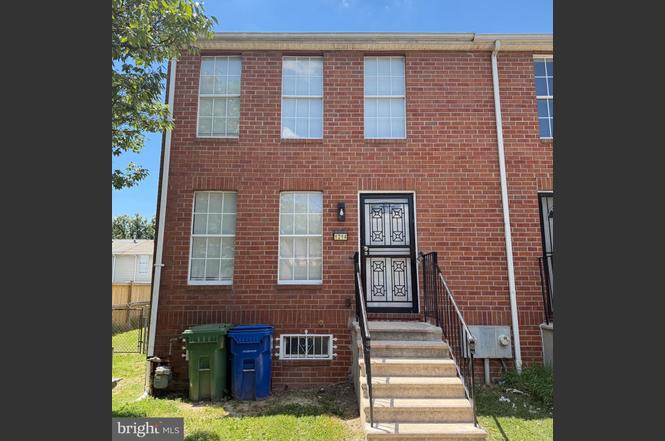
1214 N Woodyear St · Baltimore, MD
Flood risk 1/10 · Minimal
- FEMA flood zone
- X (unshaded)
- Chance of flooding over 30 yrs
- 0.0%
- Est. flood insurance / yr
- $473 – $860
Fire risk 1/10 · Minimal
- Est. fire insurance / yr
- $755 – $1,403
Heat risk 7/10 · Major
- Hot days now (above 103°F)
- 7 days/yr
- Hot days in 30 yrs
- 15 days/yr
Wind risk 6/10 · Moderate
- Chance of severe wind over 30 yrs
- 27.0%
Air-quality risk 4/10 · Minor
- Unhealthy air days now
- 6 days/yr
- Unhealthy air days in 30 yrs
- 7 days/yr
Risk factors via First Street. Map © Google.
Why this score? — see what drove the D- grade
The composite is a weighted blend of 9 inputs, each scored 0–100. Each bar is that input's sub-score; the figure is the points it added to the 100-point composite (weight × sub-score).
- Cash flow +13.6/30.0
- ARV discount +7.5/15.0
- Rent growth +4.2/5.0
- DSCR +4.1/10.0
- Livability +3.8/5.0
- 1% rule +3.1/10.0
- Condition / age +2.5/5.0
- Schools +1.0/10.0
- Appreciation +0.0/10.0
$228,000
🖨 Deal sheet 📄 Offer letter ✓ Due diligence
Listing remarks MLS
GREAT OPPORTUNITY! This End Unit property was made for an investor with vision, and is located on a street where families take pride in their home. The backyard is beautiful, spacious, and just waiting for barbecues. If you're an investor looking to add to your rental portfolio, this home is perfect. The furnace is in great condition and the water heater was purchased this year. Rental rates in the area have seen prices in and over $1800. Come check it out. HOME IS BEING SOLD AS-IS.
Key facts
- Bright main level
- Sleek cabinetry
- Open layout
Tags
Property features AI
Finance
- Other: Below-grade area includes finished and unfinished spaces; Finished above-grade area and below-grade finished area reported (sources: assessor/estimated); Ground rent paid annually
Exterior
- Parking: On-street parking
- Utilities: Public water; Public sewer; Natural gas available; Electric available; Water and sewer available; 110 volt electric with circuit breakers
- Home design: End of row townhouse; Fee simple ownership; Year built/effective remodel listed as 2026
- Construction: Frame construction; Block foundation; Asbestos shingle roof; Double-pane windows
- Exterior features: Chain link fencing (fully fenced); Above-grade and below-grade structures
Interior
- Kitchen: ENERGY STAR dishwasher; ENERGY STAR refrigerator; Exhaust fan; Gas oven/range
- Bedrooms: Four bedrooms on the main level
- Flooring: Hardwood; Luxury vinyl plank
- Bathrooms: Three full bathrooms (all on the main level)
- Heating & cooling: 90% efficiency forced air heating (natural gas); Central air conditioning (natural gas for cooling fuel)
- Interior features: Drywall walls and ceilings; Connecting stairway to basement; Not located in a federal flood zone; Accessibility features present
- Laundry & utility: Laundry in basement; Natural gas hot water
Neighborhood map
What this means for you Summary
Snapshot
- This is a 4-bed/3.0-bath townhouse listed at $228k.
Deal economics
- At list price, monthly cash flow is $12 ($144/yr) — positive.
- The deal already cash-flows at list — no discount required.
- To meet the 1% rule (rent ≥ 1% of price), the offer needs to be $186k (18.6% below list).
- Recommended offer: $186k (18.6% below list) — sets the bar for 1% rule.
Location & tenants
- Location reads 76/100 on livability (#90 in MD, #3,396 nationally) — a middle-class / working-renter tenant base. Strengths: amenities A+, commute A+, housing A+; Watch: schools D, crime F.
- Baltimore City Public Schools (urban): math 7% / reading 16% proficiency, ranked #24 of 24 in MD (top 100%) — low school quality limits family demand, transient renter base, plan for 1-2y turnover; 79% free/reduced lunch — lower-income household profile, screen leases tightly.
- Market conditions: Rents rising fast (+6.6%/yr); 331 active listings in the ZIP; 40 comparable units currently listed for rent nearby; rentals at typical pace (median 24d on market — plan ~3-4 weeks tenant-placement turnaround); lower-income renter base — watch delinquency; 1,273 units permitted in Baltimore city in 2024 (1,104 in 5+ unit buildings).
- At $1,856/mo this rent would consume 58% of the median local household income ($38k/yr) (locally 2921% of renters already pay >50% of income on rent) — very limited rent-growth headroom before tenants either downsize or default.
Forward outlook
- Local home prices are declining (-3.0%/yr); year-one equity from $2k of loan paydown is wiped out by about $7k of value loss. Plan a longer hold.
- Baltimore County population projected to shrink 4% by 2050 — rents likely to lag national; underwrite the cash flow, not the appreciation.
Negotiation context
- Only 5 days on market — expect competitive offers; lowballing is unlikely to land.
- 3 sale attempts since 22y ago with the ask held roughly flat each time — persistent listings suggest the price (not the market) is what's stuck; bring a comps-based counter.
- Current owner paid $68k; list at $228k implies a 233% gain — meaningful room to come down on a strong offer.
Risks & watch-outs
- Climate carrying-cost: major wind risk, 27% chance of damaging wind over 30y; extreme-heat days projected 7→15/yr by 2055 (HVAC capex compounding) — expect insurance premiums to compound above CPI over the hold.
Questions for the listing agent
- Is there a deadline driving the sale (1031 exchange, divorce, estate, relocation)? That informs how much negotiation room exists.
- Schools are D-rated, which usually means shorter tenancies and higher turnover. Who's the typical renter profile here, and what's been the actual vacancy rate?
- Crime grade is F in this area — have there been break-ins, vandalism, or insurance claims at this property in the last 3 years? What carrier currently insures it and at what premium?
- The area grade is low — what's the realistic commute time and amenity access for the typical tenant pool here? Any planned neighborhood developments (good or bad) we should know about?
- What's the average days-on-market for RENTAL listings here right now (not sales)? A rising rental-DOM trend means longer vacancies and softer asking-rent achievability than the comps imply.
- What's the recent tenant-quality profile in this submarket — average credit score on applications, eviction rate, late-payment / NSF rate, and stable-employment percentage? A property-management company in the area should have these aggregated.
- How much new for-sale + rental construction is in the pipeline within 1–3 miles? Heavy new supply typically softens prices + rents 12–24 months out; constrained supply supports both.
Investment metrics
- 1% rule
- 0.81% ✗
- Cap rate
- 6.36%
- Cash-on-cash
- 0.22%
- DSCR
- 1.01
- GRM
- 10.2
CMA / ARV
- ARV (on-the-fly)
- $68,040
- Comps found
- 12
Show comp detail 12 sales within ~0.75 mi
| Address | Dist | Beds/Ba | Sqft | Sold | Price | $/sf | Match |
|---|---|---|---|---|---|---|---|
| 1201 N Calhoun St | 0.03mi | 3/2.5 (-1) | 1,080 (0%) | 5mo | $102,000 | $94 | 88 |
| 1214 N Woodyear St | 0.00mi | 3/2.0 (-1) | 1,080 (0%) | 5mo | $68,500 | $63 | 87 |
| 1222 N Calhoun St | 0.04mi | 3/1.0 (-1) | 1,080 (0%) | 10mo | $105,000 | $97 | 76 |
| 1552 N Fulton Ave | 0.42mi | 3/1.0 (-1) | 1,113 (+3%) | 4mo | $125,000 | $112 | 59 |
| 1705 N Payson St | 0.63mi | 3/1.5 (-1) | 1,100 (+2%) | 5mo | $38,000 | $35 | 53 |
| 1516 N Gilmor St | 0.28mi | 3/1.0 (-1) | 990 (-8%) | 10mo | $50,000 | $51 | 52 |
| 1541 N Pulaski St | 0.63mi | 3/1.0 (-1) | 1,100 (+2%) | 3mo | $115,000 | $105 | 52 |
| 1603 Clifton Ave | 0.70mi | 3/1.0 (-1) | 1,100 (+2%) | 2mo | $130,000 | $118 | 49 |
| 2109 N Fulton Ave N | 0.73mi | 3/1.0 (-1) | 1,100 (+2%) | 4mo | $35,000 | $32 | 46 |
| 1537 N Smallwood St | 0.70mi | 3/1.5 (-1) | 1,200 (+11%) | 3mo | $56,000 | $47 | 35 |
| 1819 Arunah Ave | 0.63mi | 4/1.0 | 1,220 (+13%) | 8mo | $44,000 | $36 | 35 |
| 2440 Mcculloh St | 0.66mi | 3/1.5 (-1) | 1,224 (+13%) | 8mo | $75,000 | $61 | 29 |
Match score weights: distance 35% · size 25% · config 20% · recency 20%. Top-matched comps best support the ARV.
Projected returns pro-forma
-3.0% appreciation · 6.63% rent growth · sell at horizon
- IRR
- -12.3%
- Equity multiple
- 0.54×
- Total profit
- $-29,207
- Equity at exit
- $33,996
- IRR
- 1.2%
- Equity multiple
- 1.10×
- Total profit
- $6,418
- Equity at exit
- $19,713
Cash invested: $63,840 (down + closing). Projections, not guarantees.
Landlord ↔ Tenant lean methodology
- Overall (CITY)
- 12 Strongly Tenant-Friendly
- State Maryland
- 27 Tenant-Leaning · D+14
- County
- — inherits STATE
- City Baltimore
- 12 Strongly Tenant-Friendly · D+58
ZIP-level market 21217
- Rents YoY
- 6.6%
- Active inventory
- 331
- Price-to-rent
- 10.2×
Monthly cashflow live
- Estimated rent
- $1,856 high interval (Pro) →
- Mortgage (P&I)
- −$1,196
- Tax from tax record
- −$163 /mo · $1,959/yr
- Insurance
- −$95
- HOA
- −$0
- Vacancy / Maint / Mgmt
- −$390
- Net cashflow
- $12
Break-even live
UW: 25.0% down · 7.5% · 30yr · 1.5% tax · 5.0% vac · 8.0% maint · 8.0% mgmt
Financing live
Cash to close
- Down payment
- $57,000
- Closing costs
- $6,840
- Reserves months
- —
- Total cash needed
- —
Loan-product check · same deal, 3 products live
Conventional
25% down · 7.5% · 30yr
- Down + closing
- —
- Monthly P&I
- —
- Monthly cashflow
- —
- DSCR
- —
- Eligible?
- —
Personal DTI + credit; lowest rate.
DSCR
20% down · 8.5% · 30yr
- Down + closing
- —
- Monthly P&I
- —
- Monthly cashflow
- —
- DSCR
- —
- Eligible?
- —
No personal income docs; deal must DSCR.
Hard money
10% down · 12.0% · 12mo
- Down + closing
- —
- Monthly P&I
- —
- Monthly cashflow
- —
- DSCR
- —
- Eligible?
- —
Short-term bridge; refi at stabilization.
Rent comps 40 comps
| Address | Beds | Baths | Sqft | Rent | $/sqft | DOM | Units | Dist |
|---|---|---|---|---|---|---|---|---|
| 910 N Arlington Ave Unit 2 Baltimore, MD | 4.0 | 2.0 | 1220 | $1,850 | $1.52 | 23d | 1 | 0.30mi |
| 834 N Stricker St Baltimore, MD | 4.0 | 1.0 | 1200 | $1,500 | $1.25 | 20d | 1 | 0.31mi |
| 2028 Druid Hill Ave Baltimore, MD | 3.0 | 2.5 | 1437 | $1,799 | $1.25 | 10d | 1 | 0.40mi |
| 2028 Druid Hill Ave Unit 1 Baltimore, MD | 3.0 | 2.5 | 1437 | $1,750 | $1.22 | 2d | 1 | 0.40mi |
| 519 Sanford Pl Baltimore, MD | 3.0 | 1.0 | 1300 | $1,650 | $1.27 | 16d | 1 | 0.43mi |
| 1931 McCulloh St Unit 1 Baltimore, MD | 3.0 | 1.0 | 1000 | $1,500 | $1.50 | 43d | 1 | 0.46mi |
| 1914 Mosher St Unit 1914 Baltimore, MD | 4.0 | 2.5 | 1200 | $1,700 | $1.42 | 43d | 1 | 0.48mi |
| 1624 Westwood Ave Baltimore, MD | 3.0 | 2.0 | 1000 | $1,900 | $1.90 | 43d | 1 | 0.49mi |
| 1806 N Mount St Baltimore, MD | 3.0 | 3.0 | 1200 | $1,700 | $1.42 | 19d | 1 | 0.51mi |
| 1729 N Fulton Ave Baltimore, MD | 3.0 | 2.0 | 1081 | $1,795 | $1.66 | 43d | 1 | 0.51mi |
| 1501 N Payson St Baltimore, MD | 3.0 | 1.0 | 1400 | $1,550 | $1.11 | 43d | 1 | 0.53mi |
| 1049 Brantley Ave Unit 2 Baltimore, MD | 3.0 | 1.0 | 1200 | $1,350 | $1.12 | 23d | 1 | 0.54mi |
| 1625 Edmondson Ave Unit 2 Baltimore, MD | 4.0 | 3.0 | 1500 | $1,895 | $1.26 | 12d | 1 | 0.58mi |
| 1625 Edmondson Ave Unit 1 Baltimore, MD | 4.0 | 3.0 | 1500 | $2,175 | $1.45 | 4d | 1 | 0.58mi |
| 1722 N Monroe St Baltimore, MD | 3.0 | 1.5 | 1000 | $1,350 | $1.35 | 23d | 1 | 0.58mi |
| 2409 Francis St Baltimore, MD | 3.0 | 1.0 | 1298 | $1,500 | $1.16 | 43d | 1 | 0.60mi |
| 2614 Pennsylvania Ave Baltimore, MD | 1.0–3.0 | 1.0–2.0 | 982 | $1,141 | $1.16 | 4d | 4 | 0.63mi |
| 1515 Retreat St Baltimore, MD | 3.0 | 2.0 | 1098 | $1,800 | $1.64 | 23d | 1 | 0.65mi |
| 1507 Retreat St Unit 1 Baltimore, MD | 3.0 | 3.0 | 1098 | $2,500 | $2.28 | 43d | 1 | 0.66mi |
| 2505 Woodbrook Ave Baltimore, MD | 4.0 | 2.0 | 1256 | $1,745 | $1.39 | 2d | 1 | 0.67mi |
| 2511 Madison Ave #2 Baltimore, MD | 3.0 | 1.0 | 1100 | $1,650 | $1.50 | 43d | 1 | 0.76mi |
| 2301 Riggs Ave Baltimore, MD | 3.0 | 2.0 | 1072 | $1,600 | $1.49 | 23d | 1 | 0.77mi |
| 918 N Bentalou St Baltimore, MD | 3.0 | 1.5 | 1485 | $1,750 | $1.18 | 43d | 1 | 0.78mi |
| 1519 Penrose Ave Baltimore, MD | 3.0 | 2.0 | 1200 | $1,875 | $1.56 | 43d | 1 | 0.82mi |
| 2303 Calverton Heights Ave Baltimore, MD | 4.0 | 2.0 | 1314 | $2,250 | $1.71 | 23d | 1 | 0.84mi |
| 307 Dolphin St Baltimore, MD | 1.0–3.0 | 1.0 | 732 | $2,149 | $2.94 | 17d | 3 | 0.84mi |
| 2401 Brookfield Ave Baltimore, MD | 2.0–3.0 | 1.0–2.0 | 1102 | $1,675 | $1.52 | 23d | 3 | 0.87mi |
| 1816 N Bentalou St Baltimore, MD | 3.0 | 2.0 | 1350 | $1,700 | $1.26 | 10d | 1 | 0.87mi |
| 1816 N Bentalou St Baltimore, MD | 3.0 | 2.0 | 1350 | $1,700 | $1.26 | 23d | 1 | 0.87mi |
| 2012 W Saratoga St Baltimore, MD | 3.0 | 1.0 | 1300 | $1,700 | $1.31 | 23d | 1 | 0.90mi |
| 101 N Schroeder St Baltimore, MD | 3.0 | 1.0–2.0 | 1037 | $3,185 | $3.07 | 2d | 12 | 0.94mi |
| 2204 Clifton Ave Baltimore, MD | 3.0 | 1.0 | 1400 | $1,450 | $1.04 | 4d | 1 | 0.95mi |
| 810 Brooks Ln Unit 2 Baltimore, MD | 3.0 | 1.0 | 900 | $1,350 | $1.50 | 20d | 1 | 0.96mi |
| 2231 Orem Ave Baltimore, MD | 3.0 | 1.5 | 1140 | $1,750 | $1.54 | 17d | 1 | 0.97mi |
| 1839 W Fayette St Baltimore, MD | 3.0 | 1.5 | 1426 | $1,675 | $1.17 | 23d | 1 | 1.01mi |
| 2216 Whittier Ave Baltimore, MD | 5.0 | 1.5 | 1392 | $1,975 | $1.42 | 23d | 1 | 1.02mi |
| 1635 Frederick Ave Baltimore, MD | 3.0 | 2.0 | 1224 | $1,850 | $1.51 | 43d | 1 | 1.07mi |
| 628 N Eutaw St Baltimore, MD | 1.0–3.0 | 1.0–2.0 | 824 | $1,854 | $2.25 | 1d | 6 | 1.07mi |
| 1315 Hollins St Unit 2 Baltimore, MD | 3.0 | 2.0 | 1096 | $1,860 | $1.70 | 4d | 1 | 1.08mi |
| 1315 Hollins St Unit 2 Baltimore, MD | 3.0 | 2.0 | 1096 | $1,950 | $1.78 | 12d | 1 | 1.08mi |
Listing history 5 events
-
2026-06-18days on market $228,000 Active 5 DOM
-
2026-06-17days on market $228,000 Active 4 DOM
-
2026-06-16days on market $228,000 Active 3 DOM
-
2026-06-15remarks 687-char remark
-
2026-06-15$228,000 Active 2 DOM
ⓘ Source: listings_history table (triggers on properties + properties_extension) + one-shot
backfill from property_details.listing_events for pre-trigger history.
Tax reassessment forecast MD · Partial reset (capped growth)
- Current annual tax
- $1,959 · $163/mo
- Projected year-2 tax
- $2,222 · $185/mo
- Expected delta
- +$263/yr (+$22/mo · 13.4%)
ⓘ Screening estimate from a state-policy table — verify with the county assessor before closing.
Climate risk First Street
- Flood 1/10 Low FEMA zone X (unshaded) · 0% chance over 30 yrs
- Wildfire 1/10 Low
- Heat 7/10 Severe 7 d/yr ≥103°F today · 15 d/yr by 30 yrs out
- Wind 6/10 Major 27% chance of damaging wind over 30 yrs
- Air quality 4/10 Moderate 6 unhealthy d/yr today · 7 by 30 yrs out
Nearby sold comps map
Loading sold comps map…
Walkable amenities ~0.75 mi
Loading nearby amenities…
Taxation est. · year 1
- Rental income
- $22,266
- − Mortgage interest
- −$12,772
- − Property taxes
- −$1,959
- − Insurance
- −$1,140
- − Repairs & maintenance
- −$1,781
- − Management
- −$1,781
- − Depreciation
- −$6,633
- Taxable loss
- −$3,800
- Est. tax savings @ 24.0%
- +$912
- After-tax cash flow
- $1,055/yr
For passive investors: Depreciation is non-cash, so a rental often shows a tax loss while cash-flowing — sheltering income. Rental losses are passive: they offset passive income freely, and up to $25,000/yr can offset ordinary (W-2) income if you actively participate and your MAGI is under $100k (phasing out to $0 by $150k); unused losses carry forward. On sale, claimed depreciation is recaptured at up to 25%, and gains may owe capital-gains tax (a 1031 exchange can defer both). Figures are a year-1 estimate at your 24.0% rate — not tax advice; consult a CPA.
Schools (NCES district)
- District
- Baltimore City Public Schools
- NCES district ID
- 2400090
- Math proficiency
- 7% ▼ -9.00%
- Reading proficiency
- 16% ▼ -5.00%
- Median HH income
- $42,108
- Composite
- 10.08/100
- National rank
- #9805
- State rank
- #24 of 24 in MD
Livability — Baltimore
- Score
- 76/100
- State rank
- #90
- US rank
- #3396
Category grades
Schools grade is shown separately in the Schools card above.
Census & demographics
- Census place
- Baltimore, MD
- County
- Baltimore City · 558,601 people
- City population
- 588,727
- Metro
- Baltimore-Columbia-Towson, MD
- Population (ZIP)
- 30,792
- Household income
- $38,409
- Rent vs Own
- Severe rent burden
- 2921.0
Population outlook (Baltimore County) Hauer SSP2
- Today (2025)
- 624,249 people
- By 2030
- 621,541 · -0.4%
- By 2040
- 609,756 · -2.3%
- By 2050
- 597,249 · -4.3%
- By 2075
- 552,236 · -11.5%
- By 2100
- 513,934 · -17.7%
Race, ethnicity, and origin ACS 2023
- Neighborhood character
- Predominantly Black (81%)
- Race & ethnicity
- Black 81% White 12% Two or more races 4% Hispanic / Latino 2% Asian 2%
- Common ancestry
- Romanian 1% Hispanic 1% Italian 1%
- Foreign-born
- 5% · Canada, China, South Korea
- Languages at home
- 94% English-only · Spanish 2% French/Haitian/Cajun 1% Chinese 1%
Political lean MEDSL · Baltimore
- 2024 margin
- Solid D (+73.0) · D 85.2% · R 12.2% · Other 2.6%
- 2008→2024 swing
- -2.5pp toward R · 2008: 75.5pp · 2024: 73.0pp
- All cycles
- 2024: D+73.0 2020: D+76.6 2016: D+74.6 2012: D+76.4 2008: D+75.5
Not yet ingested
- Civics
- —
Market trends
- HPI YoY
- ▼ -187.20%
- Current HPI
- 104.2102
- Rent YoY
- ▲ 6.63%
- Metro
- Baltimore-Columbia-Towson, MD
- State GDP YoY
- ▲ 2.97%
- F500 in state
- 12
Industry mix (Fortune 500 HQ in MD)
| Industry | F500 HQs | Revenue |
|---|---|---|
| Aerospace / Defense | 1 | $71B |
|
||
| Utilities | 1 | $25B |
|
||
| Hotels | 1 | $24B |
|
||
| Consumer Goods | 1 | $7B |
|
||
| Real Estate | 1 | $6B |
|
||
| Chemicals | 1 | $2B |
|
||
Price history
+230.4% since first listed9 events — show timeline
- 2026-06-13 Listed $228,000 BRIGHT MLS
- 2026-03-05 Sold (Public Records) $68,500 Public Records
- 2026-01-16 Sold (MLS) $68,500 BRIGHT MLS
- 2025-12-29 Pending — BRIGHT MLS
- 2025-12-23 Listed $85,000 BRIGHT MLS
- 2004-12-07 Sold (Public Records) $69,000 Public Records
- 2004-11-20 Sold (MLS) $69,000 MRIS
- 2004-10-25 Delisted — MRIS
- 2004-10-19 Listed $69,000 MRIS
Property tax history
+4.8%/yrLatest (2025): $1,959 · +8.6% YoY. Source: county tax records.
Cash-flow waterfall
monthlySold comps — $/sqft
last 12 mo · ≤1 miLoading sold comps…