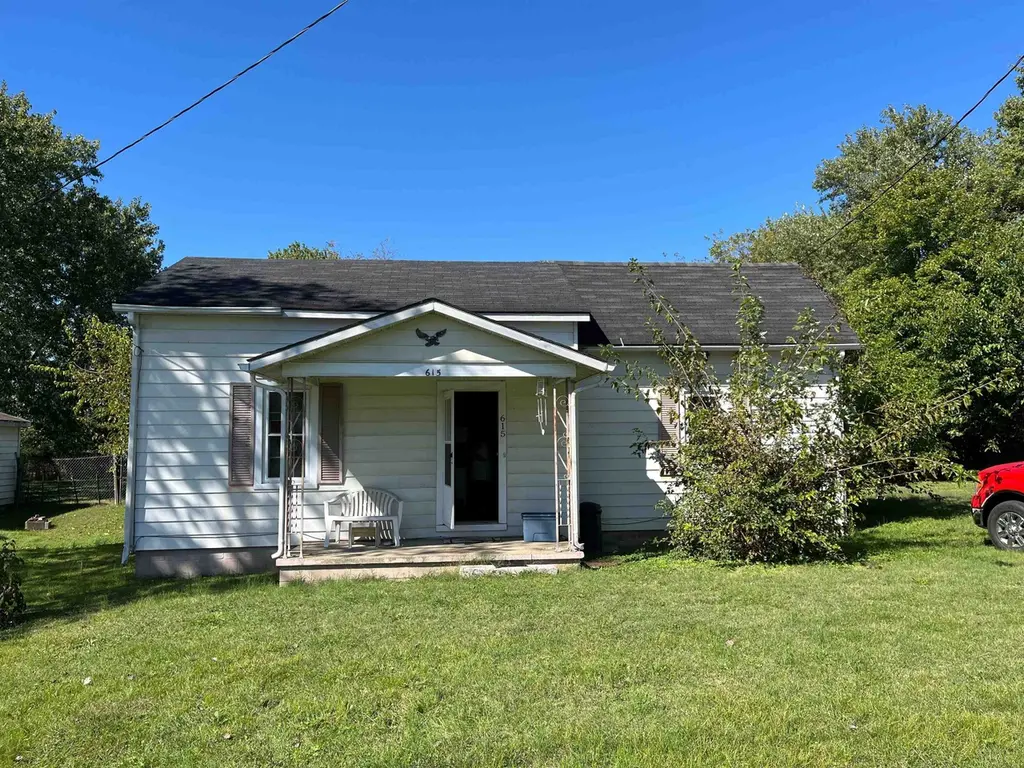
615 Wyatt Ave · Madisonville, KY
Flood risk 1/10 · Minimal
- FEMA flood zone
- X (unshaded)
- Chance of flooding over 30 yrs
- 0.0%
- Est. flood insurance / yr
- $507 – $1,088
Fire risk 3/10 · Minor
- Est. fire insurance / yr
- $839 – $1,559
Heat risk 5/10 · Moderate
- Hot days now (above 108°F)
- 7 days/yr
- Hot days in 30 yrs
- 20 days/yr
Wind risk 3/10 · Minor
- Chance of severe wind over 30 yrs
- 6.0%
Air-quality risk 2/10 · Minimal
- Unhealthy air days now
- 1 days/yr
- Unhealthy air days in 30 yrs
- 1 days/yr
Risk factors via First Street. Map © Google.
Why this score? — see what drove the B- grade
The composite is a weighted blend of 9 inputs, each scored 0–100. Each bar is that input's sub-score; the figure is the points it added to the 100-point composite (weight × sub-score).
- Cash flow +30.0/30.0
- 1% rule +10.0/10.0
- DSCR +10.0/10.0
- ARV discount +7.5/15.0
- Livability +3.6/5.0
- Schools +3.0/10.0
- Rent growth +2.5/5.0
- Condition / age +2.5/5.0
- Appreciation +0.0/10.0
$40,000
🖨 Deal sheet 📄 Offer letter ✓ Due diligence
Listing remarks
Investor special! This 2-bedroom, 1-bath home at 615 Wyatt Ave in Madisonville is ready for renovation. With some work, it could be a great rental or flip opportunity. Conveniently located near local shops and restaurants, this property offers solid potential at an affordable price. Home needs repairs and updates but has plenty of upside for the right buyer. Listed at $34,900, this is a great chance to build equity or add to your investment portfolio.
Key facts
- Near restaurants
- Near local shops
- 0.3 acre lot
Tags
Property features AI
Exterior
- Parking: 1-car garage
- Utilities: Public water; Public sewer
- Home design: Single-family residence; 1 story
- Construction: Aluminum siding
- Exterior features: Level lot
Interior
- Kitchen: Range; Refrigerator; Gas water heater
- Flooring: Carpet; Hardwood
- Bathrooms: 1 full bathroom
- Heating & cooling: Floor furnace heating; Window unit cooling
- Interior features: Eat-in kitchen; Crawl space basement
Neighborhood map
What this means for you Summary
Snapshot
- This is a 2-bed/1.0-bath single-family listed at $40k.
Deal economics
- At list price, monthly cash flow is $628 ($8k/yr) — positive.
- The deal already cash-flows at list — no discount required.
- Meets the 1% rule at list price ($1k rent vs $40k).
- Cap rate 25.1% vs local median 4.0% in Madisonville — top-decile yield for the area; either an underpriced asset or a hidden risk that comps aren't pricing in. Stress-test before assuming the spread holds.
Location & tenants
- Location reads 72/100 on livability (#132 in KY) — a middle-class / working-renter tenant base. Strengths: crime A+, cost of living A+, housing A+; Watch: amenities F, commute F, employment F.
- Hopkins County (town): math 27% / reading 43% proficiency, ranked #65 of 165 in KY (top 39%) — families likely to look elsewhere, expect single-tenant / working-renter base with shorter leases.
- Zoned schools: Pride Elementary School (math 67% / reading 67%, grade B+, #13 of 676 statewide, top 2%, 475 students, 60% FRL); Browning Springs Middle School (math 18% / reading 40%, grade F, #156 of 217 statewide, top 74%, 499 students, 63% FRL); Madisonville North Hopkins High School (math 30% / reading 38%, grade F, #89 of 254 statewide, top 36%, 1,189 students, 46% FRL) — zoned schools at 56% FRL track the district average.
- Market conditions: 360 active listings in the ZIP; 122 units permitted in Hopkins County in 2024 (0 in 5+ unit buildings).
Forward outlook
- Local home prices are declining (-3.0%/yr); year-one equity from $277 of loan paydown is wiped out by about $1k of value loss. Plan a longer hold.
- Hopkins County population projected at -13% by 2050 — secular population decline; favor cash flow + early exit over multi-decade hold.
- At projected returns (-3.0% appreciation + 3.0% rent growth), your $11k cash investment doubles in ~2 years — after that, you're playing with house money.
Negotiation context
- Only 5 days on market — expect competitive offers; lowballing is unlikely to land.
- 2 sale attempts with the ask held roughly flat each time — persistent listings suggest the price (not the market) is what's stuck; bring a comps-based counter.
- Current owner paid $30k; 33% above their basis — modest negotiation headroom, anchor on the comps not their cost.
Risks & watch-outs
- Watch-outs: built in 1953 — expect roof / HVAC / electrical / plumbing capex.
- Climate carrying-cost: extreme-heat days projected 7→20/yr by 2055 (HVAC capex compounding) — expect insurance premiums to compound above CPI over the hold.
Questions for the listing agent
- Built in 1953 — when were the roof, HVAC, electrical panel, plumbing, and water heater last replaced?
- Is there a deadline driving the sale (1031 exchange, divorce, estate, relocation)? That informs how much negotiation room exists.
- What's the average days-on-market for RENTAL listings here right now (not sales)? A rising rental-DOM trend means longer vacancies and softer asking-rent achievability than the comps imply.
- What's the recent tenant-quality profile in this submarket — average credit score on applications, eviction rate, late-payment / NSF rate, and stable-employment percentage? A property-management company in the area should have these aggregated.
- How much new for-sale + rental construction is in the pipeline within 1–3 miles? Heavy new supply typically softens prices + rents 12–24 months out; constrained supply supports both.
Investment metrics
- 1% rule
- 2.78% ✓
- Cap rate
- 25.12%
- Cash-on-cash
- 67.25%
- DSCR
- 3.99
- GRM
- 3.0
CMA / ARV
- ARV (on-the-fly)
- $122,016
- Comps found
- 12
Show comp detail 12 sales within ~0.75 mi
| Address | Dist | Beds/Ba | Sqft | Sold | Price | $/sf | Match |
|---|---|---|---|---|---|---|---|
| 615 Wyatt Ave | 0.00mi | 2/1.0 | 984 (0%) | 1mo | $37,000 | $38 | 100 |
| 514 Wyatt Ave | 0.21mi | 2/1.0 | 988 (+0%) | 9mo | $139,900 | $142 | 82 |
| 474 Alan Dr | 0.27mi | 3/1.0 (+1) | 960 (-2%) | 20mo | $120,000 | $125 | 62 |
| 410 Brown Ln | 0.31mi | 3/1.0 (+1) | 960 (-2%) | 18mo | $119,000 | $124 | 61 |
| 584 Thompson Ave | 0.55mi | 3/2.0 (+1) | 960 (-2%) | 1mo | $75,000 | $78 | 60 |
| 600 Thompson Ave | 0.51mi | 3/1.0 (+1) | 967 (-2%) | 11mo | $135,000 | $140 | 59 |
| 631 Gordon Ave | 0.57mi | 2/1.0 | 1,055 (+7%) | 12mo | $139,900 | $133 | 51 |
| 440 Thompson | 0.67mi | 2/2.0 | 1,050 (+7%) | 6mo | $120,000 | $114 | 49 |
| 319 Murray St | 0.65mi | 2/1.0 | 900 (-8%) | 11mo | $80,000 | $89 | 46 |
| 686 W Noel Ave | 0.59mi | 3/1.0 (+1) | 1,024 (+4%) | 18mo | $116,000 | $113 | 46 |
| 534 Thompson Ave | 0.59mi | 3/2.0 (+1) | 960 (-2%) | 17mo | $130,000 | $135 | 45 |
| 210 Murray St | 0.74mi | 3/1.0 (+1) | 1,080 (+10%) | 19mo | $10,000 | $9 | 28 |
Match score weights: distance 35% · size 25% · config 20% · recency 20%. Top-matched comps best support the ARV.
Projected returns pro-forma
-3.0% appreciation · 3.0% rent growth · sell at horizon
- IRR
- 66.6%
- Equity multiple
- 3.99×
- Total profit
- $33,493
- Equity at exit
- $5,964
- IRR
- 70.8%
- Equity multiple
- 8.20×
- Total profit
- $80,640
- Equity at exit
- $3,458
Cash invested: $11,200 (down + closing). Projections, not guarantees.
Landlord ↔ Tenant lean methodology
- Overall (STATE)
- 83 Strongly Landlord-Friendly
- State Kentucky
- 83 Strongly Landlord-Friendly · R+16
- County
- — inherits STATE
- City
- — inherits STATE
ZIP-level market 42303
- Home prices YoY
- -29.1%
- Active inventory
- 360
- Price-to-rent
- 3.0×
Monthly cashflow live
- Estimated rent
- $1,111 medium interval (Pro) →
- Mortgage (P&I)
- −$210
- Tax from tax record
- −$24 /mo · $284/yr
- Insurance
- −$17
- HOA
- −$0
- Vacancy / Maint / Mgmt
- −$233
- Net cashflow
- $628
Break-even live
UW: 25.0% down · 7.5% · 30yr · 1.5% tax · 5.0% vac · 8.0% maint · 8.0% mgmt
Financing live
Cash to close
- Down payment
- $10,000
- Closing costs
- $1,200
- Reserves months
- —
- Total cash needed
- —
Loan-product check · same deal, 3 products live
Conventional
25% down · 7.5% · 30yr
- Down + closing
- —
- Monthly P&I
- —
- Monthly cashflow
- —
- DSCR
- —
- Eligible?
- —
Personal DTI + credit; lowest rate.
DSCR
20% down · 8.5% · 30yr
- Down + closing
- —
- Monthly P&I
- —
- Monthly cashflow
- —
- DSCR
- —
- Eligible?
- —
No personal income docs; deal must DSCR.
Hard money
10% down · 12.0% · 12mo
- Down + closing
- —
- Monthly P&I
- —
- Monthly cashflow
- —
- DSCR
- —
- Eligible?
- —
Short-term bridge; refi at stabilization.
Listing history 5 events
-
2026-05-21$40,000 Active
-
2025-10-16status Pending
-
2025-10-14$34,900 Active
-
1994-12-01soldstatus $30,000
-
1968-11-01soldstatus $8,500
ⓘ Source: listings_history table (triggers on properties + properties_extension) + one-shot
backfill from property_details.listing_events for pre-trigger history.
Tax reassessment forecast KY · Resets to sale price
- Current annual tax
- $284 · $24/mo
- Projected year-2 tax
- $344 · $29/mo
- Expected delta
- +$60/yr (+$5/mo · 21.1%)
ⓘ Screening estimate from a state-policy table — verify with the county assessor before closing.
Climate risk First Street
- Flood 1/10 Low FEMA zone X (unshaded) · 0% chance over 30 yrs
- Wildfire 3/10 Moderate
- Heat 5/10 Major 7 d/yr ≥108°F today · 20 d/yr by 30 yrs out
- Wind 3/10 Moderate 6% chance of damaging wind over 30 yrs
- Air quality 2/10 Low 1 unhealthy d/yr today · 1 by 30 yrs out
Nearby sold comps map
Loading sold comps map…
Walkable amenities ~0.75 mi
Loading nearby amenities…
Taxation est. · year 1
- Rental income
- $13,332
- − Mortgage interest
- −$2,241
- − Property taxes
- −$284
- − Insurance
- −$200
- − Repairs & maintenance
- −$1,067
- − Management
- −$1,067
- − Depreciation
- −$1,164
- Taxable income
- $7,311
- Est. tax owed @ 24.0%
- −$1,755
- After-tax cash flow
- $5,777/yr
For passive investors: Depreciation is non-cash, so a rental often shows a tax loss while cash-flowing — sheltering income. Rental losses are passive: they offset passive income freely, and up to $25,000/yr can offset ordinary (W-2) income if you actively participate and your MAGI is under $100k (phasing out to $0 by $150k); unused losses carry forward. On sale, claimed depreciation is recaptured at up to 25%, and gains may owe capital-gains tax (a 1031 exchange can defer both). Figures are a year-1 estimate at your 24.0% rate — not tax advice; consult a CPA.
Schools (NCES district)
- District
- Hopkins County
- NCES district ID
- 2102860
- Math proficiency
- 27% ▼ -23.00%
- Reading proficiency
- 43% ▼ -17.00%
- Median HH income
- $42,436
- Composite
- 29.56/100
- National rank
- #6488
- State rank
- #65 of 165 in KY
Livability — Madisonville
- Score
- 72/100
- State rank
- #132
- US rank
- #6200
Category grades
Schools grade is shown separately in the Schools card above.
Census & demographics
- Census place
- Madisonville, KY
- County
- Daviess County · 87,564 people
- City population
- 27,095
- Metro
- Owensboro, KY
- Population (ZIP)
- 42,119
- Household income
- $64,773
- Rent vs Own
- Severe rent burden
- 983.0
Population outlook (Hopkins County) Hauer SSP2
- Today (2025)
- 45,164 people
- By 2030
- 44,083 · -2.4%
- By 2040
- 41,650 · -7.8%
- By 2050
- 39,303 · -13.0%
- By 2075
- 34,567 · -23.5%
- By 2100
- 29,476 · -34.7%
Race, ethnicity, and origin ACS 2023
- Neighborhood character
- Predominantly White (85%)
- Race & ethnicity
- White 85% Hispanic / Latino 5% Two or more races 5% Black 3% Asian 2%
- Common ancestry
- Italian 2% Slovak 1% Lithuanian 1%
- Foreign-born
- 4% · Canada, Philippines
- Languages at home
- 94% English-only · Spanish 3% Other Indo-European 1% Other Asian/Pacific 1%
Political lean MEDSL · Hopkins
- 2024 margin
- Solid R (+50.9) · D 23.9% · R 74.8% · Other 1.2%
- 2008→2024 swing
- -26.0pp toward R · 2008: -24.9pp · 2024: -50.9pp
- All cycles
- 2024: R+50.9 2020: R+48.0 2016: R+54.0 2012: R+39.9 2008: R+24.9
Not yet ingested
- Civics
- —
Market trends
- HPI YoY
- ▼ -89.55%
- Current HPI
- 217.7128
- Rent YoY
- —
- Metro
- Owensboro, KY
- State GDP YoY
- ▲ 1.81%
- F500 in state
- 4
Industry mix (Fortune 500 HQ in KY)
| Industry | F500 HQs | Revenue |
|---|---|---|
| Healthcare | 1 | $118B |
|
||
| Food / Beverage | 1 | $7B |
|
||
Price history
+370.6% since first listed5 events — show timeline
- 2026-05-21 Listed $40,000 GORAMLS
- 2025-10-16 Pending — GORAMLS
- 2025-10-14 Listed $34,900 GORAMLS
- 1994-12-01 Sold (Public Records) $30,000 Public Records
- 1968-11-01 Sold (Public Records) $8,500 Public Records
Cash-flow waterfall
monthlySold comps — $/sqft
last 12 mo · ≤1 miLoading sold comps…