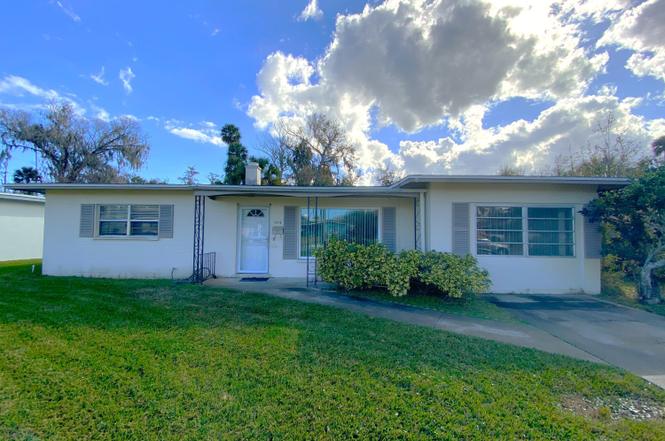
1113 Clearwater Rd · Daytona Beach, FL
Flood risk 5/10 · Moderate
- FEMA flood zone
- X (unshaded)
- Chance of flooding over 30 yrs
- 0.26%
- Est. flood insurance / yr
- $507 – $1,088
Fire risk 3/10 · Minor
- Est. fire insurance / yr
- $947 – $1,759
Heat risk 10/10 · Severe
- Hot days now (above 105°F)
- 7 days/yr
- Hot days in 30 yrs
- 20 days/yr
Wind risk 10/10 · Severe
- Chance of severe wind over 30 yrs
- 99.0%
Air-quality risk 2/10 · Minimal
- Unhealthy air days now
- 2 days/yr
- Unhealthy air days in 30 yrs
- 2 days/yr
Risk factors via First Street. Map © Google.
Why this score? — see what drove the F grade
The composite is a weighted blend of 9 inputs, each scored 0–100. Each bar is that input's sub-score; the figure is the points it added to the 100-point composite (weight × sub-score).
- Cash flow +7.6/30.0
- ARV discount +7.5/15.0
- Livability +4.2/5.0
- Schools +3.9/10.0
- Rent growth +3.4/5.0
- Condition / age +2.5/5.0
- DSCR +1.7/10.0
- 1% rule +1.4/10.0
- Appreciation +0.0/10.0
$215,000
🖨 Deal sheet (PDF) 📄 Offer letter ✓ Due diligence
Listing remarks
Perfect first-time buyer and fixer-upper opportunity in a quiet, established community. This three-bedroom, two-bath home features a large covered back patio and a shuffleboard court in the backyard—ideal for entertaining. Conveniently located near I-95, the marina, beaches, intracoastal, racetrack, Embry-Riddle Aeronautical University, shopping, and dining. Don't miss this great opportunity.
Key facts
- Near intracoastal
- Shuffleboard court
- Near marina
Tags
Property features AI
Finance
- Other: Pets allowed
Exterior
- Parking: Off-street parking
- Utilities: Public water; Public sewer; Electricity connected; Cable available; Water connected; Sewer connected
- Home design: Single family residence; One story
- Construction: Block foundation; Shingle roof
- Exterior features: Front porch; Patio; Back yard fencing; Paved, public-maintained city street access; Lot approximately 0.17 acres (68 ft x 115 ft)
Interior
- Kitchen: Electric range/oven/cooktop; Refrigerator
- Flooring: Terrazzo
- Bathrooms: 2 full bathrooms
- Heating & cooling: Central heating; Central air; Ceiling fan(s)
- Interior features: Ceiling fans; Eat-in kitchen; 6 total rooms
- Laundry & utility: Stacked washer/dryer; Washer; Dryer; Electric water heater
Neighborhood map
What this means for you Summary
Snapshot
- This is a 2-bed/1.5-bath single-family listed at $215k.
Deal economics
- At list price, monthly cash flow is $-260 ($-3k/yr) — negative.
- To cash-flow at today's rent, offer at most $169k (21.4% below list).
- To meet the 1% rule (rent ≥ 1% of price), the offer needs to be $138k (36.0% below list).
- Recommended offer: $138k (36.0% below list) — sets the bar for 1% rule.
Location & tenants
- Location reads 83/100 on livability (#46 in FL, #867 nationally) — a professional / high-income tenant draw. Strengths: amenities A+, commute A+, cost of living A+; Watch: employment D-.
- Volusia (suburban): math 44% / reading 49% proficiency, ranked #47 of 73 in FL (top 64%) — families likely to look elsewhere, expect single-tenant / working-renter base with shorter leases.
- Zoned schools: Turie T. Small Elementary School (math 35% / reading 29%, grade F, #1,797 of 2,144 statewide, top 86%, 383 students, 91% FRL); Campbell Middle School (math 28% / reading 30%, grade F, #479 of 571 statewide, top 84%, 855 students, 80% FRL); Mainland High School (math 30% / reading 37%, grade F, #400 of 667 statewide, top 61%, 1,855 students, 64% FRL) — zoned schools average 78% FRL vs 51% district-wide (28 pts higher); higher-poverty schools than district average — tighter screening recommended.
- Zoned-school proficiency averages 32% at this address vs 46% district-wide (-15 pts) — the specific schools serving this property underperform the Volusia average; the district grade overstates school quality for this exact location.
- Market conditions: Rents rising (+3.6%/yr); 317 active listings in the ZIP; 26 comparable units currently listed for rent nearby; rentals at typical pace (median 25d on market — plan ~3-4 weeks tenant-placement turnaround); lower-income renter base — watch delinquency; 3,402 units permitted in Volusia County in 2024 (681 in 5+ unit buildings).
- This rent runs 40% of the median local income ($42k/yr) — at the standard rent-burdened threshold; future hikes will face affordability resistance.
Forward outlook
- Local home prices are declining (-3.0%/yr); year-one equity from $1k of loan paydown is wiped out by about $6k of value loss. Plan a longer hold.
- Volusia County population projected at +19% by 2050 — long-run rental-demand tailwind backs the buy-and-hold thesis.
Negotiation context
- It's been on market 130 days — a 12% lower offer ($189k) is reasonable based on typical stale-listing flexibility.
Risks & watch-outs
- Climate carrying-cost: moderate flood risk; severe wind risk, 99% chance of damaging wind over 30y; extreme-heat days projected 7→20/yr by 2055 (HVAC capex compounding) — expect insurance premiums to compound above CPI over the hold.
Questions for the listing agent
- What do current leases actually rent for vs. the listed asking? Can we see a recent rent roll and the last 12 months of T-12 income?
- It's been on market 130 days. Have you received any prior offers? Is the seller open to a 36% concession, seller financing, or rate buy-down credit?
- Built in 1962 — when were the roof, HVAC, electrical panel, plumbing, and water heater last replaced?
- Why hasn't it sold? Are there any deal-killer items the seller is aware of (foundation, flood, title, zoning, code violations)?
- Is there a deadline driving the sale (1031 exchange, divorce, estate, relocation)? That informs how much negotiation room exists.
- Schools are D-rated, which usually means shorter tenancies and higher turnover. Who's the typical renter profile here, and what's been the actual vacancy rate?
- The area grade is low — what's the realistic commute time and amenity access for the typical tenant pool here? Any planned neighborhood developments (good or bad) we should know about?
- What's the average days-on-market for RENTAL listings here right now (not sales)? A rising rental-DOM trend means longer vacancies and softer asking-rent achievability than the comps imply.
- What's the recent tenant-quality profile in this submarket — average credit score on applications, eviction rate, late-payment / NSF rate, and stable-employment percentage? A property-management company in the area should have these aggregated.
- How much new for-sale + rental construction is in the pipeline within 1–3 miles? Heavy new supply typically softens prices + rents 12–24 months out; constrained supply supports both.
Investment metrics
- 1% rule
- 0.64% ✗
- Cap rate
- 4.84%
- Cash-on-cash
- -5.19%
- DSCR
- 0.77
- GRM
- 13.0
CMA / ARV
No comps found within radius.
Projected returns pro-forma
-3.0% appreciation · 3.57% rent growth · sell at horizon
- IRR
- -24.6%
- Equity multiple
- 0.16×
- Total profit
- $-50,691
- Equity at exit
- $32,057
- IRR
- -19.0%
- Equity multiple
- -0.04×
- Total profit
- $-62,456
- Equity at exit
- $18,589
Cash invested: $60,200 (down + closing). Projections, not guarantees.
Landlord ↔ Tenant lean methodology
- Overall (STATE)
- 87 Strongly Landlord-Friendly
- State Florida
- 87 Strongly Landlord-Friendly · R+3
- County
- — inherits STATE
- City
- — inherits STATE
ZIP-level market 32114
- Home prices YoY
- -21.8%
- Rents YoY
- 3.6%
- Active inventory
- 317
- Price-to-rent
- 13.0×
Monthly cashflow live
- Estimated rent
- $1,377 high interval (Pro) →
- Mortgage (P&I)
- −$1,127
- Tax from tax record
- −$131 /mo · $1,570/yr
- Insurance
- −$90
- HOA
- −$0
- Vacancy / Maint / Mgmt
- −$289
- Net cashflow
- $-260
Break-even live
Sensitivity live
| Price | -10% $-139 | -5% $-199 | +0% $-260 | +5% $-321 | +10% $-382 |
|---|---|---|---|---|---|
| Rent | -10% $-369 | -5% $-315 | +0% $-260 | +5% $-206 | +10% $-152 |
| Rate | -1.0pp $-152 | -0.5pp $-206 | base $-260 | +0.5pp $-316 | +1.0pp $-373 |
UW: 25.0% down · 7.5% · 30yr · 1.5% tax · 5.0% vac · 8.0% maint · 8.0% mgmt
Financing live
Cash to close
- Down payment
- $53,750
- Closing costs
- $6,450
- Reserves months
- —
- Total cash needed
- —
Loan-product check · same deal, 3 products live
Conventional
25% down · 7.5% · 30yr
- Down + closing
- —
- Monthly P&I
- —
- Monthly cashflow
- —
- DSCR
- —
- Eligible?
- —
Personal DTI + credit; lowest rate.
DSCR
20% down · 8.5% · 30yr
- Down + closing
- —
- Monthly P&I
- —
- Monthly cashflow
- —
- DSCR
- —
- Eligible?
- —
No personal income docs; deal must DSCR.
Hard money
10% down · 12.0% · 12mo
- Down + closing
- —
- Monthly P&I
- —
- Monthly cashflow
- —
- DSCR
- —
- Eligible?
- —
Short-term bridge; refi at stabilization.
Rent comps 26 comps
| Address | Beds | Baths | Sqft | Rent | $/sqft | DOM | Units | Dist |
|---|---|---|---|---|---|---|---|---|
| 1220 S Nova Rd Daytona Beach, FL | 1.0 | 1.0 | 576 | $955 | $1.66 | 13d | 11 | 0.23mi |
| 886 S Nova Rd Daytona Beach, FL | 1.0–2.0 | 1.0 | 685 | $1,260 | $1.84 | 13d | 10 | 0.47mi |
| 1401 S Clyde Morris Blvd Daytona Beach, FL | 1.0 | 1.0 | 576 | $1,272 | $2.21 | 25d | 5 | 0.57mi |
| 1017 June Ter Lot 6 Daytona Beach, FL | 2.0 | 1.0 | 700 | $1,350 | $1.93 | 25d | 1 | 0.60mi |
| 1420 New Bellevue Ave Daytona Beach, FL | 1.0–2.0 | 1.0–2.0 | 800 | $1,554 | $1.94 | 13d | 9 | 0.72mi |
| 1400 Hancock Blvd Daytona Beach, FL | 1.0–2.0 | 1.0–2.0 | 800 | $1,483 | $1.85 | 13d | 11 | 0.74mi |
| 17 Kimberly Ct Daytona Beach, FL | 2.0 | 2.0 | 896 | $1,299 | $1.45 | 25d | 1 | 0.84mi |
| 908 Lora St Unit A Daytona Beach, FL | 2.0 | 1.0 | 775 | $1,300 | $1.68 | 25d | 1 | 0.88mi |
| 940 Lockhart St Daytona Beach, FL | 3.0 | 2.0 | 1071 | $1,850 | $1.73 | 21d | 1 | 0.88mi |
| 751 Bellevue Ave Unit 1 Daytona Beach, FL | 2.0 | 1.0 | 816 | $1,390 | $1.70 | 25d | 1 | 0.97mi |
| 700 Northern Rd Unit 728 South Daytona, FL | 1.0 | 1.0 | 774 | $1,240 | $1.60 | 25d | 1 | 1.01mi |
| 900 Boulder Dr South Daytona, FL | 2.0 | 1.0 | 939 | $1,850 | $1.97 | 25d | 1 | 1.02mi |
| 132 Forest Lake Blvd Daytona Beach, FL | 1.0–2.0 | 1.0–2.0 | 706 | $1,421 | $2.01 | 16d | 13 | 1.11mi |
| 1757 S Clyde Morris Blvd Daytona Beach, FL | 2.0 | 1.0 | 850 | $1,392 | $1.64 | 16d | 3 | 1.13mi |
| 1756 S Clyde Morris Blvd Daytona Beach, FL | 1.0–2.0 | 1.0–2.0 | 850 | $1,650 | $1.94 | 25d | 8 | 1.18mi |
| 1739 Eastern Rd South Daytona, FL | 1.0 | 1.0 | 800 | $1,099 | $1.37 | 16d | 1 | 1.34mi |
| 1822 S Clyde Morris Blvd Unit 1822-1 Daytona Beach, FL | 2.0 | 2.0 | 850 | $1,325 | $1.56 | 16d | 1 | 1.36mi |
| 1350 Virginia Ave Apt 17 Daytona Beach, FL | 2.0 | 2.0 | 950 | $1,399 | $1.47 | 25d | 1 | 1.38mi |
| 1500 Virginia Ave Daytona Beach, FL | 2.0 | 2.0 | 910 | $1,475 | $1.62 | 25d | 1 | 1.39mi |
| 311 Country Club Oval Unit 311-112 Daytona Beach, FL | 2.0 | 1.0 | 940 | $1,375 | $1.46 | 16d | 1 | 1.40mi |
| 311 Country Club Oval Unit 311-203 Daytona Beach, FL | 1.0 | 1.0 | 578 | $1,250 | $2.16 | 25d | 1 | 1.40mi |
| 311 Country Club Oval Unit 311-208 Daytona Beach, FL | 1.0 | 1.0 | 578 | $1,095 | $1.89 | 25d | 1 | 1.40mi |
| 313 Country Club Oval Unit 313-4 Daytona Beach, FL | 1.0 | 1.0 | 650 | $1,250 | $1.92 | 25d | 1 | 1.40mi |
| 315 Wilder Blvd Daytona Beach, FL | 2.0 | 1.0 | 850 | $1,075 | $1.26 | 25d | 1 | 1.41mi |
| 1504 Virginia Ave Daytona Beach, FL | 1.0–2.0 | 1.0–2.0 | 842 | $1,650 | $1.96 | 25d | 3 | 1.41mi |
| 535 Olive St South Daytona, FL | 2.0 | 1.0 | 1024 | $1,725 | $1.68 | 13d | 1 | 1.50mi |
Listing history 5 events
-
2026-05-19status Pending
-
2026-04-28historical Active Under Contract
-
2026-04-26price $215,000
-
2026-02-03price $225,000
-
2026-01-10$250,000 Active
ⓘ Source: listings_history table (triggers on properties + properties_extension) + one-shot
backfill from property_details.listing_events for pre-trigger history.
Tax reassessment forecast FL · Resets to sale price
- Current annual tax
- $1,570 · $131/mo
- Projected year-2 tax
- $1,784 · $149/mo
- Expected delta
- +$215/yr (+$18/mo · 13.7%)
ⓘ Screening estimate from a state-policy table — verify with the county assessor before closing.
Climate risk First Street
- Flood 5/10 Major FEMA zone X (unshaded) · 26% chance over 30 yrs
- Wildfire 3/10 Moderate
- Heat 10/10 Extreme 7 d/yr ≥105°F today · 20 d/yr by 30 yrs out
- Wind 10/10 Extreme 99% chance of damaging wind over 30 yrs
- Air quality 2/10 Low 2 unhealthy d/yr today · 2 by 30 yrs out
Nearby sold comps map
Loading sold comps map…
Walkable amenities ~0.75 mi
Loading nearby amenities…
Taxation est. · year 1
- Rental income
- $16,519
- − Mortgage interest
- −$12,043
- − Property taxes
- −$1,570
- − Insurance
- −$1,075
- − Repairs & maintenance
- −$1,322
- − Management
- −$1,322
- − Depreciation
- −$6,255
- Taxable loss
- −$7,066
- Est. tax savings @ 24.0%
- +$1,696
- After-tax cash flow
- $-1,428/yr
For passive investors: Depreciation is non-cash, so a rental often shows a tax loss while cash-flowing — sheltering income. Rental losses are passive: they offset passive income freely, and up to $25,000/yr can offset ordinary (W-2) income if you actively participate and your MAGI is under $100k (phasing out to $0 by $150k); unused losses carry forward. On sale, claimed depreciation is recaptured at up to 25%, and gains may owe capital-gains tax (a 1031 exchange can defer both). Figures are a year-1 estimate at your 24.0% rate — not tax advice; consult a CPA.
Schools (NCES district)
- District
- Volusia
- NCES district ID
- 1201920
- Math proficiency
- 44% ▼ -9.00%
- Reading proficiency
- 49% ▼ -3.00%
- Median HH income
- $42,946
- Composite
- 39.2/100
- National rank
- #4019
- State rank
- #47 of 73 in FL
Livability — Daytona Beach
- Score
- 83/100
- State rank
- #46
- US rank
- #867
Category grades
Schools grade is shown separately in the Schools card above.
Census & demographics
- Census place
- Daytona Beach, FL
- County
- Volusia County · 556,871 people
- City population
- 67,539
- Metro
- Deltona-Daytona Beach-Ormond Beach, FL
- Population (ZIP)
- 37,747
- Household income
- $41,736
- Rent vs Own
- Severe rent burden
- 2772.0
Population outlook (Volusia County) Hauer SSP2
- Today (2025)
- 572,749 people
- By 2030
- 598,695 · +4.5%
- By 2040
- 644,880 · +12.6%
- By 2050
- 681,451 · +19.0%
- By 2075
- 759,957 · +32.7%
- By 2100
- 778,902 · +36.0%
Race, ethnicity, and origin ACS 2023
- Neighborhood character
- Diverse neighborhood (Simpson 0.65)
- Race & ethnicity
- Black 45% White 36% Hispanic / Latino 11% Two or more races 7% Asian 2%
- Hispanic origin (detail)
- Mexican 2% Puerto Rican 4%
- Common ancestry
- Romanian 1% Slovak 1% Lithuanian 1%
- Foreign-born
- 7% · Canada, South Korea
- Languages at home
- 90% English-only · Spanish 7% Arabic 1%
Political lean MEDSL · Volusia
- 2024 margin
- Strong R (+21.8) · D 38.7% · R 60.5%
- 2008→2024 swing
- -27.4pp toward R · 2008: 5.7pp · 2024: -21.8pp
- All cycles
- 2024: R+21.8 2020: R+14.1 2016: R+13.1 2012: R+1.2 2008: D+5.7
Not yet ingested
- Civics
- —
Market trends
- HPI YoY
- ▼ -75.93%
- Current HPI
- 272.5149
- Rent YoY
- ▲ 3.57%
- Metro
- Deltona-Daytona Beach-Ormond Beach, FL
- State GDP YoY
- ▲ 3.28%
- F500 in state
- 36
Industry mix (Fortune 500 HQ in FL)
| Industry | F500 HQs | Revenue |
|---|---|---|
| Industrial Technology | 2 | $29B |
|
||
| Insurance | 2 | $17B |
|
||
| Retail | 1 | $60B |
|
||
| Technology Distribution | 1 | $58B |
|
||
| Homebuilding | 1 | $35B |
|
||
| Technology Manufacturing | 1 | $35B |
|
||
Price history
-14.0% since first listed5 events — show timeline
- 2026-05-19 Pending — Daytona MLS
- 2026-04-28 Contingent — Daytona MLS
- 2026-04-26 Price Changed $215,000 Daytona MLS
- 2026-02-03 Price Changed $225,000 Daytona MLS
- 2026-01-10 Listed $250,000 Daytona MLS
Property tax history
+2.6%/yrLatest (2025): $1,570 · +3.3% YoY. Source: county tax records.
Cash-flow waterfall
monthlySold comps — $/sqft
last 12 mo · ≤1 miLoading sold comps…