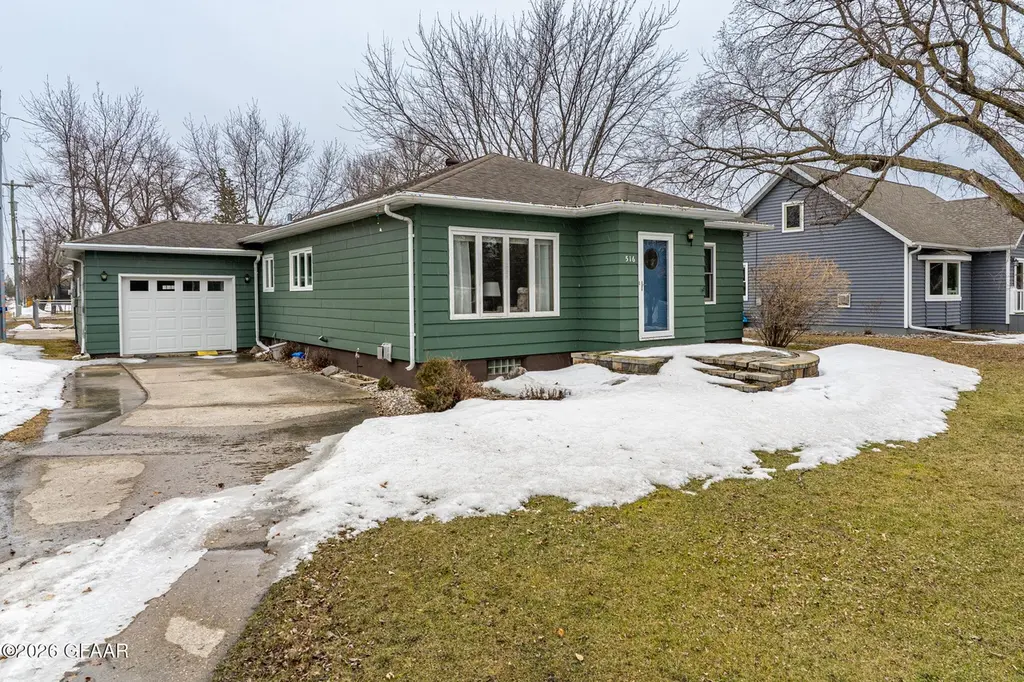
516 3rd St S · Hallock, MN
Flood risk 1/10 · Minimal
- FEMA flood zone
- X (unshaded)
- Chance of flooding over 30 yrs
- 0.0%
- Est. flood insurance / yr
- $473 – $860
Fire risk 6/10 · Moderate
- Est. fire insurance / yr
- $888 – $1,650
Heat risk 2/10 · Minimal
- Hot days now (above 95°F)
- 7 days/yr
- Hot days in 30 yrs
- 13 days/yr
Wind risk 1/10 · Minimal
- Chance of severe wind over 30 yrs
- —
Air-quality risk 4/10 · Minor
- Unhealthy air days now
- 4 days/yr
- Unhealthy air days in 30 yrs
- 4 days/yr
Risk factors via First Street. Map © Google.
Why this score? — see what drove the D grade
The composite is a weighted blend of 9 inputs, each scored 0–100. Each bar is that input's sub-score; the figure is the points it added to the 100-point composite (weight × sub-score).
- Cash flow +7.8/30.0
- Appreciation +7.6/10.0
- ARV discount +7.5/15.0
- Schools +5.9/10.0
- Livability +3.9/5.0
- Rent growth +2.5/5.0
- Condition / age +2.5/5.0
- DSCR +1.9/10.0
- 1% rule +1.7/10.0
$134,900
🖨 Deal sheet 📄 Offer letter ✓ Due diligence
Listing remarks
Welcome to this spacious and well-maintained home in Hallock! Offering over 2,300 sq ft, this 2 bedroom (plus non-egress basement bedroom) and 2 bath home has room to spread out and enjoy. You'll love the large kitchen and dining areas--perfect for everyday living or entertaining. The finished basement features a cozy gas stove, creating a great second living space. Updated bathrooms add a modern touch, while the fenced yard and single-stall garage provide convenience and functionality. Located close to the local hospital and schools, this home offers both comfort and convenience. All of this at an affordable price -- don't miss your chance to take a look!
Key facts
- Close to schools
- Fenced yard
- Large kitchen
Tags
Property features AI
Exterior
- Parking: Attached garage (1 car)
- Utilities: Public water; Natural gas available
- Home design: Single family residence; One level
- Construction: Wood siding; Above-grade finished area 1,304; Total area 2,384
- Exterior features: Deck
Interior
- Bathrooms: One full bathroom; One three-quarter bathroom
- Heating & cooling: Has cooling
- Interior features: Gas fireplace (1); Full basement
Neighborhood map
What this means for you Summary
Snapshot
- This is a 2-bed/2.0-bath single-family listed at $135k.
Deal economics
- At list price, monthly cash flow is $-150 ($-2k/yr) — negative.
- To cash-flow at today's rent, offer at most $108k (19.6% below list).
- To meet the 1% rule (rent ≥ 1% of price), the offer needs to be $90k (33.4% below list).
- Recommended offer: $90k (33.4% below list) — sets the bar for 1% rule.
Location & tenants
- Location reads 78/100 on livability (#104 in MN, #2,386 nationally) — a middle-class / working-renter tenant base. Strengths: crime A+, cost of living A+, housing A+; Watch: amenities F, commute F.
- Kittson Central School District (rural): math 65% / reading 70% proficiency, ranked #60 of 467 in MN (top 13%) — acceptable for families but not a draw, mixed tenant base, ~2y average lease; only 17% free/reduced lunch — higher-income household profile.
- Market conditions: 7 active listings in the ZIP; 4 units permitted in Kittson County in 2024 (0 in 5+ unit buildings).
Forward outlook
- In year one you build about $8k of equity ($933 loan paydown + $7k appreciation (5.2% local appreciation)).
- Kittson County population projected to shrink 8% by 2050 — rents likely to lag national; underwrite the cash flow, not the appreciation.
- By year 5, paydown + projected appreciation supports a ~$35k cash-out refi (75% LTV) — recoverable capital for the next deal without selling this one.
Negotiation context
- It's been on market 21 days — a 2% lower offer ($133k) is reasonable based on typical stale-listing flexibility.
Risks & watch-outs
- Watch-outs: built in 1950 — expect roof / HVAC / electrical / plumbing capex.
- Climate carrying-cost: major wildfire risk — expect insurance premiums to compound above CPI over the hold.
Questions for the listing agent
- What do current leases actually rent for vs. the listed asking? Can we see a recent rent roll and the last 12 months of T-12 income?
- Built in 1950 — when were the roof, HVAC, electrical panel, plumbing, and water heater last replaced?
- Is there a deadline driving the sale (1031 exchange, divorce, estate, relocation)? That informs how much negotiation room exists.
- Schools are A-rated — typically a magnet for longer-tenancy family renters. What's the average tenant stay here, and is there a school-zone premium baked into asking?
- The area grade is low — what's the realistic commute time and amenity access for the typical tenant pool here? Any planned neighborhood developments (good or bad) we should know about?
- What's the average days-on-market for RENTAL listings here right now (not sales)? A rising rental-DOM trend means longer vacancies and softer asking-rent achievability than the comps imply.
- What's the recent tenant-quality profile in this submarket — average credit score on applications, eviction rate, late-payment / NSF rate, and stable-employment percentage? A property-management company in the area should have these aggregated.
- How much new for-sale + rental construction is in the pipeline within 1–3 miles? Heavy new supply typically softens prices + rents 12–24 months out; constrained supply supports both.
Investment metrics
- 1% rule
- 0.67% ✗
- Cap rate
- 4.96%
- Cash-on-cash
- -4.75%
- DSCR
- 0.79
- GRM
- 12.5
CMA / ARV
No comps found within radius.
Projected returns pro-forma
5.22% appreciation · 3.0% rent growth · sell at horizon
- IRR
- 9.5%
- Equity multiple
- 1.61×
- Total profit
- $23,209
- Equity at exit
- $78,230
- IRR
- 11.0%
- Equity multiple
- 3.05×
- Total profit
- $77,600
- Equity at exit
- $136,513
Cash invested: $37,772 (down + closing). Projections, not guarantees.
Landlord ↔ Tenant lean methodology
- Overall (STATE)
- 46 Balanced
- State Minnesota
- 46 Balanced · D+2
- County
- — inherits STATE
- City
- — inherits STATE
ZIP-level market 56728
- Home prices YoY
- 4.2%
- Active inventory
- 7
- Price-to-rent
- 12.5×
Monthly cashflow live
- Estimated rent
- $898 medium interval (Pro) →
- Mortgage (P&I)
- −$707
- Tax from tax record
- −$96 /mo · $1,148/yr
- Insurance
- −$56
- HOA
- −$0
- Vacancy / Maint / Mgmt
- −$189
- Net cashflow
- $-150
Break-even live
UW: 25.0% down · 7.5% · 30yr · 1.5% tax · 5.0% vac · 8.0% maint · 8.0% mgmt
Financing live
Cash to close
- Down payment
- $33,725
- Closing costs
- $4,047
- Reserves months
- —
- Total cash needed
- —
Loan-product check · same deal, 3 products live
Conventional
25% down · 7.5% · 30yr
- Down + closing
- —
- Monthly P&I
- —
- Monthly cashflow
- —
- DSCR
- —
- Eligible?
- —
Personal DTI + credit; lowest rate.
DSCR
20% down · 8.5% · 30yr
- Down + closing
- —
- Monthly P&I
- —
- Monthly cashflow
- —
- DSCR
- —
- Eligible?
- —
No personal income docs; deal must DSCR.
Hard money
10% down · 12.0% · 12mo
- Down + closing
- —
- Monthly P&I
- —
- Monthly cashflow
- —
- DSCR
- —
- Eligible?
- —
Short-term bridge; refi at stabilization.
Listing history 3 events
-
2026-05-06status Pending
-
2026-04-29historical Active Under Contract
-
2026-04-15$134,900 Active
ⓘ Source: listings_history table (triggers on properties + properties_extension) + one-shot
backfill from property_details.listing_events for pre-trigger history.
Tax reassessment forecast MN · Partial reset (capped growth)
- Current annual tax
- $1,148 · $96/mo
- Projected year-2 tax
- $1,329 · $111/mo
- Expected delta
- +$181/yr (+$15/mo · 15.8%)
ⓘ Screening estimate from a state-policy table — verify with the county assessor before closing.
Climate risk First Street
- Flood 1/10 Low FEMA zone X (unshaded) · 0% chance over 30 yrs
- Wildfire 6/10 Major
- Heat 2/10 Low 7 d/yr ≥95°F today · 13 d/yr by 30 yrs out
- Wind 1/10 Low
- Air quality 4/10 Moderate 4 unhealthy d/yr today · 4 by 30 yrs out
Nearby sold comps map
Loading sold comps map…
Walkable amenities ~0.75 mi
Loading nearby amenities…
Taxation est. · year 1
- Rental income
- $10,780
- − Mortgage interest
- −$7,556
- − Property taxes
- −$1,148
- − Insurance
- −$674
- − Repairs & maintenance
- −$862
- − Management
- −$862
- − Depreciation
- −$3,924
- Taxable loss
- −$4,248
- Est. tax savings @ 24.0%
- +$1,020
- After-tax cash flow
- $-776/yr
For passive investors: Depreciation is non-cash, so a rental often shows a tax loss while cash-flowing — sheltering income. Rental losses are passive: they offset passive income freely, and up to $25,000/yr can offset ordinary (W-2) income if you actively participate and your MAGI is under $100k (phasing out to $0 by $150k); unused losses carry forward. On sale, claimed depreciation is recaptured at up to 25%, and gains may owe capital-gains tax (a 1031 exchange can defer both). Figures are a year-1 estimate at your 24.0% rate — not tax advice; consult a CPA.
Schools (NCES district)
- District
- Kittson Central School District
- NCES district ID
- 2791447
- Math proficiency
- 65% ▼ -5.00%
- Reading proficiency
- 70% ▬ 0.00%
- Median HH income
- $56,425
- Composite
- 59.2/100
- National rank
- #1936
- State rank
- #60 of 467 in MN
Livability — Hallock
- Score
- 78/100
- State rank
- #104
- US rank
- #2386
Category grades
Schools grade is shown separately in the Schools card above.
Census & demographics
- Census place
- Hallock, MN
- Population (ZIP)
- 1,149
Population outlook (Kittson County) Hauer SSP2
- Today (2025)
- 4,195 people
- By 2030
- 4,100 · -2.3%
- By 2040
- 3,952 · -5.8%
- By 2050
- 3,869 · -7.8%
- By 2075
- 3,832 · -8.7%
- By 2100
- 3,529 · -15.9%
Race, ethnicity, and origin ACS 2023
- Neighborhood character
- Predominantly White (92%)
- Race & ethnicity
- White 92% Two or more races 5% Hispanic / Latino 2%
- Common ancestry
- Portuguese 21% Romanian 9% Scottish 5%
- Foreign-born
- 5% · Canada
- Languages at home
- 92% English-only · Spanish 4% German/W. Germanic 2% Russian/Polish/Slavic 1%
Political lean MEDSL · Kittson
- 2024 margin
- Strong R (+25.0) · D 36.5% · R 61.5% · Other 2.0%
- 2008→2024 swing
- -43.5pp toward R · 2008: 18.5pp · 2024: -25.0pp
- All cycles
- 2024: R+25.0 2020: R+20.5 2016: R+22.3 2012: D+6.1 2008: D+18.5
Not yet ingested
- Civics
- —
Market trends
- HPI YoY
- ▲ 5.22%
- Current HPI
- 128.2236
- Rent YoY
- —
- Metro
- —
- State GDP YoY
- ▲ 2.41%
- F500 in state
- 34
Industry mix (Fortune 500 HQ in MN)
| Industry | F500 HQs | Revenue |
|---|---|---|
| Healthcare | 2 | $407B |
|
||
| Retail | 2 | $150B |
|
||
| Consumer Goods | 2 | $32B |
|
||
| Industrial Machinery | 2 | $6B |
|
||
| Agriculture | 1 | $40B |
|
||
| Healthcare / Medical Devices | 1 | $32B |
|
||
Price history
3 events — show timeline
- 2026-05-06 Pending — GFAAR
- 2026-04-29 Contingent — GFAAR
- 2026-04-15 Listed $134,900 GFAAR
Property tax history
+0.6%/yrLatest (2025): $1,148 · +5.7% YoY. Source: county tax records.
Cash-flow waterfall
monthlySold comps — $/sqft
last 12 mo · ≤1 miLoading sold comps…