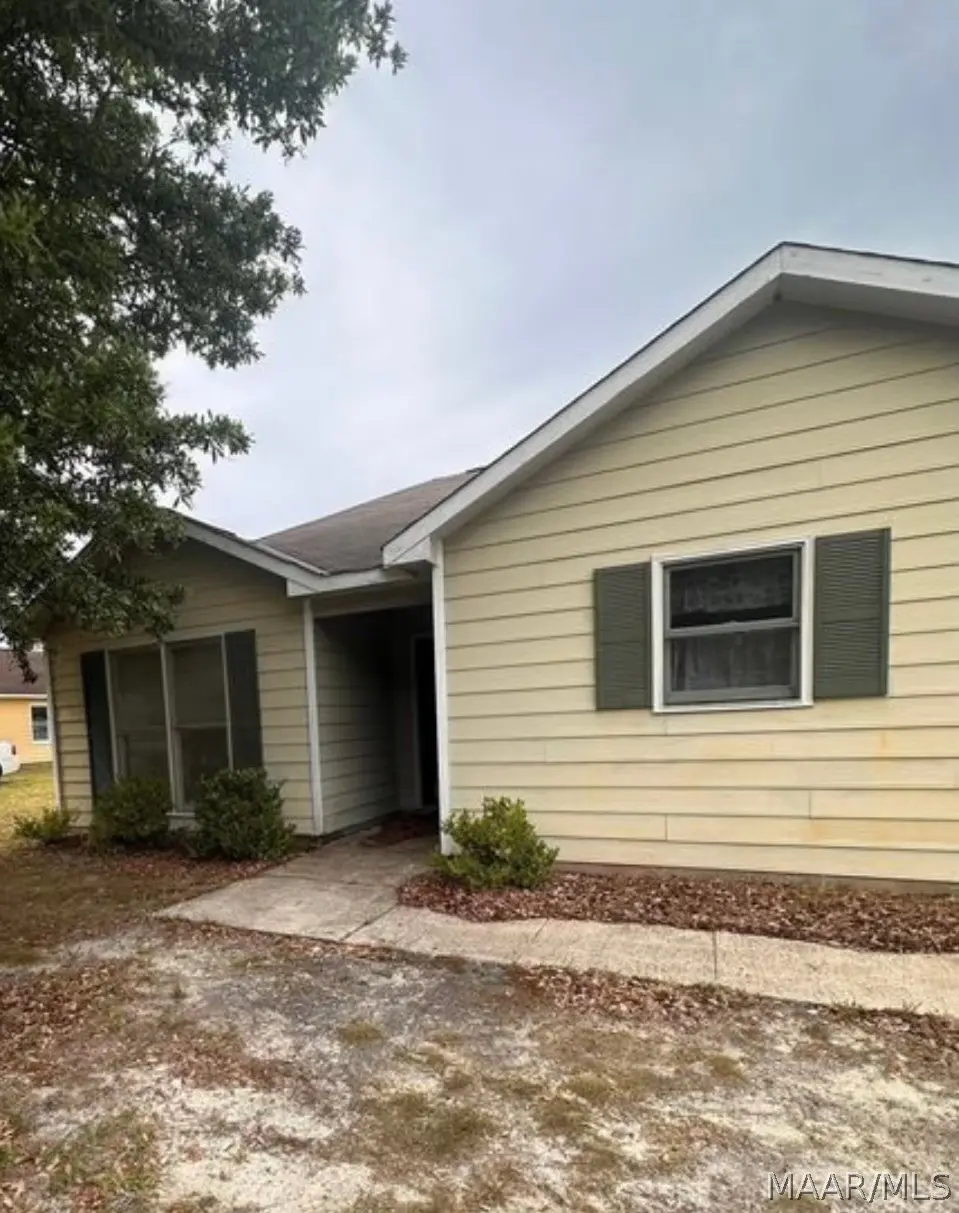
103 Mill Pond St · Phenix City, AL
Flood risk 1/10 · Minimal
- FEMA flood zone
- X (unshaded)
- Chance of flooding over 30 yrs
- 0.0%
- Est. flood insurance / yr
- $507 – $1,088
Fire risk 4/10 · Minor
- Est. fire insurance / yr
- $916 – $1,700
Heat risk 7/10 · Major
- Hot days now (above 107°F)
- 7 days/yr
- Hot days in 30 yrs
- 19 days/yr
Wind risk 6/10 · Moderate
- Chance of severe wind over 30 yrs
- 76.0%
Air-quality risk 4/10 · Minor
- Unhealthy air days now
- 4 days/yr
- Unhealthy air days in 30 yrs
- 4 days/yr
Risk factors via First Street. Map © Google.
Why this score? — see what drove the B grade
The composite is a weighted blend of 9 inputs, each scored 0–100. Each bar is that input's sub-score; the figure is the points it added to the 100-point composite (weight × sub-score).
- Cash flow +29.0/30.0
- ARV discount +14.5/15.0
- DSCR +10.0/10.0
- 1% rule +7.0/10.0
- Livability +3.0/5.0
- Schools +2.7/10.0
- Rent growth +2.5/5.0
- Condition / age +2.5/5.0
- Appreciation +0.0/10.0
$155,500
🖨 Deal sheet 📄 Offer letter ✓ Due diligence
Listing remarks
The home features a functional open-concept layout with spacious bedrooms and a private primary suite. Unlike many properties at this price point, it requires little to no work—simply bring your furniture and start living. Situated in the heart of Bullock County, you’ll enjoy a peaceful neighborhood setting while being minutes away from local amenities and the historic downtown district. Priced well below market value for a quick sale, this is an ideal find for a first-time homebuyer or anyone looking to downsize without the headache of renovations.
Key facts
- 6,773 sq ft lot
- Parking
- Built 2002
Property features AI
Exterior
- Parking: Driveway
- Utilities: Public water; Public sewer; Cable available
- Home design: Single-story; Vinyl siding
- Construction: Built (year per public records); Vinyl siding construction; Slab foundation
- Exterior features: Storage; City lot
Interior
- Bedrooms: Bedroom on the third level
- Flooring: Carpet; Vinyl
- Bathrooms: 2 full bathrooms
- Heating & cooling: Central heating (electric); Central air conditioning (electric)
- Interior features: Carpet and vinyl flooring; Storage space
- Laundry & utility: Electric water heater
Neighborhood map
What this means for you Summary
Snapshot
- This is a 3-bed/2.0-bath single-family listed at $156k.
Deal economics
- At list price, monthly cash flow is $530 ($6k/yr) — positive.
- The deal already cash-flows at list — no discount required.
- Meets the 1% rule at list price ($2k rent vs $156k).
- Recommended offer: $151k (3.0% below list) — sets the bar for market timing.
- Cap rate 10.4% vs local median 5.0% in Phenix City — top-decile yield for the area; either an underpriced asset or a hidden risk that comps aren't pricing in. Stress-test before assuming the spread holds.
Location & tenants
- Location reads 60/100 on livability (#297 in AL) — a middle-class / working-renter tenant base. Strengths: cost of living A+, housing A+; Watch: schools D+, crime F, amenities F.
- Phenix City (suburban): math 22% / reading 44% proficiency, ranked #59 of 129 in AL (top 46%) — families likely to look elsewhere, expect single-tenant / working-renter base with shorter leases; 64% free/reduced lunch — lower-income household profile, screen leases tightly.
- Market conditions: 132 active listings in the ZIP; 2 comparable units currently listed for rent nearby; 1,858 units permitted in Lee County in 2024 (113 in 5+ unit buildings).
- This rent runs 31% of the median local income ($72k/yr) — at the standard rent-burdened threshold; future hikes will face affordability resistance.
Forward outlook
- Local home prices are declining (-3.0%/yr); year-one equity from $1k of loan paydown is wiped out by about $5k of value loss. Plan a longer hold.
- Lee County population projected at +54% by 2050 — long-run rental-demand tailwind backs the buy-and-hold thesis.
- At projected returns (-3.0% appreciation + 3.0% rent growth), your $44k cash investment doubles in ~9 years — after that, you're playing with house money.
Negotiation context
- It's been on market 59 days — a 3% lower offer ($151k) is reasonable based on typical stale-listing flexibility.
- 3 sale attempts; this cycle's ask is 83% above the opening price — seller raised mid-cycle; expect resistance to lowballs.
Risks & watch-outs
- Climate carrying-cost: major wind risk, 76% chance of damaging wind over 30y; extreme-heat days projected 7→19/yr by 2055 (HVAC capex compounding) — expect insurance premiums to compound above CPI over the hold.
Questions for the listing agent
- It's been on market 59 days. Have you received any prior offers? Is the seller open to a 3% concession, seller financing, or rate buy-down credit?
- Is there a deadline driving the sale (1031 exchange, divorce, estate, relocation)? That informs how much negotiation room exists.
- Schools are D-rated, which usually means shorter tenancies and higher turnover. Who's the typical renter profile here, and what's been the actual vacancy rate?
- Crime grade is F in this area — have there been break-ins, vandalism, or insurance claims at this property in the last 3 years? What carrier currently insures it and at what premium?
- What's the average days-on-market for RENTAL listings here right now (not sales)? A rising rental-DOM trend means longer vacancies and softer asking-rent achievability than the comps imply.
- What's the recent tenant-quality profile in this submarket — average credit score on applications, eviction rate, late-payment / NSF rate, and stable-employment percentage? A property-management company in the area should have these aggregated.
- How much new for-sale + rental construction is in the pipeline within 1–3 miles? Heavy new supply typically softens prices + rents 12–24 months out; constrained supply supports both.
Investment metrics
- 1% rule
- 1.20% ✓
- Cap rate
- 10.38%
- Cash-on-cash
- 14.61%
- DSCR
- 1.65
- GRM
- 6.9
CMA / ARV
- ARV (on-the-fly)
- $184,072
- Comps found
- 12
Show comp detail 12 sales within ~0.75 mi
| Address | Dist | Beds/Ba | Sqft | Sold | Price | $/sf | Match |
|---|---|---|---|---|---|---|---|
| 46 Mill Pond Ln | 0.07mi | 3/2.0 | 1,206 (-0%) | 8mo | $195,000 | $162 | 90 |
| 589 Mill Pond Dr | 0.08mi | 3/2.0 | 1,189 (-2%) | 8mo | $196,000 | $165 | 87 |
| 765 Mill Pond Dr | 0.21mi | 3/2.0 | 1,200 (-1%) | 9mo | $182,000 | $152 | 82 |
| 33 Lake Ct | 0.24mi | 3/2.0 | 1,233 (+2%) | 7mo | $159,900 | $130 | 80 |
| 363 Mimosa Rd | 0.28mi | 3/2.0 | 1,122 (-7%) | 3mo | $188,000 | $168 | 72 |
| 280 Mill Pond Dr | 0.22mi | 3/2.0 | 1,311 (+8%) | 6mo | $164,815 | $126 | 71 |
| 6 Alabama Ave Ave | 0.54mi | 3/1.0 | 1,213 (+0%) | 5mo | $100,000 | $82 | 66 |
| 3 Vineyard Dr | 0.17mi | 3/2.0 | 1,374 (+14%) | 6mo | $234,450 | $171 | 64 |
| 2 Virginia St | 0.67mi | 3/2.0 | 1,168 (-4%) | 1mo | $167,000 | $143 | 62 |
| 714 Lee Road 443 | 0.68mi | 3/2.0 | 1,154 (-5%) | 6mo | $188,000 | $163 | 55 |
| 6 Virginia St | 0.69mi | 3/2.0 | 1,352 (+12%) | 0mo | $191,500 | $142 | 48 |
| 14 Mississippi Dr | 0.69mi | 3/2.0 | 1,388 (+15%) | 6mo | $160,900 | $116 | 38 |
Match score weights: distance 35% · size 25% · config 20% · recency 20%. Top-matched comps best support the ARV.
Projected returns pro-forma
-3.0% appreciation · 3.0% rent growth · sell at horizon
- IRR
- 5.0%
- Equity multiple
- 1.20×
- Total profit
- $8,515
- Equity at exit
- $23,186
- IRR
- 14.5%
- Equity multiple
- 2.16×
- Total profit
- $50,687
- Equity at exit
- $13,445
Cash invested: $43,540 (down + closing). Projections, not guarantees.
Landlord ↔ Tenant lean methodology
- Overall (STATE)
- 90 Strongly Landlord-Friendly
- State Alabama
- 90 Strongly Landlord-Friendly · R+15
- County
- — inherits STATE
- City
- — inherits STATE
ZIP-level market 36870
- Home prices YoY
- -10.5%
- Active inventory
- 132
- Price-to-rent
- 6.9×
Monthly cashflow live
- Estimated rent
- $1,870 medium interval (Pro) →
- Mortgage (P&I)
- −$815
- Tax from tax record
- −$67 /mo · $804/yr
- Insurance
- −$65
- HOA
- −$0
- Vacancy / Maint / Mgmt
- −$393
- Net cashflow
- $530
Break-even live
UW: 25.0% down · 7.5% · 30yr · 1.5% tax · 5.0% vac · 8.0% maint · 8.0% mgmt
Financing live
Cash to close
- Down payment
- $38,875
- Closing costs
- $4,665
- Reserves months
- —
- Total cash needed
- —
Loan-product check · same deal, 3 products live
Conventional
25% down · 7.5% · 30yr
- Down + closing
- —
- Monthly P&I
- —
- Monthly cashflow
- —
- DSCR
- —
- Eligible?
- —
Personal DTI + credit; lowest rate.
DSCR
20% down · 8.5% · 30yr
- Down + closing
- —
- Monthly P&I
- —
- Monthly cashflow
- —
- DSCR
- —
- Eligible?
- —
No personal income docs; deal must DSCR.
Hard money
10% down · 12.0% · 12mo
- Down + closing
- —
- Monthly P&I
- —
- Monthly cashflow
- —
- DSCR
- —
- Eligible?
- —
Short-term bridge; refi at stabilization.
Rent comps 2 comps
| Address | Beds | Baths | Sqft | Rent | $/sqft | DOM | Units | Dist |
|---|---|---|---|---|---|---|---|---|
| 567 Mill Pond Dr Phenix City, AL | 3.0 | 2.0 | 1240 | $1,400 | $1.13 | 13d | 1 | 0.10mi |
| 16 Vineyard Dr Phenix City, AL | 3.0 | 2.0 | 1324 | $1,600 | $1.21 | 44d | 1 | 0.52mi |
Listing history 21 events
-
2026-06-18days on market $155,500 Active 59 DOM
-
2026-06-17days on market $155,500 Active 58 DOM
-
2026-06-16days on market $155,500 Active 57 DOM
-
2026-06-15days on market $155,500 Active 56 DOM
-
2026-06-14days on market $155,500 Active 54 DOM
-
2026-06-13days on market $155,500 Active 53 DOM
-
2026-06-10days on market $155,500 Active 51 DOM
-
2026-06-09days on market $155,500 Active 50 DOM
-
2026-06-08days on market $155,500 Active 49 DOM
-
2026-06-07days on market $155,500 Active 48 DOM
-
2026-06-05days on market $155,500 Active 45 DOM
-
2026-06-02days on market $155,500 Active 43 DOM
-
2026-06-01days on market $155,500 Active 42 DOM
-
2026-05-31days on market $155,500 Active 41 DOM
-
2026-05-30days on market $155,500 Active 40 DOM
-
2026-05-06status Active
-
2026-04-24historical Contingent
-
2026-04-20price $155,500
-
2026-04-20$85,000 Active
-
2025-10-23price $169,000
-
2025-10-06$175,000 Active
ⓘ Source: listings_history table (triggers on properties + properties_extension) + one-shot
backfill from property_details.listing_events for pre-trigger history.
Tax reassessment forecast AL · Resets to sale price
- Current annual tax
- $804 · $67/mo
- Projected year-2 tax
- $804 · $67/mo
- Expected delta
- $0/yr ($0/mo · 0.0%)
ⓘ Screening estimate from a state-policy table — verify with the county assessor before closing.
Climate risk First Street
- Flood 1/10 Low FEMA zone X (unshaded) · 0% chance over 30 yrs
- Wildfire 4/10 Moderate
- Heat 7/10 Severe 7 d/yr ≥107°F today · 19 d/yr by 30 yrs out
- Wind 6/10 Major 76% chance of damaging wind over 30 yrs
- Air quality 4/10 Moderate 4 unhealthy d/yr today · 4 by 30 yrs out
Nearby sold comps map
Loading sold comps map…
Walkable amenities ~0.75 mi
Loading nearby amenities…
Taxation est. · year 1
- Rental income
- $22,441
- − Mortgage interest
- −$8,710
- − Property taxes
- −$804
- − Insurance
- −$778
- − Repairs & maintenance
- −$1,795
- − Management
- −$1,795
- − Depreciation
- −$4,524
- Taxable income
- $4,035
- Est. tax owed @ 24.0%
- −$968
- After-tax cash flow
- $5,393/yr
For passive investors: Depreciation is non-cash, so a rental often shows a tax loss while cash-flowing — sheltering income. Rental losses are passive: they offset passive income freely, and up to $25,000/yr can offset ordinary (W-2) income if you actively participate and your MAGI is under $100k (phasing out to $0 by $150k); unused losses carry forward. On sale, claimed depreciation is recaptured at up to 25%, and gains may owe capital-gains tax (a 1031 exchange can defer both). Figures are a year-1 estimate at your 24.0% rate — not tax advice; consult a CPA.
Schools (NCES district)
- District
- Phenix City
- NCES district ID
- 0102700
- Math proficiency
- 22% ▼ -24.00%
- Reading proficiency
- 44% ▼ -1.00%
- Median HH income
- $36,228
- Composite
- 27.29/100
- National rank
- #7001
- State rank
- #59 of 129 in AL
Livability — Phenix City
- Score
- 60/100
- State rank
- #297
- US rank
- #19037
Category grades
Schools grade is shown separately in the Schools card above.
Census & demographics
- Census place
- Phenix City, AL
- County
- Lee County · 144,175 people
- City population
- 62,290
- Metro
- Auburn-Opelika, AL
- Population (ZIP)
- 17,951
- Household income
- $72,500
- Rent vs Own
- Severe rent burden
- 500.0
Population outlook (Lee County) Hauer SSP2
- Today (2025)
- 196,440 people
- By 2030
- 217,417 · +10.7%
- By 2040
- 259,467 · +32.1%
- By 2050
- 301,557 · +53.5%
- By 2075
- 402,186 · +104.7%
- By 2100
- 474,503 · +141.6%
Race, ethnicity, and origin ACS 2023
- Neighborhood character
- Predominantly White (72%)
- Race & ethnicity
- White 72% Black 18% Two or more races 4% Hispanic / Latino 4%
- Common ancestry
- Slovak 3% Romanian 2% Portuguese 2%
- Foreign-born
- 3% · Canada, South Korea, Jamaica
- Languages at home
- 95% English-only · Spanish 3% Korean 1%
Political lean MEDSL · Lee
- 2024 margin
- Strong R (+27.8) · D 35.5% · R 63.3% · Other 1.2%
- 2008→2024 swing
- -8.1pp toward R · 2008: -19.8pp · 2024: -27.8pp
- All cycles
- 2024: R+27.8 2020: R+20.1 2016: R+23.1 2012: R+19.9 2008: R+19.8
Not yet ingested
- Civics
- —
Market trends
- HPI YoY
- ▼ -28.19%
- Current HPI
- 241.1403
- Rent YoY
- —
- Metro
- Auburn-Opelika, AL
- State GDP YoY
- ▲ 2.94%
- F500 in state
- 4
Industry mix (Fortune 500 HQ in AL)
| Industry | F500 HQs | Revenue |
|---|---|---|
| Financial Services | 1 | $8B |
|
||
| Healthcare | 1 | $5B |
|
||
Price history
-11.1% since first listed6 events — show timeline
- 2026-05-06 Relisted — MAAR
- 2026-04-24 Contingent — MAAR
- 2026-04-20 Price Changed $155,500 MAAR
- 2026-04-20 Listed $85,000 MAAR
- 2025-10-23 Price Changed $169,000 EABOR
- 2025-10-06 Listed $175,000 EABOR
Property tax history
+5.1%/yrLatest (2025): $804 · +7.4% YoY. Source: county tax records.
Cash-flow waterfall
monthlySold comps — $/sqft
last 12 mo · ≤1 miLoading sold comps…